Skip to comments.
The Coming Collapse in Housing
GoldSeek ^
| November 19, 2006
| Gary Shilling
Posted on 11/19/2006 7:42:06 PM PST by GodGunsGuts
click here to read article
Navigation: use the links below to view more comments.
first previous 1-20, 21-40, 41-54 last
To: GodGunsGuts
That's literally the size the graph came in. Check the properties and see for yourself.Maybe the problem was that you didn't know about html size controls:
<img src="http://www.census.gov/indicator/www/img/c20_curr.gif" border="0" width="350" height="236">
--the last numbers in quotes being how big it would be at first. The advantage is that then you can control size in your post, and good etiquette is to be considerate so any other person you care to impress can right click and get if full size only if there's interest. Otherwise, you're just offending people by flashing stuff that nobody's impressed with.
We're talking about forum standards aren't we?
To: expat_panama
Thanks. I'm a greenhorn when it comes to html. I will try to practice your mini-lesson on future graphs.
To: GodGunsGuts
It figures, when you actually do try to make a point, you blow it big time.Not at all.
No wonder you stick to muttering incomprehensibles.
Incomprehensible to you? That's a big category.
43
posted on
11/21/2006 9:42:19 AM PST
by
Petronski
(BRABANTIO: Thou art a villain. IAGO: You are--a senator. ---Othello I.i.)
To: GodGunsGuts
--my pleasure.
But back with housing starts, we had this same return to normal back in '84 and there was none of this 'housing-bubble nowhere-but-down' talk back then.
To: expat_panama
In HTML tags, when resizing a picture, it's best to specify the HEIGHT or the WIDTH tag, but not both. With only one number, the browser will scale it automatically, with two numbers, stretching/distortion could happen (if the two numbers result in an aspect ratio that differs from the source pic).
On the other hand, if both HEIGHT and WIDTH are specified, the browser will draw the page faster, because it will set aside the right space even before the pic can be loaded. Without both HEIGHT and WIDTH, the browser will get to that point in the code, request the pic file from the server, and continue drawing the page...then, when the pic file arrives, the broswer will redraw the page to make space for the pic. That "redraw" does take time.
I hope I explained that clearly, and I hope it's correct. I invite corrections.
45
posted on
11/21/2006 10:05:37 AM PST
by
Petronski
(BRABANTIO: Thou art a villain. IAGO: You are--a senator. ---Othello I.i.)
To: Petronski
then again, I find it a lot easier to write my posts into an html editor like MS FrontPage and enjoy the spell checker etc., and at the last minute copy and paste just the html codes (without all the < body > stuff that the freeper machine spits out. That way if I need to I can drag and drop margins when needed --kind of puts and effortless GUI with my post.
To: expat_panama
Just out of curiosity. How do you determine the starting size of a graph/graphic?
To: GodGunsGuts
size of a graph/graphic?Any time 3 geeks get together we end up with 4 opinions-- but my take is that your graphs in http://www.freerepublic.com/focus/f-news/1742145/posts?page=48#48 were convenient for me because they fit on my monitor screen easy.
You got me thinking so I right clicked properties on some fotos of the Washtimes.com and theirs are 340 pixels wide while those at InvestorsBusinessDaily are 250 pixels wide.
To: expat_panama
I'll be sure to try and change the size of the next graphic I post. In fact, I think I will post one right now.

Hey, it works! Thanks Expat!
To: GodGunsGuts
watch construction jobs completely dry up shortly
http://calculatedrisk.blogspot.com/2006/11/lazear-still-misunderstands-housing.html
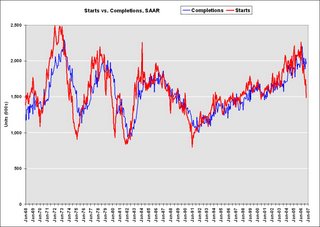
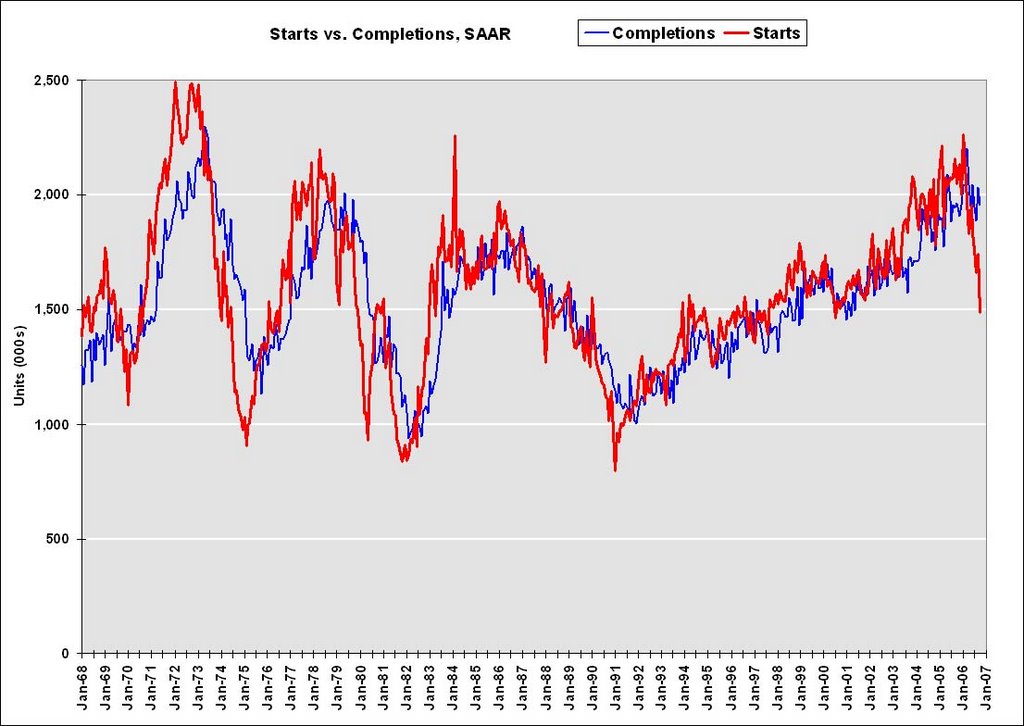
The first graph shows Starts vs. Completions. Starts have fallen "off a cliff", but completions have just started to fall.
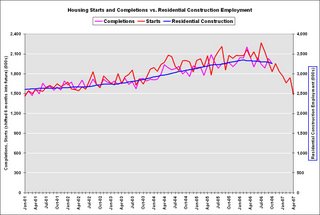
This graph shows starts, completions and residential construction employment. (starts are shifted 6 months into the future). Completions and residential construction employment are highly correlated, and Completions lag Starts by about 6 months. Based on historical correlations, it is reasonable to expect Completions and residential construction employment to follow Starts "off the cliff".
50
posted on
11/22/2006 7:09:03 AM PST
by
finnman69
(cum puella incedit minore medio corpore sub quo manifestu s globus, inflammare animos)
To: finnman69
Is there any way you could post the article connected to the link? For some reason my network is blocking access to the website. Thanks a bunch--GGG
To: finnman69
Excellent links! It's only a matter of time before prices follow.
To: GodGunsGuts
Lazear Still Misunderstands Housing
"The housing market, as you know, it has been hit, I think, harder than most of us had expected."
Edward Lazear, Q&A Nov 21, 2006, chairman of the White House's Council of Economic Advisers
During the housing boom, there were two distinct views of the causes of the boom. The consensus view was that the boom was mostly driven by fundamentals and perhaps a little "froth" in 2005.
The minority opinion was that the housing market had become a bubble. The minority view was based on evidence of speculation: flippers, a high percentage of investment purchases, and homebuyers using excessive leverage, especially with nontraditional mortgage products.
Now that the housing bust is here, there are also two views of the bust. The consensus view is that the "worst is over". The minority view is that the bust has a ways to go.
Not surprisingly, those that felt the boom was based on fundamentals now believe the worst is over. And those that felt the boom was driven by excessive speculation believe the housing market will continue to slowdown. How one viewed the housing boom colors how one looks at the housing bust.
All the evidence so far suggests the minority view was correct. The severity of the bust has caught the majority off guard as evidenced by Lazear's comments above. Here are Lazear's comments today on housing:
Question: I was wondering if you could talk more about your outlook for the housing market. Do you expect there to be -- it to bottom in 2007? And is the worst behind us in your opinion? And what are the risks, in your mind, of a recession?
And Lazear's answer:
CHAIRMAN LAZEAR: The housing market, as you know, it has been hit, I think, harder than most of us had expected. Most forecasters were expecting a slower decline. What that probably signals is that the future will not be as negative as it otherwise would have been because we've probably had much of the decline that we're expecting to have.
Maybe. The other possibility is that Lazear and most forecasters misunderstood the housing boom, and they remain too optimistic about the housing bust. Lazear:
That said, there are -- you know, there are a number of indications that things are still not as strong as they were last year in the housing market. You know, do I see that as a problem for the economy? Obviously, we don't like to see any one industry get hit and hit hard. That affects people's jobs. The good side of that, of course, has been that non-residential construction has taken up much of the slack in that industry. So we haven't seen construction jobs fall off dramatically as a result of the housing decline.
Residential construction is off $55 Billion (SAAR), and non-residential construction is up $38 Billion from December 2005 (Census Bureau,
Construction Spending). So Lazear is correct that non-residential spending has "taken up much of the slack".
But Lazear is overlooking a few facts: Even though starts have fallen off a cliff, completions are still near record levels - and when completions fall (they trail starts by about 6 months), construction spending will drop significantly. Also, non-residential investment tends to trail residential investment.
And the reason residential construction jobs haven't fallen "off dramatically as a result of the housing decline" is jobs track housing completions (for obvious reasons). I've presented these graphs before, but they fit here ...
Click on graph for larger image.The first graph shows Starts vs. Completions.
Starts have fallen "off a cliff", but completions have just started to fall.
This graph shows starts, completions and residential construction employment. (starts are shifted 6 months into the future). Completions and residential construction employment are highly correlated, and Completions lag Starts by about 6 months.
Based on historical correlations, it is reasonable to expect Completions and residential construction employment to follow Starts "off the cliff".
More Lazear:
And I would say that as we go forward what we'd be concerned about is employment in that industry and looking to see how it transmits to the rest of the economy. I don't believe that it is going to transmit to the rest of the economy. There's been no indication that it has. Other sectors remain strong. And that would be the primary danger that I would see from the housing market, whether it's bottomed out now or whether it will take another quarter or so to bottom out I think is still up for grabs, and I wouldn't want to speculate on it.
But I would be willing to tell you that I don't think that this signifies any kind of weakness throughout the economy, in fact the reverse. The job numbers I think are probably the best indicator that the economy is very strong and in really good shape.
Lazear doesn't want "to speculate" on when the housing market will bottom out, but then says "now ... or another quarter or so". Lazear has been consistently surprised by the housing bust, and my guess is he will be surprised some more! But on the last point, job numbers do tell us the economy is decent right now, but they tell us
nothing about the future.
Question: And the risk of recession, do you have a --
CHAIRMAN LAZEAR: Well, again the economy is growing. I don't even think we should be talking about going in the other direction at this point. The economy is growing. The economy is strong. The labor market is strong. You know, you see -- when you see jobs added at this rate, when you see unemployment at 4.4 percent, it's pretty hard to be thinking about things going in the other direction. I mean obviously at some time in the future things can change, but right now, as long as we keep our policies consistent with economic growth, which means keep taxes low, make sure that we don't put impediments, strong impediments to trade and business in there, I think we're on track for a strong economy.
What can I say? Oh, Lazear also revised down the White House estimates for GDP growth for Q4 and 2007.
53
posted on
11/22/2006 11:18:51 AM PST
by
finnman69
(cum puella incedit minore medio corpore sub quo manifestu s globus, inflammare animos)
To: GodGunsGuts
http://www.nahb.org/news_details.aspx?sectionID=148&newsID=3633
Indianapolis Takes Most-Affordable Title For Fifth Consecutive Quarter Printer Friendly
November 20, 2006 - Indianapolis, Ind., maintained its strong grip on the title of most affordable major U.S. housing market in the third quarter of 2006, according to the National Association of Home Builders/Wells Fargo Housing Opportunity Index (HOI), released today. This is the fifth consecutive time that the city has been named at the top of the affordability chart.
Meanwhile, on a national basis, housing affordability remained virtually unchanged from the second quarter despite a sizeable increase in the average mortgage interest rate for the July-September period.
“Today’s HOI reading indicates that 40.4 percent of all new and existing homes that were sold during the third quarter were affordable to families earning the median U.S. income of $59,600,” said NAHB President David Pressly, a home builder from Statesville, N.C. “This indicates that housing affordability barely budged between the second and third quarter, in part because higher mortgage rates in the period were offset by somewhat lower home prices in many markets.”
The HOI indicates that the national weighted interest rate on fixed and adjustable-rate mortgages – a key component in calculating the HOI – was 6.77 percent in the third quarter, a full 12 basis points above what it was for the previous three months.
In the nation’s most affordable major housing market of Indianapolis, just under 86 percent of homes sold in the third quarter were affordable to families earning the median household income of $65,100. The median sales price of all homes sold in the metro area during that time was $122,000 – up slightly from $120,000 in the previous quarter.
Also near the top of the list for affordable major metros in the third quarter were Youngstown-Warren-Boardman, Ohio-Pa.; followed by Detroit-Livonia-Dearborn, Mich.; Buffalo-Niagara Falls, N.Y.; and Grand Rapids-Wyoming, Mich., in that order.
Seven smaller metro markets outranked all others in terms of housing affordability during the third quarter, including Bay City, Mich. at the top of the list; Springfield, Ohio; Mansfield, Ohio; Lansing-East Lansing, Mich.; Lima, Ohio; Battle Creek, Mich.; and Canton-Massillon, Ohio.
Also maintaining its previous standing on the HOI was Los Angeles-Long Beach-Glendale, Calif., which was the nation’s least affordable major housing market for an eighth consecutive quarter. There, only 1.8 percent of new and existing homes sold during the third quarter were affordable to those earning the area’s median family income of $56,200. The median sales price of all homes sold in the area during the period was $523,000.
Other major metros at the bottom of the housing affordability chart were all in California, including: Santa Ana-Anaheim-Irvine, Modesto, Stockton, and San Diego-Carlsbad-San Marcos, in that order.
Among metro areas smaller than 500,000 people, California once again scored every entry at the bottom of the affordability chart. Earning least-affordable honors were: Salinas, Merced, Madera, Napa, and Santa Barbara-Santa Maria, Calif., respectively.
Please visit:
http://www.nahb.org/page.aspx/category/sectionID=135
for tables, historic data and details.
EDITOR’S NOTE: The NAHB/Wells Fargo HOI is a measure of the percentage of homes sold in a given area that are affordable to families earning that area’s median income during a specific quarter. Prices of new and existing homes sold are collected from actual court records by First American Real Estate Solutions, a marketing company. Mortgage financing conditions incorporate interest rates on fixed- and adjustable-rate loans reported by the Federal Housing Finance Board.
The NAHB/Wells Fargo Housing Opportunity Index is strictly the product of NAHB Economics, and is not seen or influenced by any outside party prior to being released to the public.
54
posted on
11/22/2006 11:22:03 AM PST
by
finnman69
(cum puella incedit minore medio corpore sub quo manifestu s globus, inflammare animos)
Navigation: use the links below to view more comments.
first previous 1-20, 21-40, 41-54 last
Disclaimer:
Opinions posted on Free Republic are those of the individual
posters and do not necessarily represent the opinion of Free Republic or its
management. All materials posted herein are protected by copyright law and the
exemption for fair use of copyrighted works.
FreeRepublic.com is powered by software copyright 2000-2008 John Robinson
 Click on graph for larger image.