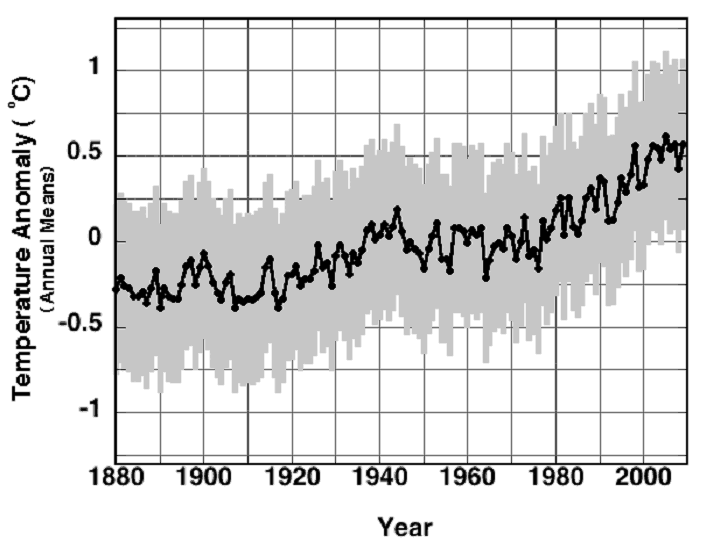
Figure Legend: (•), the global surface air temperature anomaly series through 2009, as updated on 18 February 2010, (data.giss.nasa.gov/gistemp/graphs/). The grey error bars show the annual anomaly lower-limit uncertainty of (+/-)0.46 C.
Posted on 01/18/2011 7:24:19 PM PST by Ernest_at_the_Beach
Guest article by Pat Frank
We’ve all read the diagnosis, for example here, that the global climate has suffered “unprecedented warming,” since about 1900. The accepted increase across the 20th century is 0.7 (+/-)0.2 C. As an experimental chemist, I always wondered at that “(+/-)0.2 C.” In my experience, it seemed an awfully narrow uncertainty, given the exigencies of instruments and outdoor measurements.
When I read the literature, going right back to such basics as Phil Jones’ early papers [1, 2], I found no mention of instrumental uncertainty in their discussions of sources of error.
The same is true in Jim Hansen’s papers, e.g. [3]. It was as though the instrumental readings themselves were canonical, and the only uncertainties were in inhomogeneities arising from such things as station moves, instrumental changes, change in time of observation, and so on.
But Phil Brohan’s paper in 2006 [4], on which Phil Jones was a co-author, discussed error analysis more thoroughly than previously done. Warwick has posted, and here on the change that occurred in 2005, when the UK Met Office took over for the Climate Research Unit of the UEA, in compiling the global average temperature record. So, maybe Phil Brohan decided to be more forthcoming about their error models.
The error analysis in Brohan, 2006, revealed that they’d been taking a signal averaging approach to instrumental error. The assumption was that all the instrumental error was random, independent, identically distributed (iid) error. This kind of error averages out to zero when large numbers of measurements are averaged together.
To make the long story short, it turned out that no one had ever surveyed the temperature sensors of climate stations to see whether the assumption of uniformly iid measurement errors could be empirically validated.
That led to my study, and the study led to the paper that is just out in Energy and Environment [5]. Here’s the title and the abstract:
Title: “Uncertainty in the Global Average Surface Air Temperature Index: A Representative Lower Limit”
Abstract: “Sensor measurement uncertainty has never been fully considered in prior appraisals of global average surface air temperature. The estimated average (+/-)0.2 C station error has been incorrectly assessed as random, and the systematic error from
uncontrolled variables has been invariably neglected. The systematic errors in measurements from three ideally sited and maintained temperature sensors are calculated herein. Combined with the (+/-)0.2 C average station error, a representative lower-limit uncertainty of (+/-)0.46 C was found for any global annual surface air temperature anomaly. This (+/-)0.46 C reveals that the global surface air temperature anomaly trend from 1880 through 2000 is statistically
indistinguishable from 0 C, and represents a lower limit of calibration uncertainty for climate models and for any prospective physically justifiable proxy reconstruction of paleo-temperature. The rate and magnitude of 20th century warming are thus unknowable, and suggestions of an unprecedented trend in 20th century global air temperature are unsustainable.”
Here’s the upshot of the study in graphical form; Figure 3 from the paper showing the 20th century average surface air temperature trend, with the lower limit of instrumental uncertainty as grey error bars.
Figure Legend: (•), the global surface air temperature anomaly series through 2009, as updated on 18 February 2010, (data.giss.nasa.gov/gistemp/graphs/). The grey error bars show the annual anomaly lower-limit uncertainty of (+/-)0.46 C.
The lower limit of error was based in part on the systematic error displayed by the Minimum-Maximum Temperature System under ideal site conditions. I chose the MMTS because that sensor is the replacement instrument of choice brought into the USHCN since about 1990.
This lower limit of instrumental uncertainty implies that Earth’s fever is indistinguishable from zero Celsius, at the 1σ level, across the entire 20th century.
References:
1. Jones, P.D., Raper, S.C.B., Bradley, R.S., Diaz, H.F., Kellyo, P.M. and Wigley, T.M.L., Northern Hemisphere Surface Air Temperature Variations: 1851-1984, Journal of Climate and Applied Meteorology, 1986, 25 (2), 161-179.
2. Jones, P.D., Raper, S.C.B. and Wigley, T.M.L., Southern Hemisphere Surface Air Temperature Variations: 1851-1984, Journal of Climate and Applied Meteorology, 1986, 25 (9), 1213-1230.
3. Hansen, J. and Lebedeff, S., Global Trends of Measured Surface Air Temperature, J. Geophys. Res., 1987, 92 (D11), 13345-13372.
4. Brohan, P., Kennedy, J.J., Harris, I., Tett, S.F.B. and Jones, P.D., Uncertainty estimates in regional and global observed temperature changes: A new data set from 1850, J. Geophys. Res., 2006, 111 D12106 1-21; doi:10.1029/2005JD006548; see www.cru.uea.ac.uk/cru/info/warming/.
5. Frank, P., Uncertainty in the Global Average Surface Air Temperature Index: A Representative Lower Limit, Energy & Environment, 2010, 21 (8), 969-989.
Posted in Jones et al, Surface Record | 17 Comments »
This seems major to me....
Interesting. Yup, how do you get three significant digits for “global temperature”, especially prior to 1945?
In my world, everything has error bars, even when I count upsets in an SRAM.
interesting..thanks
*********************************EXCERPT******************************************
Dave N Says:
January 15th, 2011 at 2:23 am
Interesting how one can draw an almost flat line that stays within the error bars.
********************************EXCERPT********************************************
Pat Frank Says:
January 15th, 2011 at 12:53 pm
Thanks to everyone for their interest.
#1 cementafriend, errors usually sum as the sqrt(sum of squares), but I agree with you that a full accounting of error in the global temperature record will be much higher than usually admitted. We’re all waiting for Anthony Watts and Joe D’Aleo to publish their study of site errors in the USHCN network. No doubt but that it’ll be a stunning revelation. I just concentrated on the instrumental error, under ideal conditions, to get a handle on the minimal expected measurement uncertainty. That, by itself, turns out to be enough to render the global temperature trend moot.
#2, Dave, you’re right and that’s the whole conclusion.
#3, thanks, woodNfish, and pattoh, #4, looking at your graph we can follow the Idsos and observe that there’s not much evidence of global warming there.
To all, I mistakenly sent Warwick a prior version of the article abstract. I’m guessing that in a day or so he’ll replace it with the correct one that I just sent him. Just so you know there’s no fancy two-step going on. ![]()
I noticed that!
There are articles out now that discuss 2010 as being the “warmest year”- yeah, by .015 C or so, like you can measure “earth temperature” to that precision!
It’s like those people who hear ghosts listening to audio recording hiss from ambient recordings.
***********************************EXCERPT***************************************
Geoff Sherrington Says:
January 15th, 2011 at 3:00 pm
There is further error measurement by Jane Warne of BOM at Broadmeadows, N of Melbourne
http://www.geoffstuff.com/Jane%20Warne%20thermometry%20Broadmeadows.pdf
There is a quite fundamental question which I have never seen addressed. In the reconciliation with temperatures over the land or sea surface, should on measure 1 mm, 1 cm, 1 m, 1 km or 10 km above the surce, or at some intermediate value determined by experiment?
If the experiment has been done, what was its purpose and how was it established as the “right” altitude?
It seems that we are adopting initial conditions for complicated model projections like GCMs based on the convenience of being able to read a thermometer at about eye level.
Is that a scientific approach?
*********************************EXCERPT**************************************
val majkus Says:
January 17th, 2011 at 7:40 pm
I see there’s another great post by Ira Glickstein on WUWT
iT’S about data bias
This posting is about how the official climate Team has (mis)adjusted past temperature data to exaggerate warming, and how the low quality of measurement stations and their encroachment by urban heat island (UHI) developments have distorted the historical record.
http://wattsupwiththat.com/2011/01/16/the-past-is-not-what-it-used-to-be-gw-tiger-tale/#more-31814
Ira Glickstein is the expert who had a previous post on WUWT on the race between 1934 and 1998 to be the highest temperature; I recall she had a ski slide for 1934 and a ski lift for 1998 and itemised the adjustments made to the two temperatures with the result that 1934 lost the race; in her words ‘bad luck to the old timer’
CONCLUSIONS
It seems to me that my estimate of 0.3ºC for Data Bias and Station Quality is fully justified, but I am open to hearing the opinions of WUWT readers who may think I have over- (or under-) estimated this component of the supposed 0.8ºC rise in global temperatures since 1880.
Here’s the other Ira Glickstein post
http://wattsupwiththat.com/2010/12/25/do-we-care-if-2010-is-the-warmist-year-in-history/
selective quote
OOPS, the hot race continued after the FOIA email! I checked the tabular data at GISS Contiguous 48 U.S. Surface Air Temperature Anomaly (C) today and, guess what? Since the Sato FOIA email discussed above, GISS has continued their taxpayer-funded work on both 1998 and 1934. The Annual Mean for 1998 has increased to 1.32ºC, a gain of a bit over an 11th of a degree (+0.094ºC), while poor old 1934 has been beaten down to 1.2ºC., a loss of about a 20th of a degree (-0.049ºC). So, sad to say, 1934 has lost the hot race by about an eighth of a degree (0.12ºC). Tough loss for the old-timer.
I don’t even know where to stick the thermometer.
More from the Comments:
********************************************EXCERPT***********************************
Graeme Inkster Says:
January 17th, 2011 at 3:02 pm
What sort of thermometers do they use? Sorry to ask but I’m new to this.
You can get calibrated (mercury) thermometers to 0.1 deg C, but they are quite expensive. I can’t see the typical Govt. Purchasing Dept. buying them [even at less than $150 each in bulk] when they could buy the “equivalent” at $1. Unless the respective BOM’s bought them themselves, or kept instructing each new Purchasing Officer on what to buy, then the cheap ones would be bought.
Use (or substitution/replacement) with ordinary thermometers introduces an error of over 0.5 deg. [if you've ever checked a box of them you'd know]. If they use thermocouples and automatic recording, how well are these calibrated at the start, and after time?
And then there is the well known problem of getting people to read them accurately. It is well known that in the USSR the colder the temperature reported, the more heating oil was allocated by the Central Bureau. A certain tendency to “underestimate” developed, but disappeared after the breakup when there was no point in doing so. But have those records ever been corrected? So from 1985 to 1995 there would have been a jump in the supposed temperature regardless of any actual trend.
******************************EXCERPT***********************************
Pat Frank Says:
January 18th, 2011 at 5:18 am
#13, Graeme, most 20th century readings were made using specialized mercury-style thermometers inside a shelter — typically a Stevenson screen (aka Cotton Regional Shelter). Over the last twenty years or so, these have been systematically replaced in North America and Europe with precision resistance thermometers inside gilled chambers, often aspirated. There’s a good run-down here of the various types of thermometers and shelters in use.
In the laboratory, the best thermometers can be calibrated to (+/-)0.1 C, although the older mercury thermometers varied in precision and may not have markings every 0.1 C. However, the real question is precision and accuracy in the field, rather than in the lab.
The screens and shelters help prevent sun and wind (among other factors) from distorting the temperature readings. But they’re not perfect, and there is systematic error in the temperature measurements.
It’s pretty clear that climate scientists have just assumed that all the measurement errors just average away. But they’ve never surveyed the thermometers and sensors in the field to test this assumption and demonstrate its validity. After my own look at published material, the evidence is that this assumption doesn’t hold at all. But in any case, such negligence is hardly the way to do experimental science, and certainly no way to justify forcing huge economic dislocations.
Great one liner! I seldom comment, but had to on this one. Thanks for the grins.
***********************************EXCERPT*******************************************
Graeme Inkster Says:
January 18th, 2011 at 10:40 am
#15 Pat Frank – thanks. Were the thermometers in use in, say, 1910 as precise as those in 1980? Were they ever re-calibrated? I know it was done with one set of data from the 1700’s (I think Yale Uni) with the original thermometer(s?) and the temperature records were modified because of the big difference between the original and modern thermometer. [sorry, I've lost reference; I think H. Lamb].
Unless the instruments are/were calibrated regularly then any instrumental errors are “locked into the record”. I don’t disagree at all with your statement about the possible error range. It is more than likely that with human error it could be larger e.g. the policeman who checked the temperature at the same time every morning at 9 a.m. It turned out in practice to be after breakfast, which varied in time with the seasons. Equally, other readings were dependent on him not being busy at that time, even to the extent of records for 3 days when his dairy showed him a hundred miles away from the station house. See also the russian note in my original.
We do know that the temperature (at least in Northern Europe) went up between 1880 and 1940 because the Icelanders were able to resume growing oats/barley in the 1920’s after a hiatus of 400 years or more. But to claim that the “temperature of the Earth” (whatever that is) can be measured to hundreds of a degree as is now claimed is ludicrous. They are making the old error of “4 decimal places must be more accurate than 1 place” when they should (as you say) be wondering how accurate are the original readings.
Stick a thermometer in Massachusetts.
I think the orifice you're looking for is called Zimbabwe.
bttt

Disclaimer: Opinions posted on Free Republic are those of the individual posters and do not necessarily represent the opinion of Free Republic or its management. All materials posted herein are protected by copyright law and the exemption for fair use of copyrighted works.
