Free Republic
Browse · Search
General/Chat
Topics · Post Article

Skip to comments.

Where are the Welfare Population Centers?
Vanity | 12/8/2011 | pgyanke

Posted on 12/08/2011 1:29:38 PM PST by pgyanke

I'm in a conversation with a lib. I'm sure that the welfare receiving populations are concentrated in the cities... but I can't find an article to show that (and you know libs need proof from a published source). Can anyone help me prove my assertion?


TOPICS: Business/Economy; History; Miscellaneous; Society
KEYWORDS: cities; welfare
Navigation: use the links below to view more comments.
first 1-2021-26 next last
Thank you in advance.
1 posted on 12/08/2011 1:29:41 PM PST by pgyanke
[ Post Reply | Private Reply | View Replies]

To: pgyanke

I don’t have anything specific to offer, but would suggest you check info on Detroit, and then Florida. I heard something on TV a week or 2 ago to the effect that 1/3 of the homeless people in the US live in FL. ?? Good luck.


2 posted on 12/08/2011 1:33:21 PM PST by NEMDF
[ Post Reply | Private Reply | To 1 | View Replies]

To: pgyanke

U. S. Statistical Abstract might have the data. It is on line.


3 posted on 12/08/2011 1:35:43 PM PST by AEMILIUS PAULUS (It is a shame that when these people give a riot)
[ Post Reply | Private Reply | To 1 | View Replies]

To: NEMDF

If I were homeless, I’d definitely be heading south. I damn sure don’t want to spend a Michigan winter living on the streets.


4 posted on 12/08/2011 1:35:56 PM PST by cripplecreek (Stand with courage or shut up and do as you're told.)
[ Post Reply | Private Reply | To 2 | View Replies]

To: AEMILIUS PAULUS

I’ll try that. Thank you.


5 posted on 12/08/2011 1:40:16 PM PST by pgyanke (Republicans get in trouble when not living up to their principles. Democrats... when they do.)
[ Post Reply | Private Reply | To 3 | View Replies]

To: pgyanke

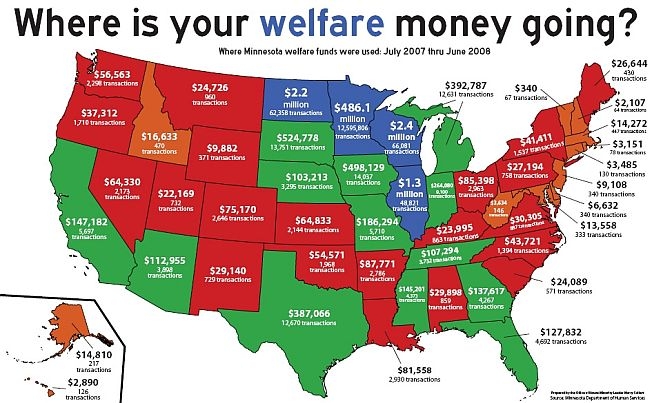
Courtesty of purblicradio.org. This is in 2008 - I'd wager it's significantlly more definitive now.

6 posted on 12/08/2011 1:41:38 PM PST by Hodar ( Who needs laws; when this FEELS so right?)
[ Post Reply | Private Reply | To 1 | View Replies]

To: AEMILIUS PAULUS

Unless I’m missing something, I can see the raw numbers and it’s broken out by a lot of demographics... but not by location.


7 posted on 12/08/2011 1:45:00 PM PST by pgyanke (Republicans get in trouble when not living up to their principles. Democrats... when they do.)
[ Post Reply | Private Reply | To 3 | View Replies]

To: pgyanke

Do a demographic search on cities. That will tell you where the consentration of welfare pimps are located. Look for holder’s “people.” You will not be wrong.


8 posted on 12/08/2011 1:46:05 PM PST by SaraJohnson
[ Post Reply | Private Reply | To 1 | View Replies]

To: Hodar

Interesting map... do you know what the colors represent?


9 posted on 12/08/2011 1:47:00 PM PST by pgyanke (Republicans get in trouble when not living up to their principles. Democrats... when they do.)
[ Post Reply | Private Reply | To 6 | View Replies]

To: pgyanke

I suggest you look at welfar on a per capita basis, not overall numbers per city or state.

This should help
http://www.statemaster.com/graph/eco_wel_cas_tot_rec_percap-caseloads-total-recipients-per-capita

You might be surprised at which states have the most welfare recipients per capita.


10 posted on 12/08/2011 1:47:42 PM PST by Lorianne
[ Post Reply | Private Reply | To 1 | View Replies]

To: pgyanke

11 posted on 12/08/2011 1:49:36 PM PST by Lorianne
[ Post Reply | Private Reply | To 1 | View Replies]

To: pgyanke

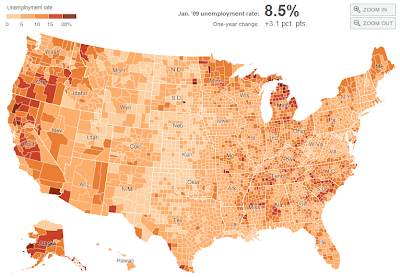
check out the national maps that show county-by-county results in the 2000, 2004 and 2008 pres elections

The ones that went “blue” define the welfare ghetto concentrations


12 posted on 12/08/2011 1:49:43 PM PST by silverleaf (common sense is not so common- voltaire)
[ Post Reply | Private Reply | To 1 | View Replies]

To: pgyanke
do you know what the colors represent?

Nope, no legend.

13 posted on 12/08/2011 1:50:27 PM PST by Hodar ( Who needs laws; when this FEELS so right?)
[ Post Reply | Private Reply | To 9 | View Replies]

To: pgyanke
Why Cities matter to Welfare Reform (1999 statistics)

Snip: In 1999, ten states accounted for nearly 70 percent of national welfare cases, up significantly from 42.5 percent in 1994. The bulk of the national welfare population can be found in: California, Florida, Georgia, Illinois, Michigan, New York, Ohio, Pennsylvania, Texas, and Washington. These ten states contained 53 percent of the overall national population in 1999.

In 1999, ten urban counties contained nearly one third (32.7 percent) of the entire nation's welfare cases, up from less than a quarter (24.0 percent) in 1994. The ten counties are: Los Angeles County, New York City, Cook County (Chicago), Philadelphia County, San Bernadino County, Wayne County (Detroit), San Diego County, Sacramento County, Fresno County, and Cuyahoga County (Cleveland). These counties contained only 12.2 percent of the overall national population in 1999.

Benefits shut off for 41,000 Michigan Welfare Recipients

Snip: On Saturday, Oct. 1, 41,000 Michigan welfare recipients will lose cash benefits in the amount of approximately $515 each. Gov. Rick Snyder capped maximum welfare payments at 48 months. Several Michigan recipients filed a class action lawsuit to overturn the four-year cap.

Five years was the original cap on cash assistance for welfare. In some cases, extensions were available for those in need. The lawsuit says that the welfare cap violates the due process clause of the 14th amendment. They claim that the cutoff notices were vague and generic. The plaintiffs are asking a federal judge to issue a temporary restraining order against the cap.

14 posted on 12/08/2011 1:50:40 PM PST by MamaDearest
[ Post Reply | Private Reply | To 1 | View Replies]

To: pgyanke

All you need to do is google it.


15 posted on 12/08/2011 1:52:07 PM PST by exnavy (May the Lord bless and keep our troops.)
[ Post Reply | Private Reply | To 1 | View Replies]

To: pgyanke

http://www.washingtonpost.com/wp-srv/politics/interactives/campaign08/election/uscounties.html

check this out


16 posted on 12/08/2011 1:53:04 PM PST by silverleaf (common sense is not so common- voltaire)
[ Post Reply | Private Reply | To 1 | View Replies]

To: pgyanke

http://elections.nytimes.com/2008/results/president/map.html

even better


17 posted on 12/08/2011 1:56:33 PM PST by silverleaf (common sense is not so common- voltaire)
[ Post Reply | Private Reply | To 1 | View Replies]

To: pgyanke

Some related information might be gleaned from here: http://maps.ers.usda.gov/FoodAtlas/


18 posted on 12/08/2011 2:05:39 PM PST by ctdonath2 ($1 meals: http://abuckaplate.blogspot.com/)
[ Post Reply | Private Reply | To 1 | View Replies]

To: pgyanke

Only food stamps:

http://frac.org/reports-and-resources/county-by-county-review-of-snapfood-stamp-participation-nytimes/

And consider the source...


19 posted on 12/08/2011 2:06:41 PM PST by mrsmith (Start electing a 'Tea Party' Majority Leader in 2012 now!)
[ Post Reply | Private Reply | To 1 | View Replies]

To: pgyanke
Here is a welfare concentration map by county. (kind of hard to read but the darker, the greater the concentration).


20 posted on 12/08/2011 2:13:01 PM PST by mnehring
[ Post Reply | Private Reply | To 1 | View Replies]


Navigation: use the links below to view more comments.
first 1-2021-26 next last

Disclaimer: Opinions posted on Free Republic are those of the individual posters and do not necessarily represent the opinion of Free Republic or its management. All materials posted herein are protected by copyright law and the exemption for fair use of copyrighted works.

Free Republic
Browse · Search
General/Chat
Topics · Post Article

FreeRepublic, LLC, PO BOX 9771, FRESNO, CA 93794
FreeRepublic.com is powered by software copyright 2000-2008 John Robinson