Skip to comments.
Mish's Complete Look at Employment Numbers
Townhall.com ^
| March 9, 2013
| Mike Shedlock
Posted on 03/09/2013 8:57:05 AM PST by Kaslin
The establishment survey reports of +236,000 job.
For the first time in four months the establishment survey was accompanied by a healthy +170,000 surge in the household survey.
Let's dig deeper.
The economy added a whopping 446,000 part-time jobs. Thus, the economy shed 276,000 full-time jobs. Those part-time jobs were supposedly "on purpose".
It's fair to point out the volatile nature of part-time statistics, but the 446,000 increase is unusually large.
One possible explanation for the surge in voluntary part-time employment is retirees needing additional income. However, that theory is not consistent with a labor force shedding 130,000 workers.
Part-time employment for "economic reasons" rose by 15,000.
Those not in the labor force rose by 296,000 and the labor force itself fell by 130,000. Those factors, coupled with the massive rise in part-time employment explains the .2 drop in the unemployment rate.
Long-term unemployment (27 weeks or more) rose by 89,000, the first increase since October.
This is a decent report, but it is nowhere near as good as it looks at first glance, with obvious questions about part-time employment and duration of unemployment.
February BLS Jobs Report at a Glance
- Payrolls +236,000 - Establishment Survey
- US Employment +170,000 - Household Survey
- US Unemployment -300,000 - Household Survey
- Involuntary Part-Time Work +15,000 - Household Survey
- Voluntary Part-Time Work +446,000 - Household Survey
- Baseline Unemployment Rate -.02 at 77% - Household Survey
- U-6 unemployment -.01 to 14.3% - Household Survey
- The Civilian Labor Force -130,000 - Household Survey
- Not in Labor Force +296,000 - Household Survey
- Participation Rate -.01 to 63.5 - Household Survey
Recall that the unemployment rate varies in accordance with the Household Survey not the reported headline jobs number, and not in accordance with the weekly claims data.
Quick Notes About the Unemployment Rate
- In the last year, those "not" in the labor force rose by 1,693,000
- Over the course of the last year, the number of people employed rose by 1,473,000
- In the last year the number of unemployed fell from 12,806,000 to 12,032,000 (a drop of 774,000)
- Long-Term unemployment (27 weeks and over) rose to 4,797,000 from last month's total of was 4,708,000, a net rise of 89,000
- Percentage of long-term unemployment hopped up to 40.2% from last month's 38.1%. Once someone loses a job it is still very difficult to find another.
February 2013 Jobs Report
Please consider the Bureau of Labor Statistics (BLS) February 2013 Employment Report.
Total nonfarm payroll employment increased by 236,000 in February, and the unemployment rate edged down to 7.7 percent, the U.S. Bureau of Labor Statistics reported today. Employment increased in professional and business services, construction, and health care.
Click on Any Chart in this Report to See a Sharper Image
Unemployment Rate - Seasonally Adjusted

Average weekly hours rose .1 to at 34.5 hours. A year ago average hours were 34.6 hours. Average hourly earnings rose .05 to $23.82.
Real wages have been declining. Add in increases in state taxes and the average Joe has been hammered pretty badly. For 2013, one needs to factor in the increase in payroll taxes for Social Security.
For further discussion of income distribution, please see What's "Really" Behind Gross Inequalities In Income Distribution?
BLS Birth-Death Model Black Box
The BLS Birth/Death Model is an estimation by the BLS as to how many jobs the economy created that were not picked up in the payroll survey.
The Birth-Death numbers are not seasonally adjusted, while the reported headline number is. In the black box the BLS combines the two, coming up with a total.
The Birth Death number influences the overall totals, but the math is not as simple as it appears. Moreover, the effect is nowhere near as big as it might logically appear at first glance.
Do not add or subtract the Birth-Death numbers from the reported headline totals. It does not work that way.
Birth/Death assumptions are supposedly made according to estimates of where the BLS thinks we are in the economic cycle. Theory is one thing. Practice is clearly another as noted by numerous recent revisions.
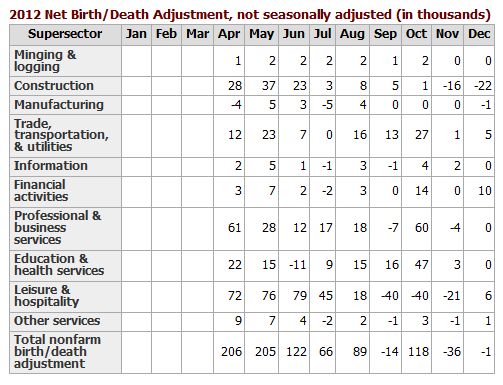
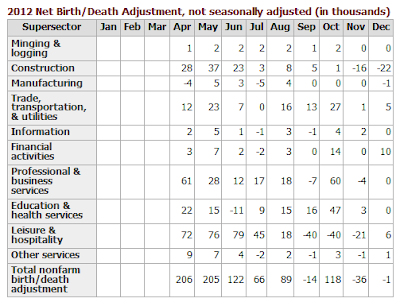
Birth Death Model Adjustments For 2012
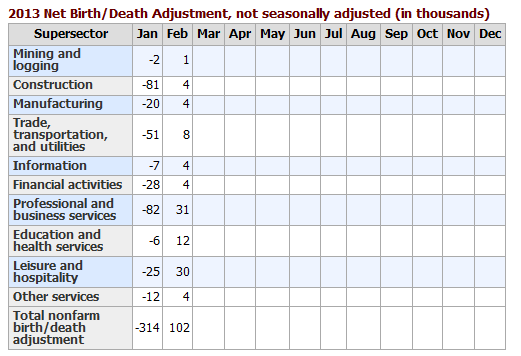
Birth Death Model Adjustments For 2013

Birth-Death Notes
Once again: Do NOT subtract the Birth-Death number from the reported headline number. That approach is statistically invalid.
In general, analysts attribute much more to birth-death numbers than they should. Except at economic turns, BLS Birth/Death errors are reasonably small.
For a discussion of how little birth-death numbers affect actual monthly reporting, please see BLS Birth/Death Model Yet Again.
Household Survey Data

Decline in Labor Force Factors
- Discouraged workers stop looking for jobs
- People retire because they cannot find jobs
- People go back to school hoping it will improve their chances of getting a job
- People stay in school longer because they cannot find a job
Were it not for people dropping out of the labor force, the unemployment rate would be well over 10%.
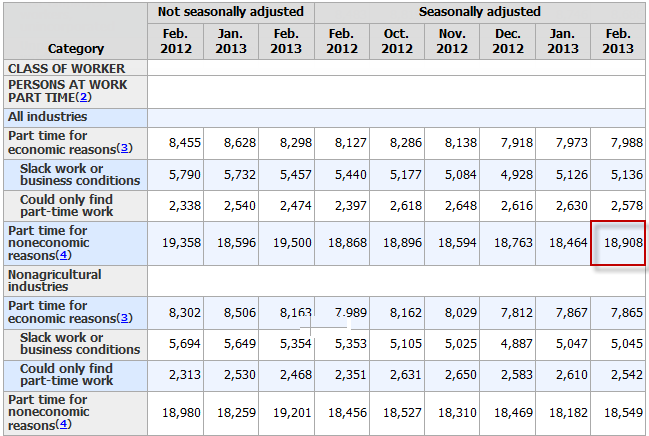
Part Time Status (in Thousands)

click on chart for sharper image
There are 7,988,000 workers who are working part-time but want full-time work. This is a volatile series.
Table 15 BLS Alternate Measures of Unemployment

click on chart for sharper image
Table A-15 is where one can find a better approximation of what the unemployment rate really is.
Notice I said "better" approximation not to be confused with "good" approximation.
The official unemployment rate is 7.7%. However, if you start counting all the people who want a job but gave up, all the people with part-time jobs that want a full-time job, all the people who dropped off the unemployment rolls because their unemployment benefits ran out, etc., you get a closer picture of what the unemployment rate is. That number is in the last row labeled U-6.
U-6 is much higher at 14.3%. Both numbers would be way higher still, were it not for millions dropping out of the labor force over the past few years.
Duration of Unemployment

Long-term unemployment remains in a disaster zone with 38% of the unemployed in the 27 weeks or longer category.
Grossly Distorted Statistics
Given the complete distortions of reality with respect to not counting people who allegedly dropped out of the work force, it is easy to misrepresent the headline numbers.
Digging under the surface, much of the drop in the unemployment rate over the past two years is nothing but a statistical mirage. Things are much worse than the reported numbers indicate.
TOPICS: Business/Economy; Culture/Society; Editorial
KEYWORDS:
1
posted on
03/09/2013 8:57:05 AM PST
by
Kaslin
To: Kaslin
Numbers, numbers. All the low info voters want to know is “can I get a data plan with my Obamaphone?”.
2
posted on
03/09/2013 9:02:58 AM PST
by
Flick Lives
(We're going to be just like the old Soviet Union, but with free cell phones!)
To: Kaslin
To: Kaslin
I don't know who Shedlock is but I can say he is a moron. There are almost 9 million jobs that have disappeared from the work force since 2008. There are millions upon millions of people who have simply 'dropped-out' of the work force having given up trying to find a job. There are millions who simply took their 99 weeks and then gave up.
Obviously this nitwit can't add 2 + 2. Obamacare has forced weekly hours for millions to 29 hours or below. So the waitress at Joe's now walks across the street to to Benny's where she is hired for another 29 hours or less,.....wait for it,.........because Benny's waitress just did the same thing over at Joe's.
Around here there are stores that have been shuttered for the last 4 years, never to ever reopen. I see no new businesses opening up. Just old ones folding. JCpenny at the mall is about to go under.
But I suppose as good loyal Americans we should all celebrate out Communist leader and the fine work he's done to enslave us.
4
posted on
03/09/2013 9:06:31 AM PST
by
Doc Savage
("I've shot people I like a lot more,...for a lot less!" Raylan Givins)
To: Kaslin
5
posted on
03/09/2013 9:14:33 AM PST
by
Diana in Wisconsin
(I don't have 'Hobbies.' I'm developing a robust Post-Apocalyptic skill set...)
To: Doc Savage
I don't know who Shedlock is but I can say he is a moron. It doesn't appear that you read the entire article.
6
posted on
03/09/2013 9:21:02 AM PST
by
EVO X
To: Kaslin
He could save us a LOT of time if he just listed the total number of people in the workforce. Everything else is spin.
7
posted on
03/09/2013 9:29:29 AM PST
by
Bryan24
(When in doubt, move to the right..........)
To: Bryan24
"He could save us a LOT of time if he just listed the total number of people in the workforce. Everything else is spin."
Yes...and at what level. Part time, full time??
Everything else is as you say, purely a manipulation of a numerator and denominator.
8
posted on
03/09/2013 9:38:41 AM PST
by
Tula Git
To: Kaslin

the only numbers that count are
1)the number of adults of working age
2)the number of adults of working age WORKING!!!
but it seems they never publish them...
and the number of FAKE unable to work due to disability don't count either
9
posted on
03/09/2013 9:51:11 AM PST
by
Chode
(Stand UP and Be Counted, or line up and be numbered - *DTOM* -ww- NO Pity for the LAZY)
To: Chode
In 2007, more than 146 million Americans were employed. Thru 2012 : only 142 million Americans were employed.
The population has risen since 2007.
http://www.bls.gov/cps/cpsaat01.htm
10
posted on
03/09/2013 12:06:19 PM PST
by
george76
(Ward Churchill : Fake Indian, Fake Scholarship, and Fake Art)
To: Bryan24
11
posted on
03/09/2013 12:16:29 PM PST
by
george76
(Ward Churchill : Fake Indian, Fake Scholarship, and Fake Art)
Civilian noninstitutional population - 16 years of age and over... in 2012 was 243,284,000.
12
posted on
03/09/2013 12:17:41 PM PST
by
george76
(Ward Churchill : Fake Indian, Fake Scholarship, and Fake Art)
To: george76
thx, and i'm glad you like my picture of SlickWillie... 8^)
13
posted on
03/09/2013 12:17:49 PM PST
by
Chode
(Stand UP and Be Counted, or line up and be numbered - *DTOM* -ww- NO Pity for the LAZY)
To: whitedog57
This economist says mostly the same thing. "THIS ECONOMIST"?
You've posted a link to your own drivel on your own dirty blog.
Stop the pretense, nobody is falling for it.
To: Kaslin
15
posted on
03/11/2013 12:38:53 PM PDT
by
massmike
(At least no one is wearing a "Ron Paul - 2016" tee shirt........yet!)
Disclaimer:
Opinions posted on Free Republic are those of the individual
posters and do not necessarily represent the opinion of Free Republic or its
management. All materials posted herein are protected by copyright law and the
exemption for fair use of copyrighted works.
FreeRepublic.com is powered by software copyright 2000-2008 John Robinson