Posted on 05/19/2020 1:56:39 AM PDT by DoughtyOne
PING LIST - Please contact me as needed...
COVID-19 Update # 62
As of 05/18/2020 23:15 PDST United States CDC - Provisional Numbers
As of 00/00/2020 23:45 PDST Johns Hopkins University - Capture Nations Informaton
As of 00/00/2020 23:45 PDST Johns Hopkins University - Capture Counties Information
As of 00/00/2020 23:46 PDST Johns Hopkins University - Process JHU Data
As of 00/00/2020 23:59 PDST WorldofMeters - Document Core Numbers
As of 00/00/2020 23:59 PDST WorldofMeters - Capture Nations Information
As of 00/00/2020 23:59 PDST WorldofMeters - Capture States Information
As of 00/00/2020 00:00 PDST WorldofMeters - Data Processing begins...
As of 00/00/2020 ??:?? PDST Publish COVID-19 Update - 00/00/00
Thank you for stopping by to check out the COVID-19 Update.
Here you can find...
Section: 01 Commentary, Special Reports, COVID-19 Update Info, & System Notes
Section: 02 the United States Situation
Section: 03 the Global Community Situation Outside China
Section: 04 the Global Community Situation Including China with reservations
Section: 05 the Mortality Report
Section: 06 Miscellaneous Reports of Interest
Section: 07 the United States, Counties (alphabetical / case no descending)
Section: 08 the United States, States Ranking, Provisional Numbers, & Territories
Section: 09 the United States, Ranked with Other Nations
Section: 10 the End of this COVID-19 Update
Section: 11 Data Sources and a Link to My Own Spreadsheet
Section: 12 Linked Spreadsheet: Counties, States, Provisional, Territories, & Nations
Section: 13 Links to Other Resources
Section: 01
Commentary, Special Reports, and COVID-19 Update Information2
Interesting Tid-bits (hopefully)
Yesterday's Summary in a Nutshell
It was Monday, another low numbers day, but on the Global Cases count, it
didn't matter.
The New Global Case numbers for Monday Rose. It was a record day for a
Monday at 88,821, they were higher than the 83,385 figure the day before.
The previous record was 79,881 on May first, so this is a sizable increase.
The United States also saw it's number of New Cases rise. From
19,891 the day before, Monday's number came in at 22,630.
As for Fatalities, the Global numbers wound up at 3,425 for the day,
coming in just under the 3,487 figure from the day before.
Our Fatalities came in at 1,003. That's a great number, but it is none
the less a Monday number. This is still more of a reporting related number
than an actual new direction.
The previous Monday came in at 1,008.
Another Feature / Testing and New Case Declarations
I've been asked to address and compare Testing with New Case declarations. At
the bottom of the USA Section:02, you'll see a new set of data and a Chart. New
Case percentages to the numbers of Tests administered is what I think folks would like to see compared. It's there with the Data and Chart.

Section: 02
The Following Addresses the Numbers Here in
the United Staetes of America
Here we go...
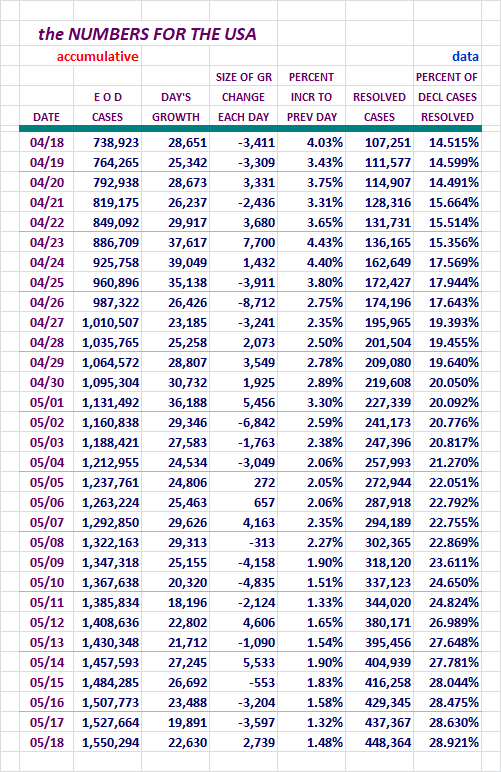
You can see the increased Case Count today. Still in a low range, but it is
Monday.
Concept of adding in Active Cases and Serious Critical here, courtesy of amorphous
Here are more of our numbers...
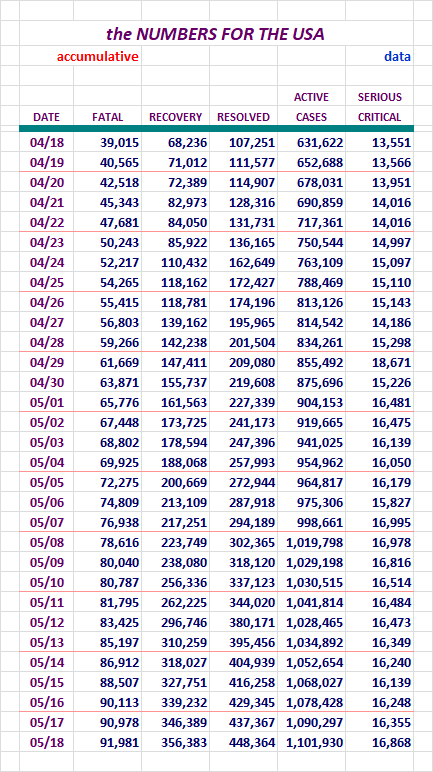
Fatalities were up a bit. We'll look into the exact numbers down below.
Our Slice of the COVID-19 Pie
The growth of our slice of the pie has been dropping recently.
Here are the numbers I've been tracking, Globally Declared and Active Cases.
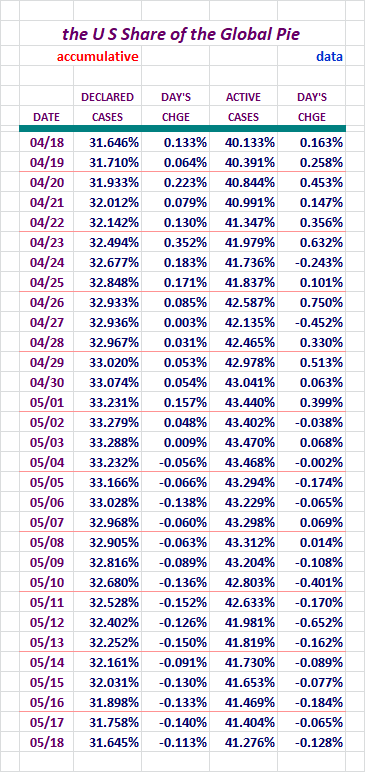
Our slice of the global pie has been getting smaller. I'd like to see it
pick up speed, but we are not there yet.
Active Cases in the United States / Chart
Unlike some of the other charts here, we should see a good rise and
fall at some point with this one.
Note that this presents the one day and then 7 and 14 day averaging versions.
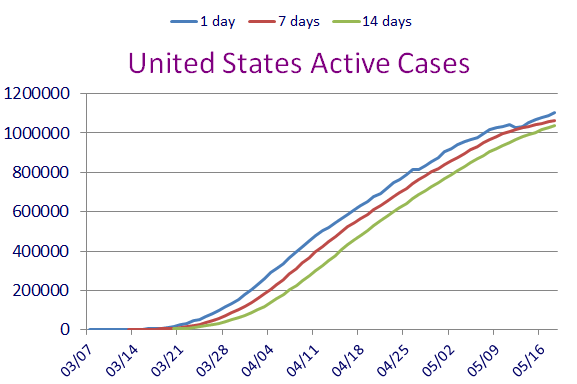
Remember, these are not new Declared Cases. These are remaing Active Cases.
All three indicators here point to a flattening out of remaining Active Cases.
The lower numbers of new Cases coupled with the rate of reported recoveries
are causing the Active Cases to grow noticably slower.
Testing and New Case Figures
Some folks have shown an interest in seeing the COVID-19 Test figures compared
to the New Cases being declared. This following Data addresses that.
I went back as far as I could in my records. I plan on keeping a running
30 day display here, with the Chart starting on 04/21 & 04/23 ongoing.
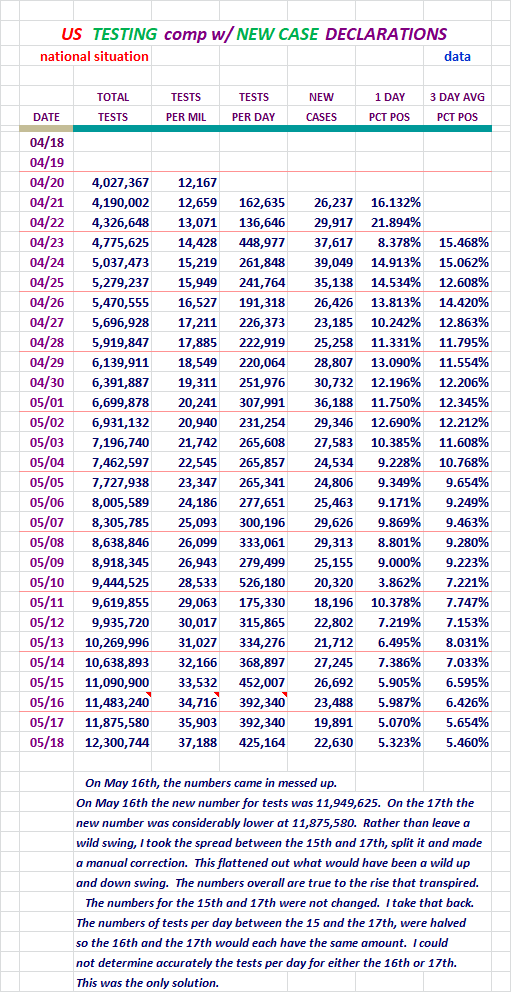
You can see how the Declared Cases to Testing percentage has gone down over
time.
Here is a chart to reveal visually what the decline has looked like.
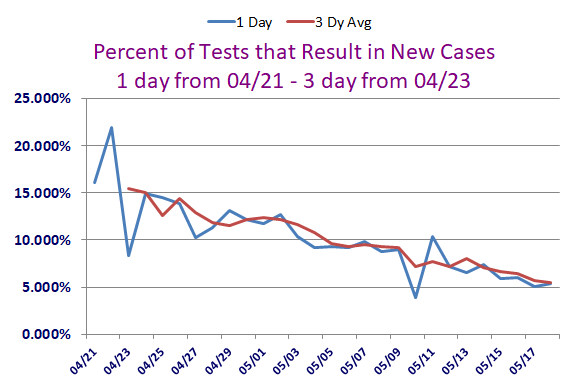
Folks can determine for themselves just how New Cases are affected by the
Testing.
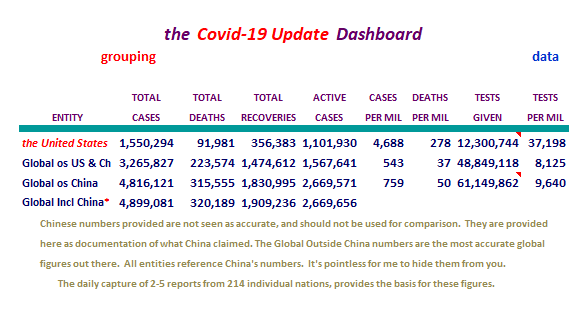
Section: 03
The Following Addresses the Global Numbers
without Mainland China
Here is the first set of Data for the Global Outside China
Territories
The oc Global declaration of New Cases grew over 5,437 cases Monday over
the day before. This was another new Record say for the day of the week.
Seems like a number of record days on the Global scene Outside China lately.
Fatalities, Recoveries, Resolved, Active Cases, and
Serious/Critical Cases - Globally, Excluding M/L China
Concept of adding in Active Cases and
Serious/Critical here, courtesy of amorphous
Here we go...
Again, I don't believe there is anything unusual here today.
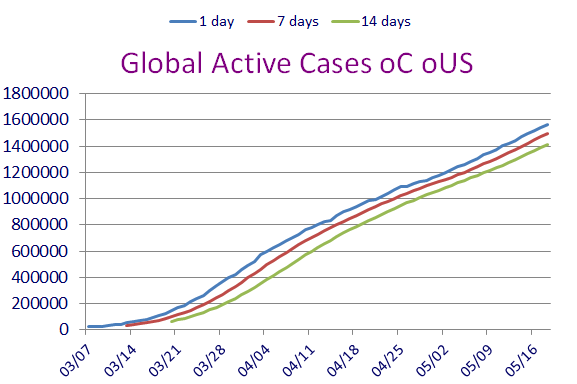
How is the Global Community Outside China Doing,
Without U. S. numbers?
Well, a little better yesterday...
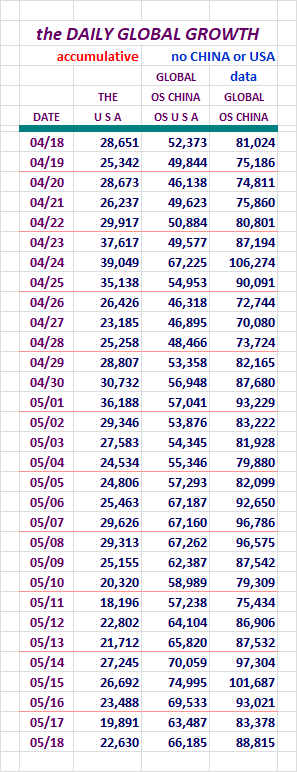
Globally out side China and the U. S., the numbers went up again.
The group of nations I show that have at least 1,000 cases, some of them
are experiencing a lot of new cases. Sadly, we have over 100 of those
nations now. Some of them are ones we've seen explode already, so they
are not the problem at this point. It's the emerging infection zones that
are.
Well, it's that time of the week again. Numbers are down in the valley,
even if they were a record for the day of the week.
Monday's numbers were not exactly what I'd call valley numbers though.
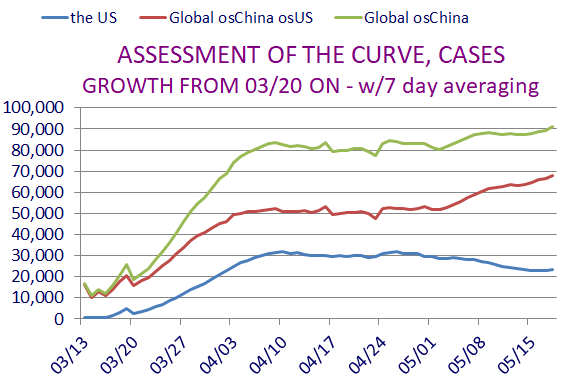
Today wasn't a terribe day, but the global scene has been trending up, and
the seven day averaging continues to reflect that. This was a record Monday
and that's not good to see for any day of the week.
I don't like the looks of that little turn on the blue line there.
The Active Cases outside China Globally / Chart
As in the U. S. version of this, we should see a good rise and fall at
some point these two.
Note that these present the one day and then 7 and 14 day averaging versions.
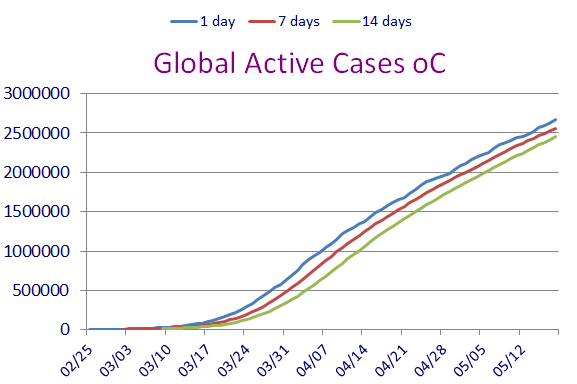
Remember, these are not new declared Cases. These are remaing active cases.
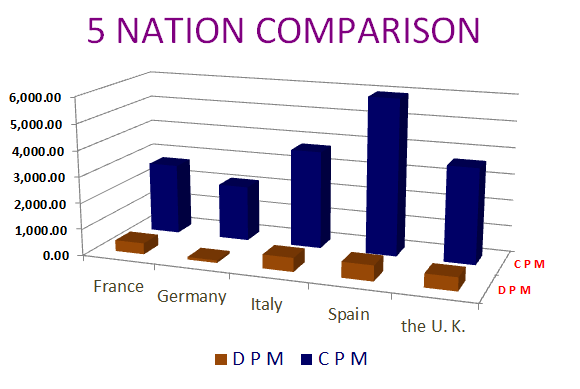
Special Section on France, Germany, Italy, Spain, and the U. K.
Case growth.
Let's Look at Some Numbers in Five Day Increments:
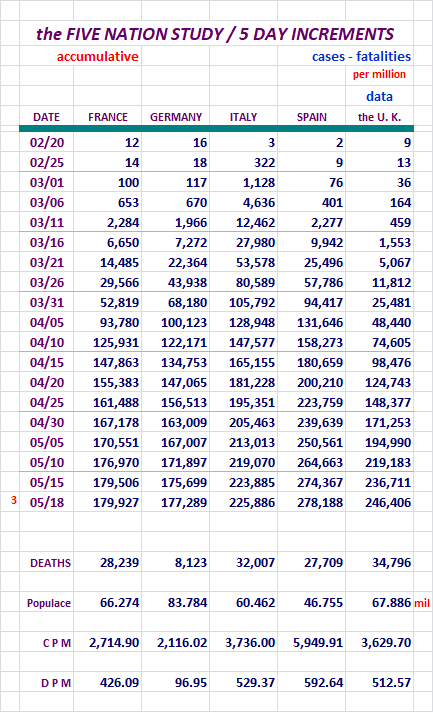
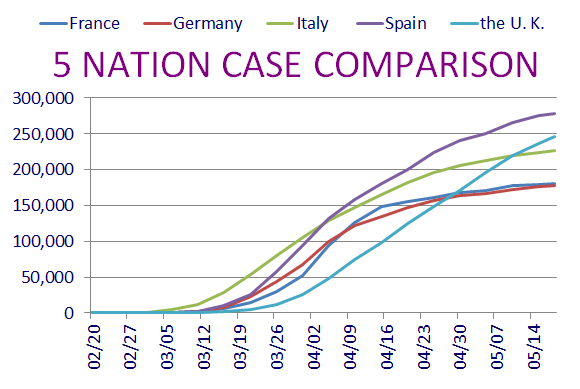
The same comments fit for about each day here.
The chart of Cases, causes the perception that it is in conflict with the
second chart below it. Actually it isn't. It is depicting raw numbers
of New Cases. Down below the chart addresses per million numbers.
They appear to skew, but everything is accurate here.
Sweden and It's Neighbors, Who Has the Best Tactic Against COVID-19?
Sweden is doing its own thing with regard to isolating. I think most people
are aware of it by now.
Here are some numbers to help us look at this issue.
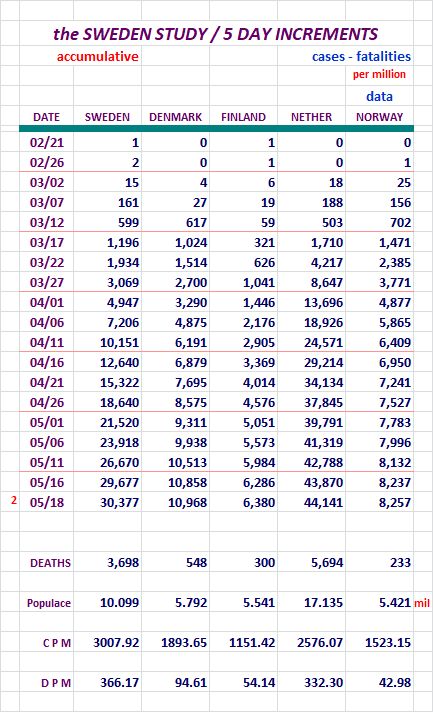
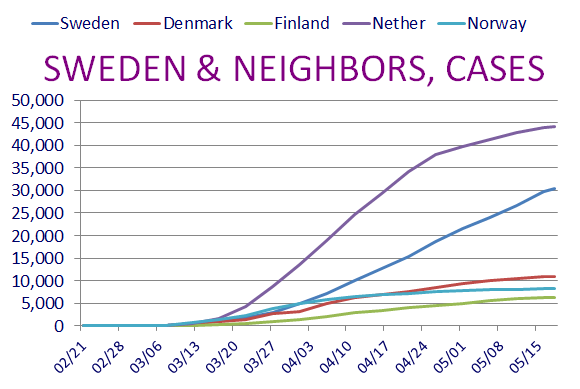
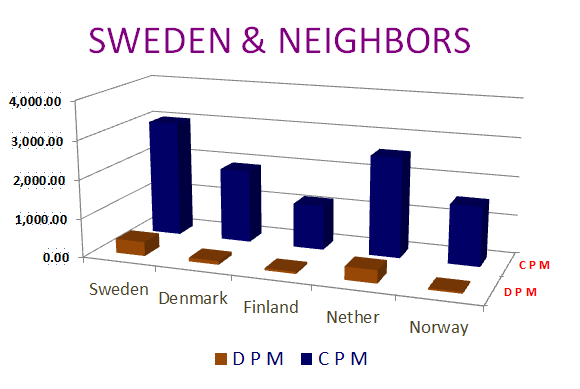
Sweden still remains a hot topic.
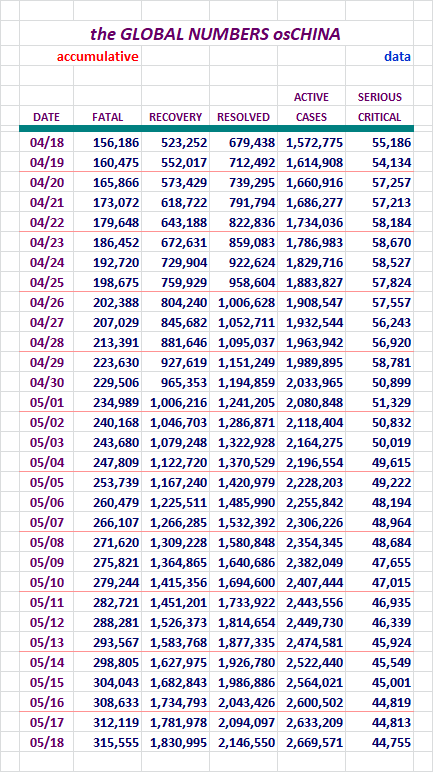
Section: 04
The Following Addresses the Global Numbers
including Mainland China*
Mainland China's numbers are 0.003% of today's total global numbers.
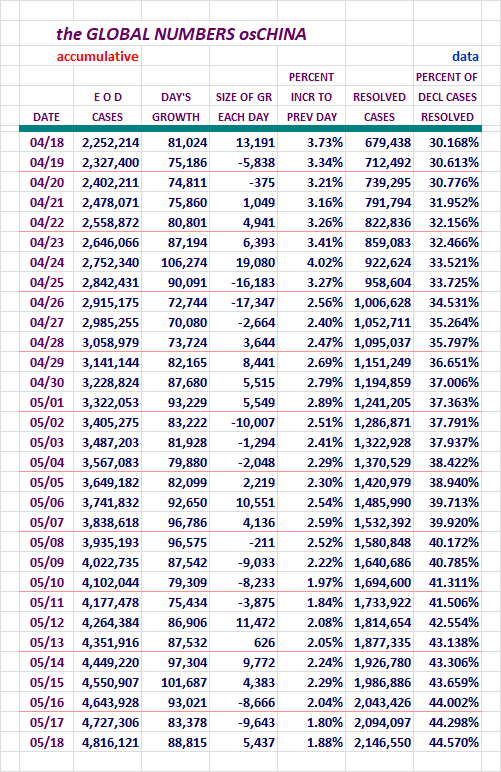
A Look at Declared, Resolved, and Active Cases, Includes M/L China
End of day figures follow:
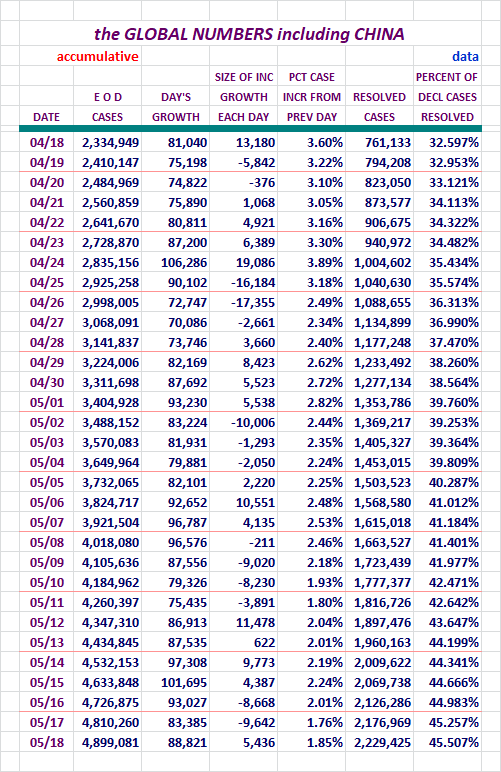
The New Cases number was a new record for a Monday. On the right that
Declared Cases resolution percentage continues to grow.
We should be at 50% by the 28th to the 30th of May.
Fatalities, Recoveries, Resolved, Active, and Serious/Critical
Cases Globally, Including M/L China
Concept of adding in Active Cases and
Serious/Critical here, courtesy of amorphous
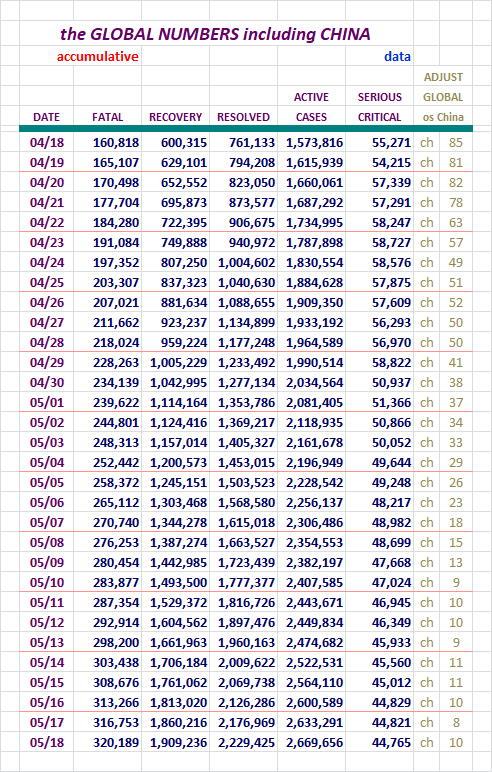
Not much to say here. Big numbers getting bigger...!
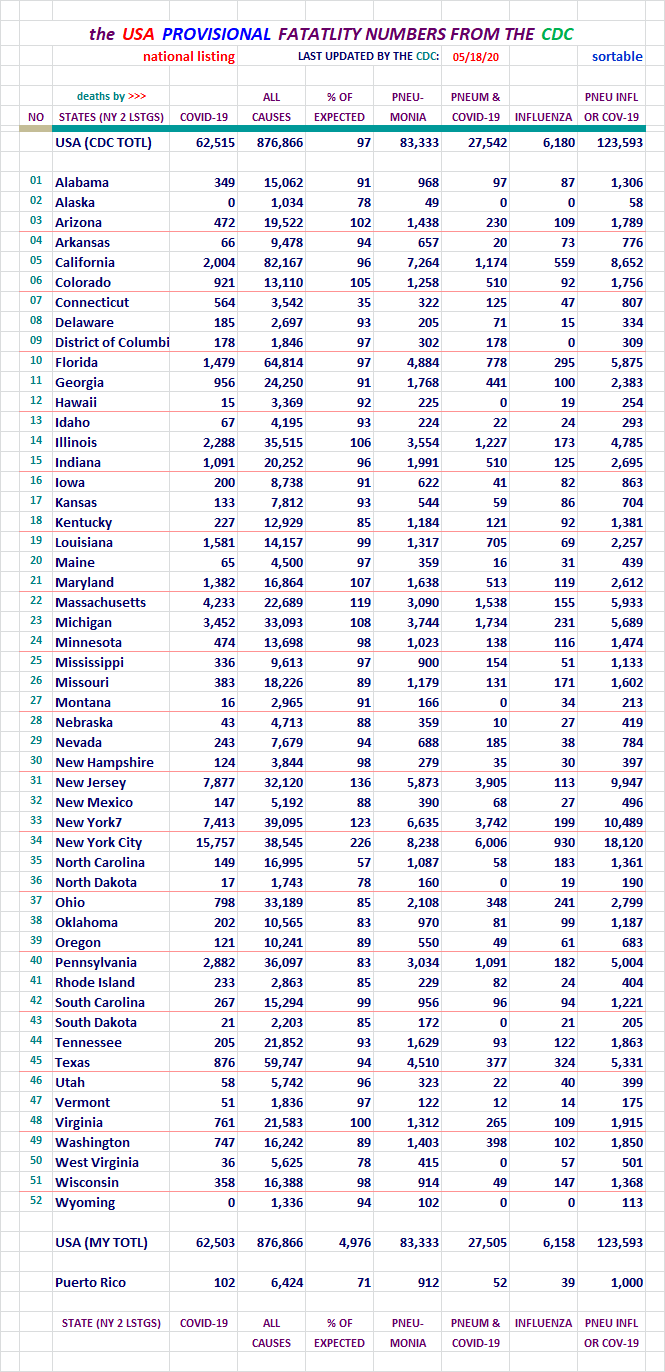
Section: 05
the Mortality Report
Making an effort to provide more mortality numbers these days.
Hopefully these upcoming numbers and charts will help with that.
Our numbers are big enough that they can hide the finer nuances of the
Global numbers outside China. For that reason, I strip our numbers off
that group and report them separately for this area of study.
Here are the figures for the growing case totals for four entities.
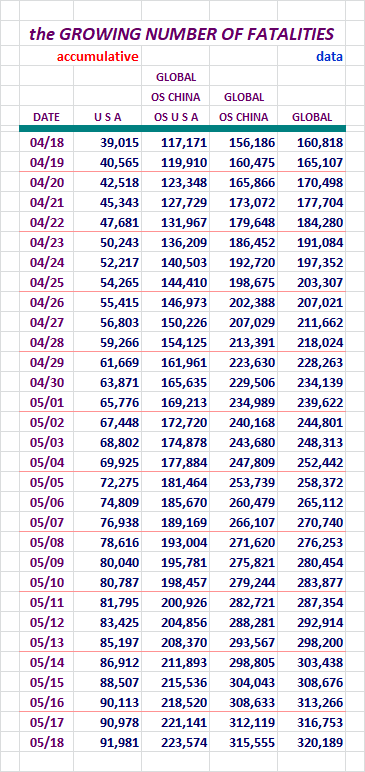
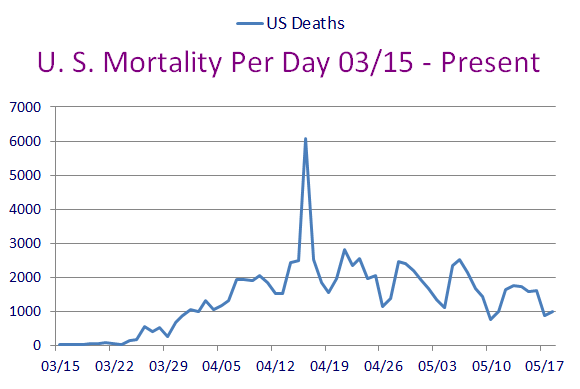
Our number of fatalities continues to go up, but at a slower pace.
I urge folks to review the CDC's Provisional numbers bellow. I am not
touting this count (91,981), but it's out there so I mention it.
Here is the chart to go along with those figures.
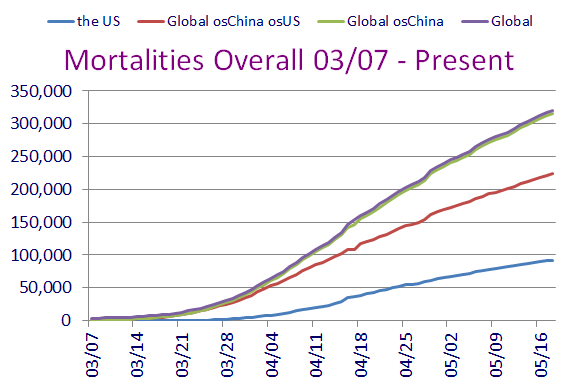
Looks pretty ominous there doesn't it.
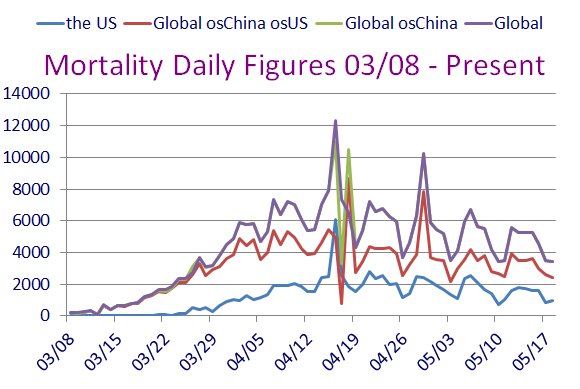
Here are figures revealing the daily growth for those four entities.
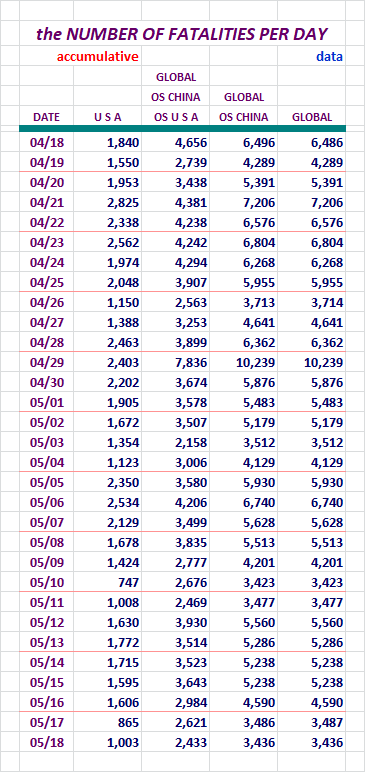
Our numbers of new Fatalities went up today. They remain in a low range.
It was Monday...
Here are two charts to go with the above data.
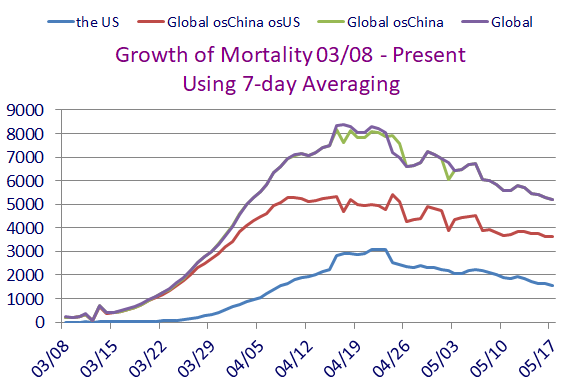
These three four seven-day lines, reveal them all drifting lower over time.
We do seem to be doing the best though.
Here, let's look at data for the U. S. broken out by itself.
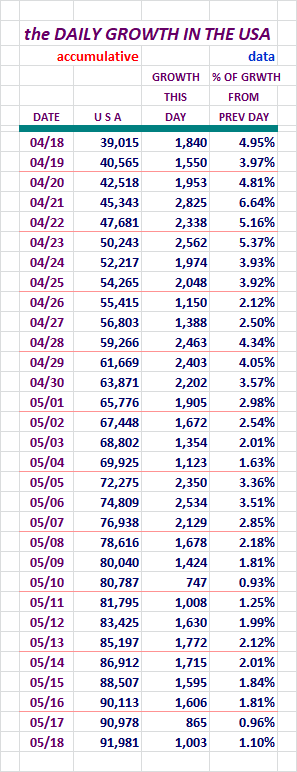
We're in a lower range now, but look back to last Monday, very close. Over
the next few days we'll climb back up. The question is, how high?.
We're still pretty low, but again, for how long?
Section: 06
Population Saturation
Here are figures revealing how many people in each population base represent one case.
I'm also showing what percent of each population base is infected at this time.
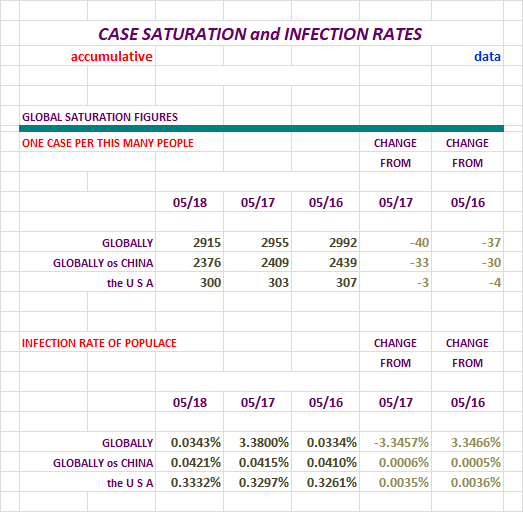
Not liking the trend here for us. I want to see our infection percentage drop.
Nations With Lots of Cases
At the end of the day yesterday, there were:
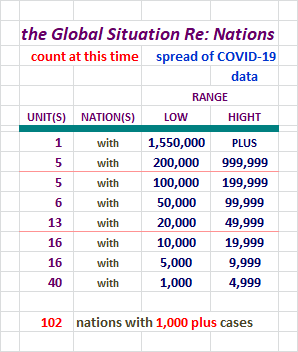
That's a whole lot of nations there. With over 1,000 in each one, we know
that over time they are potential declared cases time-bombs.
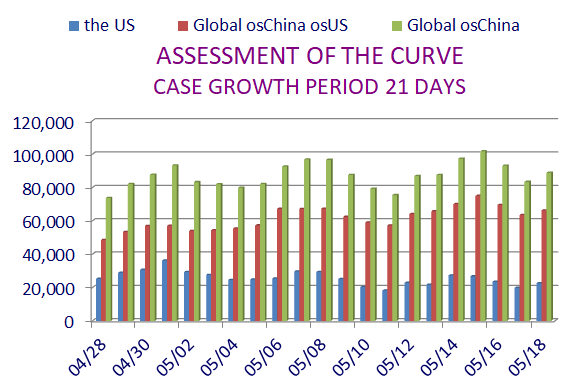
Daily Case Report Evaluation
I'll be keeping tabs on the daily tallies for days of the week for a while. Folks have
noticed some patterns of larger and smaller data entry on certain days, and on Fridays
sometimes the numbers get noticeably larger because of it.
And we now know Thursdays have potential to break out also. Yikes!
Let's check out the numbers and a chart.

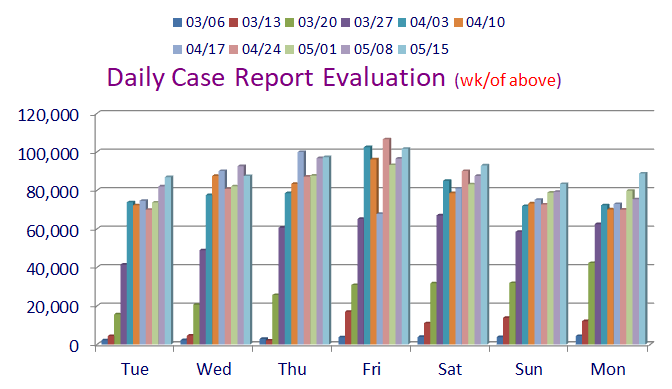
Today's new Cases set a new record for the day. Hope that's not a bad omen
for the week to come.
I increased the size of this chart so you could see the individual columns
better.
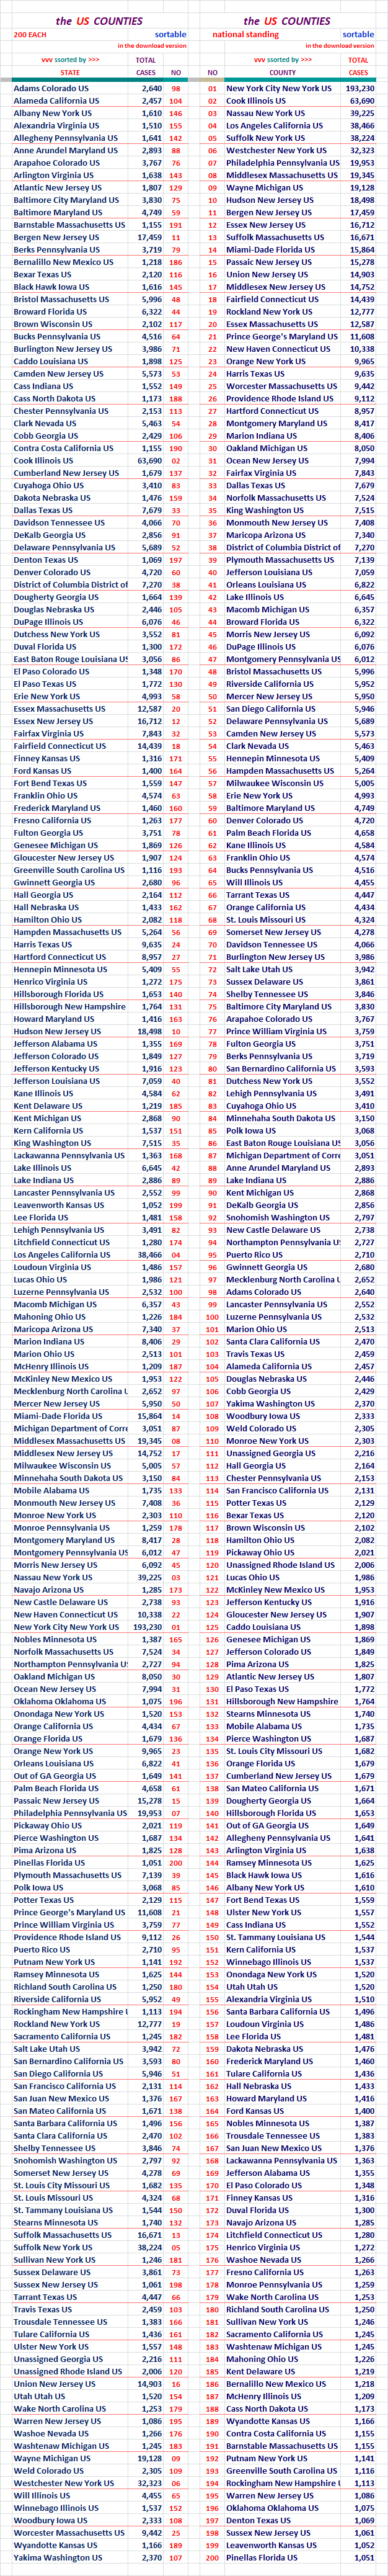
Section: 07
The Top 200 Counties in the U. S., by Number of Cases
This little report lists 200 Counties in the United States in declining Case numbers.
There is also a listing that is alphabetical. This report list only the entities
and the number of Cases in the two different sorts.
It will also be available as a downloadable Excel file in Section 12.
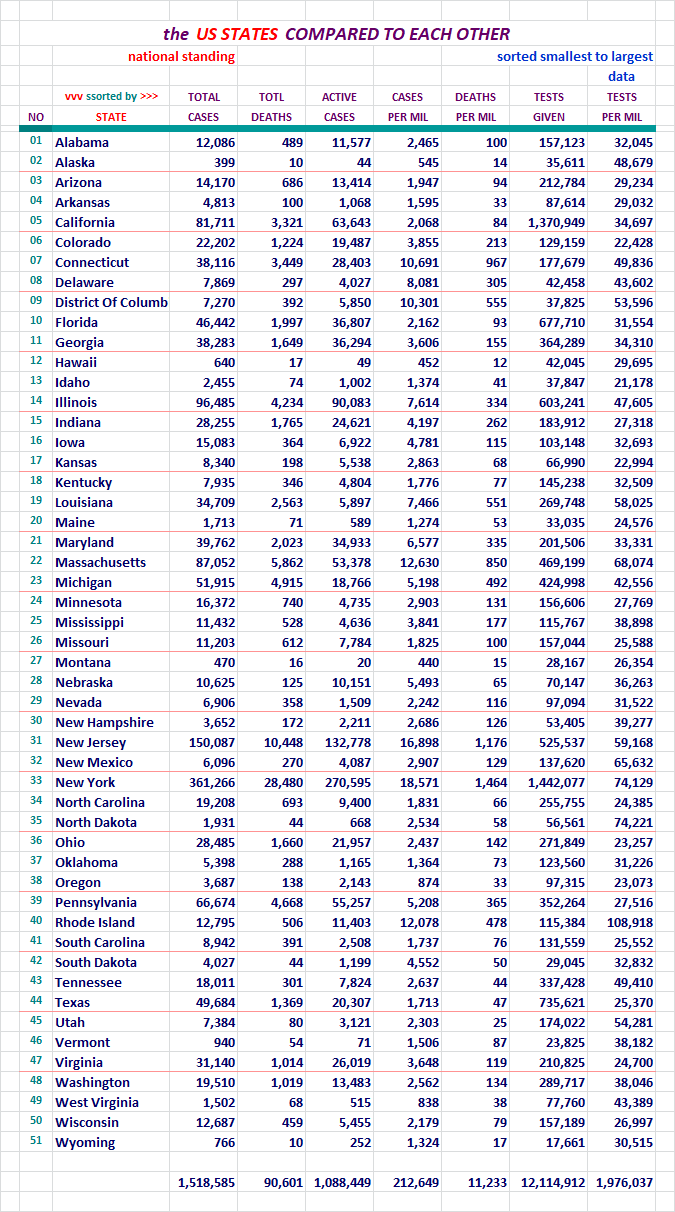
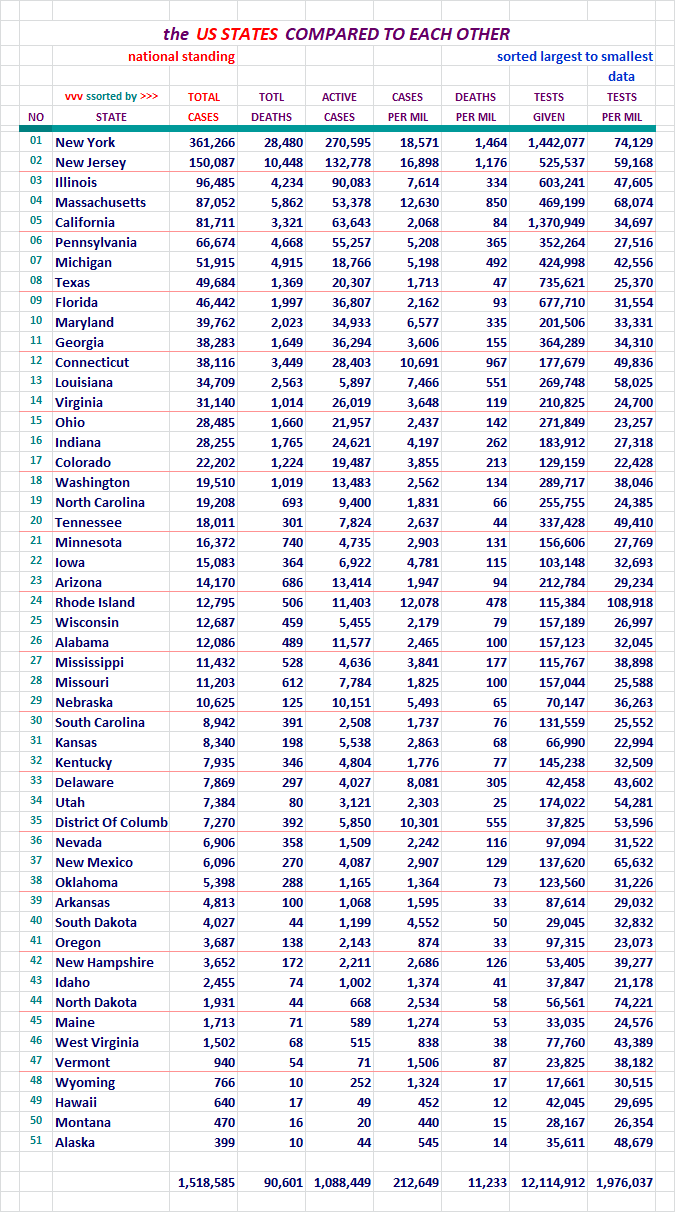
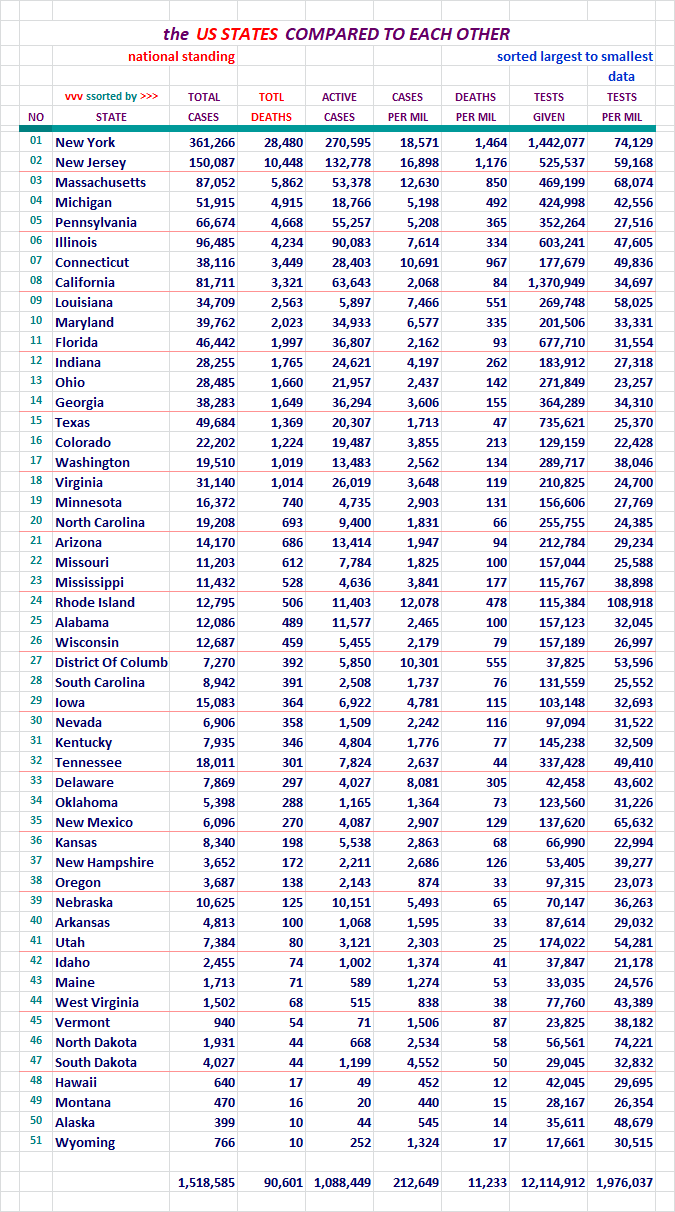
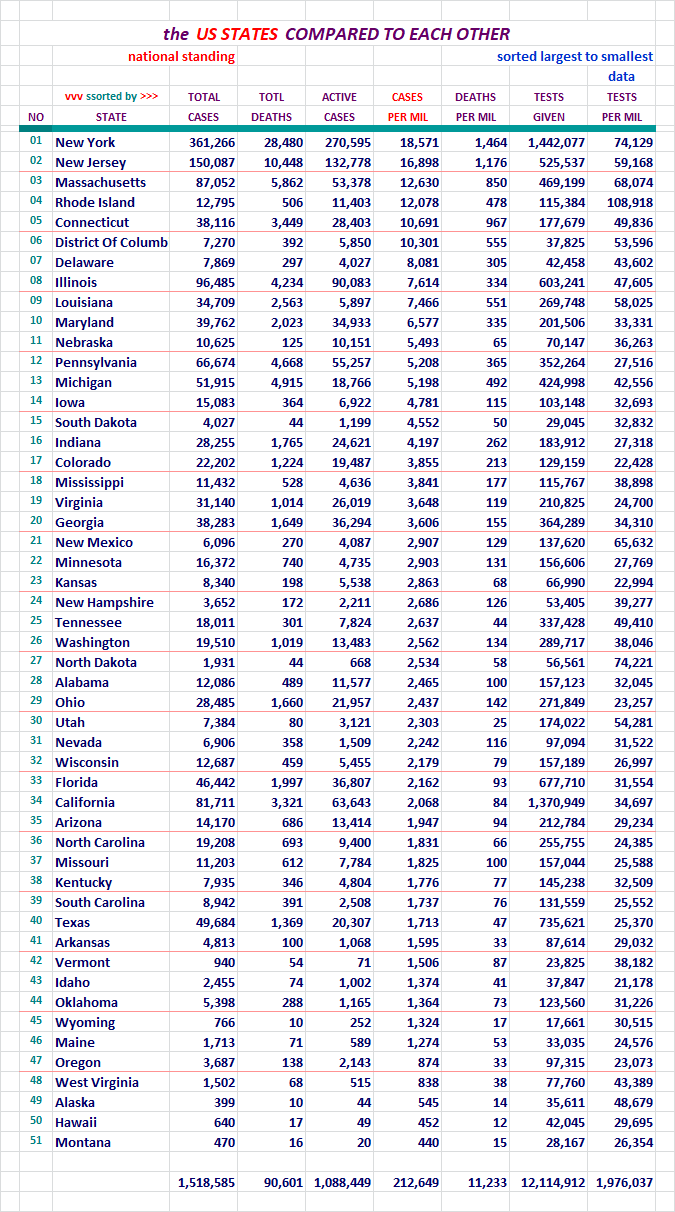
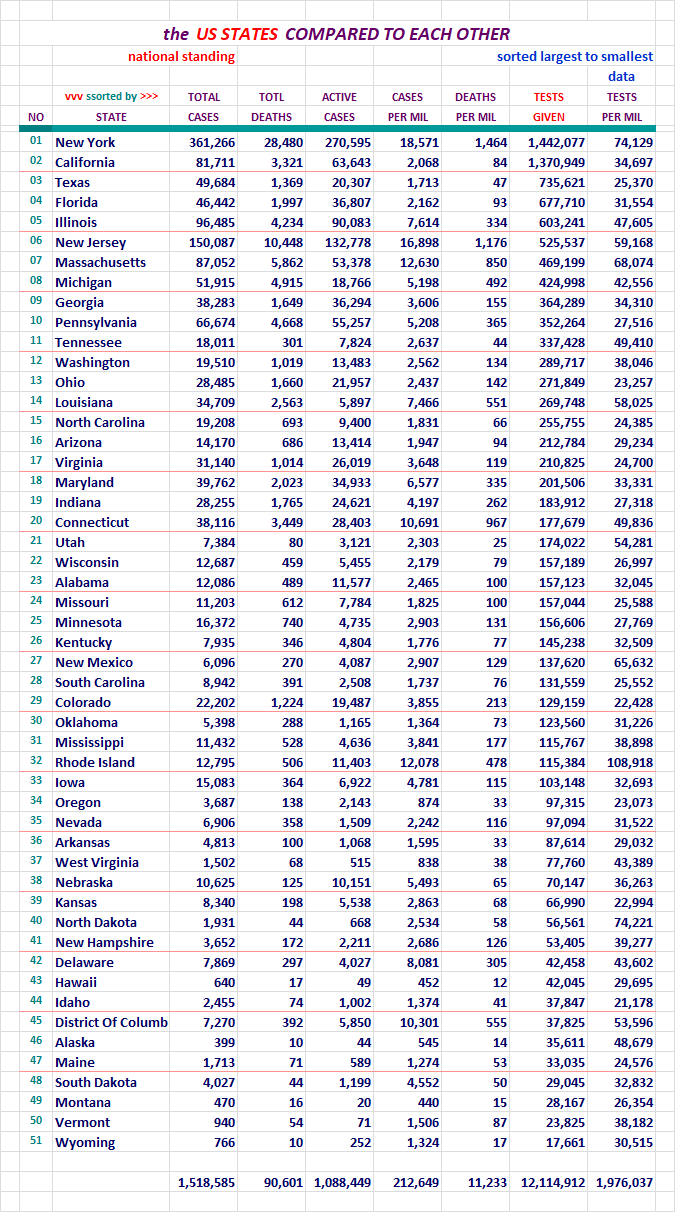
Section: 08
States of the Union and the District of Columbia, Compared to Each Other
Each of these pages is sorted differently. Look at the red header above
the columns to see which column was used for the sort on any given page.
For your review...
For your review...
For your review...

For your review...
For your review...

For your review...
For your review...

For your review...
For your review...
If this area interests you, please use this LINK to the source, and review
the lengthy description and explanation of it's development process.
There are two reports. The presentation above comes from the second one,
and the detailed segmented information below it, may interest you.
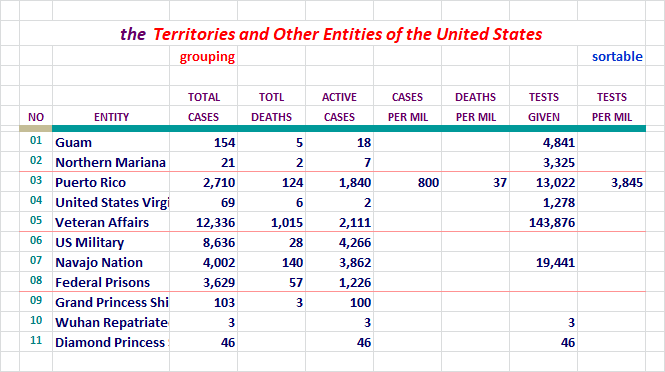
Some interesting figures there for various segments.
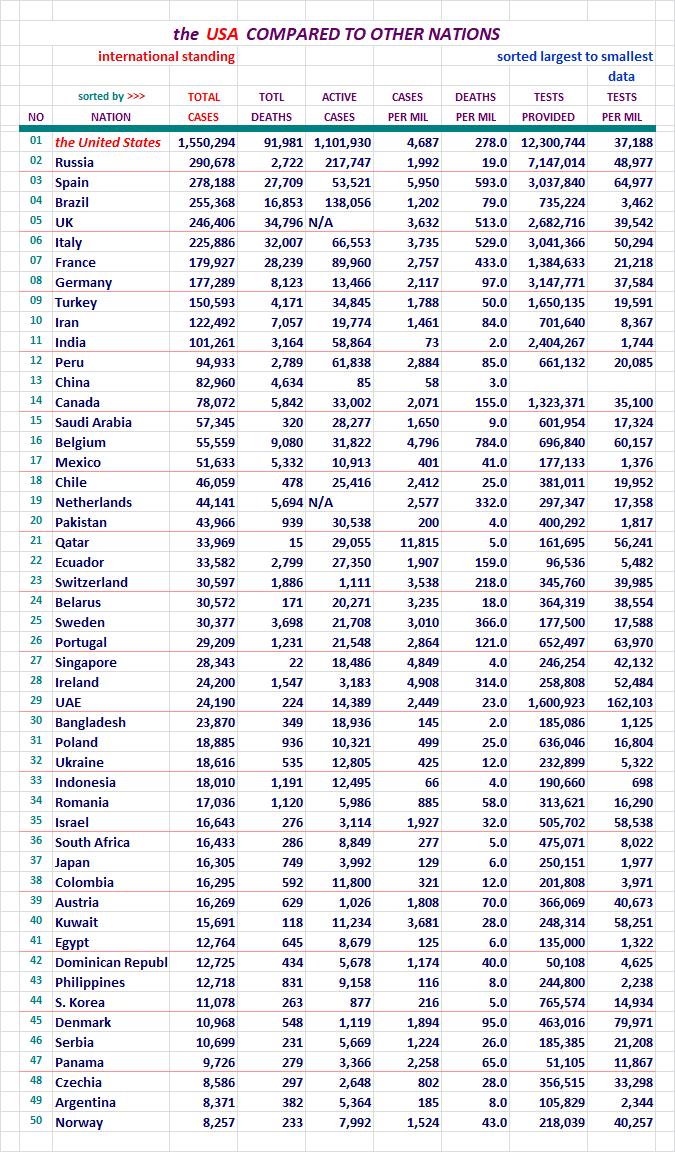
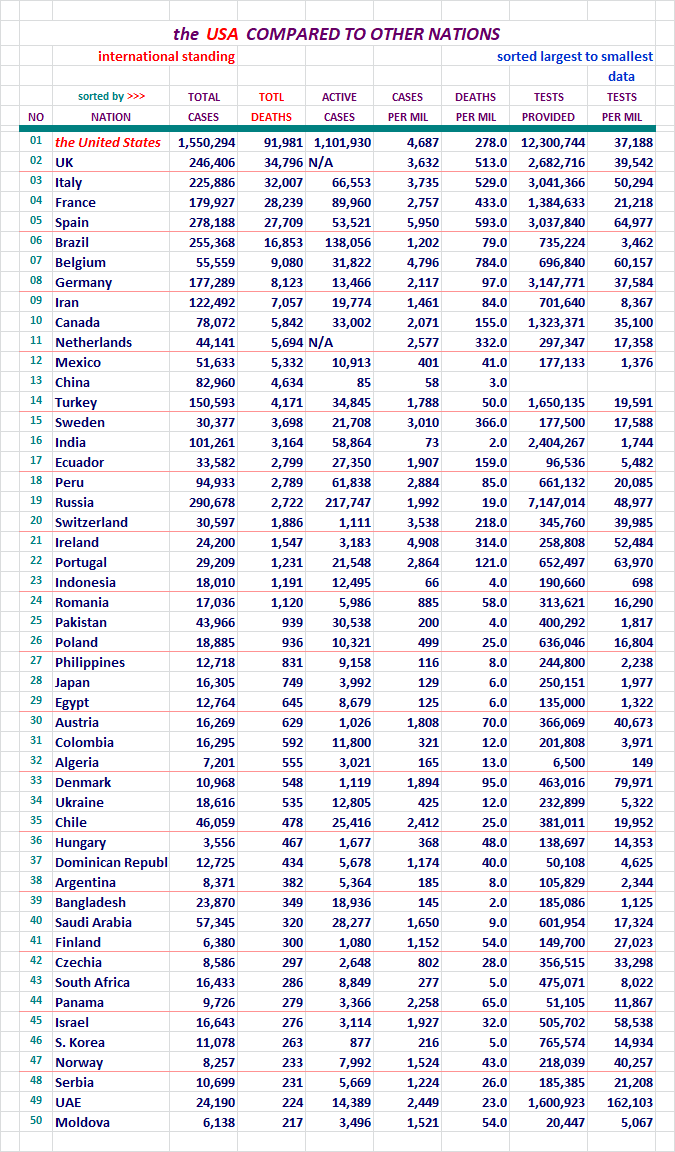
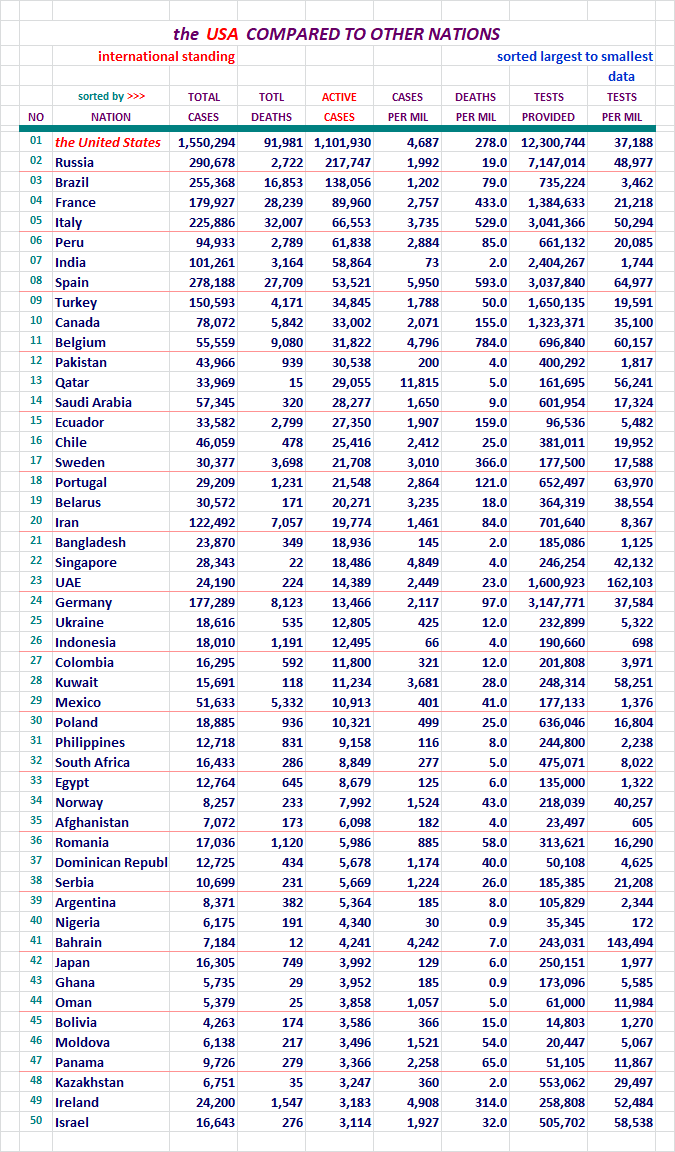
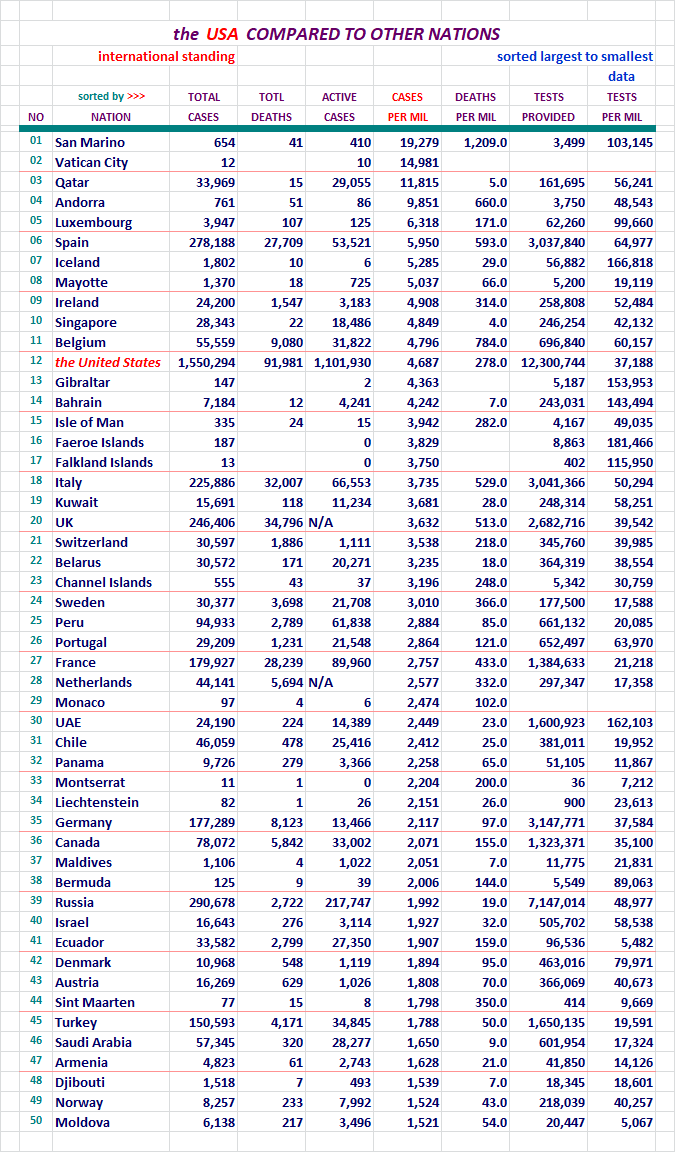
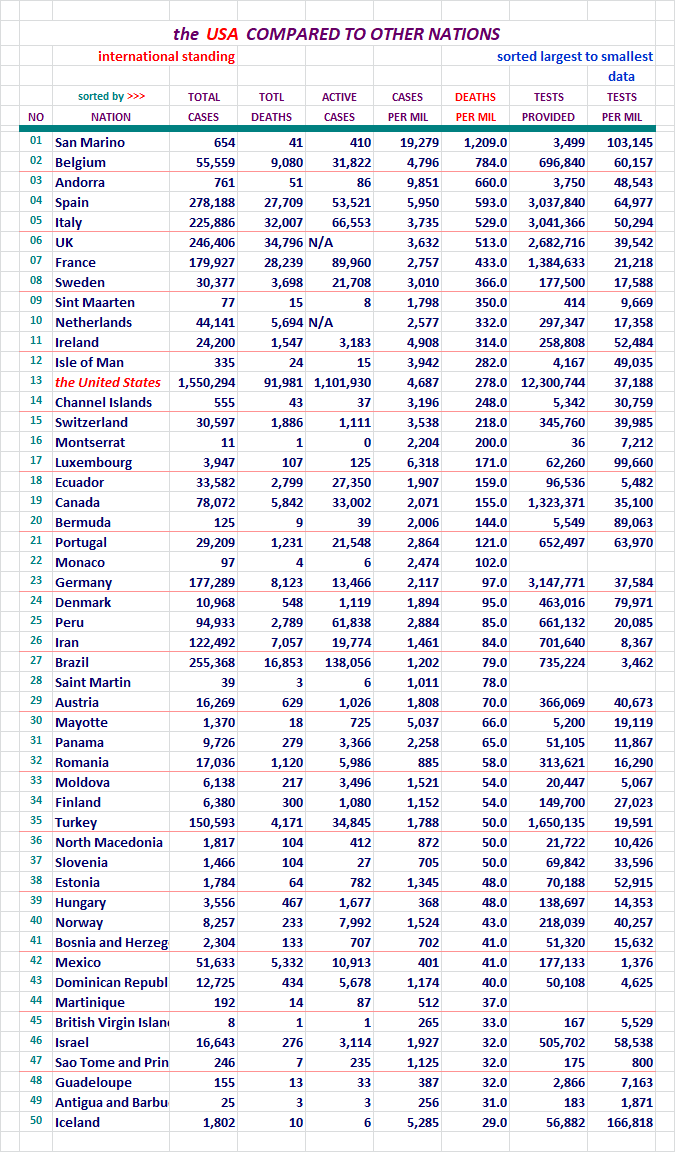
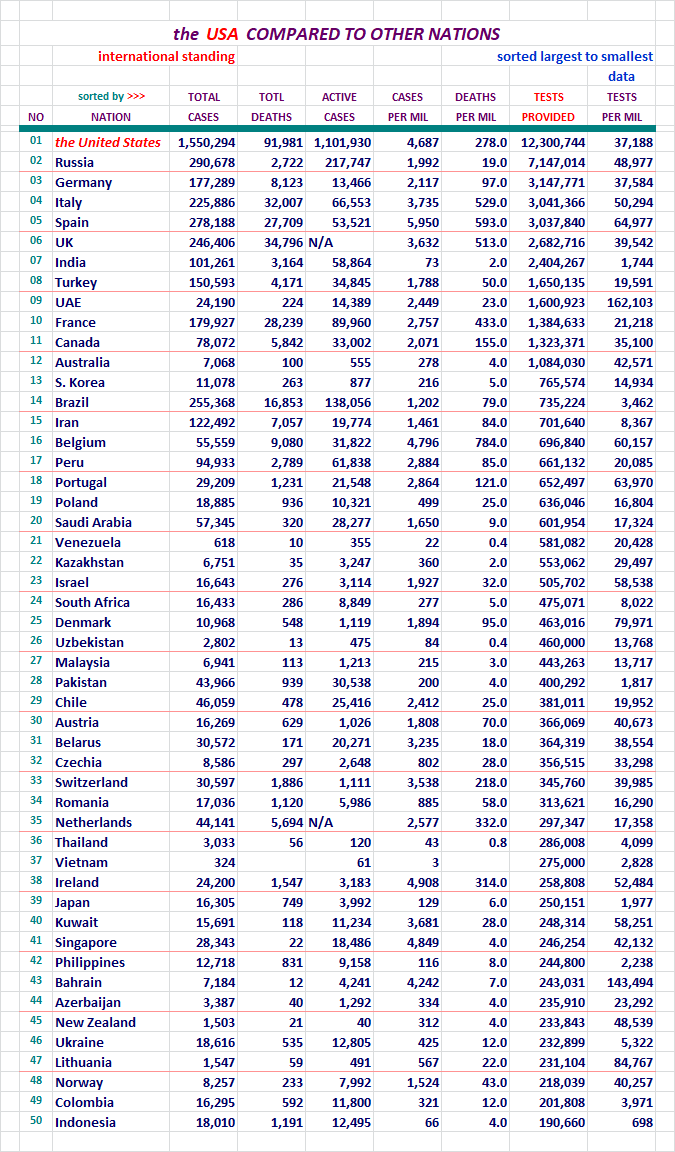
Section: 09
The United States, Where it Ranks With Other Nations?
Each of these pages is sorted differently. Look at the red header above
the columns to see which column was used for the sort on any given page.
The U. S. will be highlighted red here so we can find it easily in the list.
There was 215 nations on this list last night now. I didn't want to post
seven lists with 215 nations on it, so I picked the top 50. Coincidentally,
one report category had the U. S. at 41st, so it wasn't showing up on the
list with the 31 top nations on it. That wasn't the reason why I extended the
list length, but it did work out well.
I work on the nations right next to the states on my spreadsheet. The
states with the District of Columbia come in at a total of 51 lines.
I decided to keep the international reports near that length, and 50
was good enough.
Here we go... for your review.
For your review...
For your review...
For your review...
For your review...
For your review...
For your review...
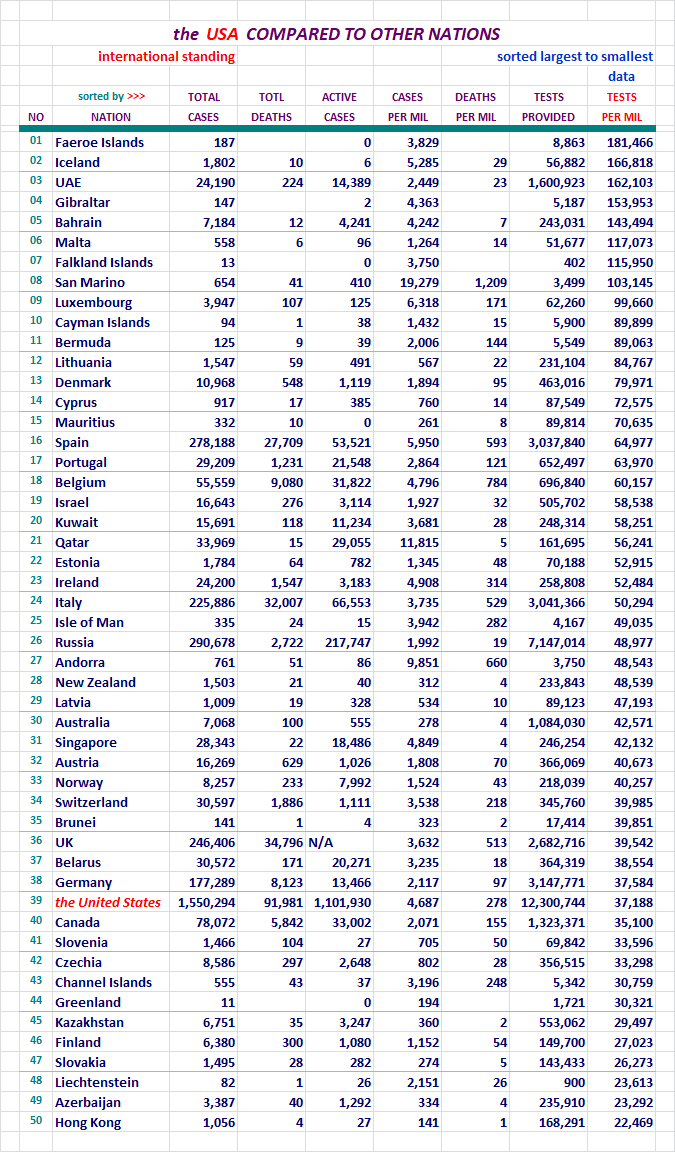
Thirty-nine? Where did I go wrong?
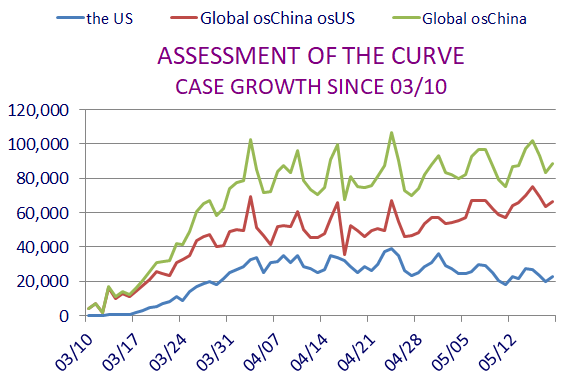
Section: 10
Here is what it is all about. From January 20th to the present.
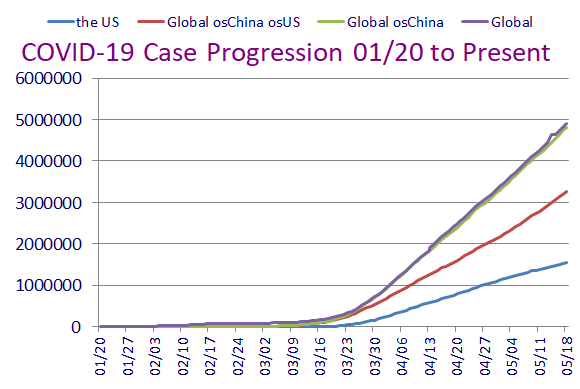
This concludes our look back at yesterday's data. Take care...

Section: 11
Data for this Report Sourced From:
LINK WorldoMeters
LINK Johns Hopkins University
The Center for Systems Science and Engineering (CSSE)
LINK United States Center for Disease Control - Provisional Numbers
Listed in the order of current utilization...
LINK You are Invited to Review My COVID-19 Spreadsheet (XLSX)
There is not an XLS version available for distribution at this time.
Section: 12
Other Features:
LINK US Counties200, States & DC51, Territories & Other Entities11, Nations214,
and the CDC Provisional Counts53
Five Excel Spreadsheet datasets you can sort for your own studies...
Section: 13
Links to other resources:
I cannot vouch for these sites. Please use your own judgement.
LINK Adventist Health Coronavirus Resource Hub - Scroll down for useful info
LINK Antibiotic Vitamin, the (Vitamin D)
Good article on Vitamin D's likely role in prevention of infection. Thanks Blam.
LINK CDC Data for Download - Scroll down - Excel required. Includes death stats.
LINK CDC National Center for Health Services
Provisional deaths as determined by review of vital documents. Much lower...
LINK CDC Secondary Data and Statistics - Portal Entry / Look around
LINK Coronavirus (COVID-19) Map
LINK Coronavirus infection risk may be reduced by Vitamin D
by Former CDC Chief Dr. Tom Frieden
LINK Coronavirus Spread Quickly Around the World in Late 2019, Study Shows
the University College London Genetics Institute
LINK COVID-19 Deaths Broken Out by Thirds, 05/07/20 Map of US Counties
Very revealing display of Concentrated Death Zones - thanks hoosiermama
LINK COVID-19 First U.S. Case, Treatment, features Remdesivir
New England Journal of Medicine article
LINK Cytokine Storm, med Actemra, Physician near death saved
LINK Diamond Princess Review at 634 Case Point of Eventual 712
LINK Hydroxychloroquine Article: International Poll
Daily Mail Reports, Most Effective Treatment According to 6,000 Physicians
LINK Hydroxychloroquine Has about 90 Percent Chance of Helping COVID-19 Patients
the Association of American Physicians and Surgeons, reports 91.6% of patients improved clinically
LINK IHME - Institute for Health Matrix and Evaluation
LINK National Institutes of Health - Cornavirus (COVID-19)
LINK Nasal Irrigation is the Key, COVID-19 Related
LINK New York City - interesting breakdown, borough, age, sex
LINK On the Origin of CCP Virus, A Documentary Movie (turn up the sound)
Epoch Times: I highly recommend this very well documented report.
LINK Rt COVID-19
Calculates and displays the Rt Factor for each state. Thanks FreedomPoster.
LINK World Health Organization

Great new section on test positivity!
Please add me to the ping list. Thank you for this daily update.
I ditto Reaganez; the testing strategy is key to the control and elimination of Covid-19.
As long as the number tested exceeds the number of positive tests, the chance of missing cases is small.
Thank you once again for your diligent efforts to provide this information.
Worldometer appears to not have any good data on Russia. I have noticed for the past week that worldometer is reporting about 10,000 new cases each day in Russia.
LINK You are Invited to Review My COVID-19 Spreadsheet (XLSX)
The link does not seem to be working.
Wow, you have added a lot more data since I’ve been here. I like the addition of the Netherlands and Norway in the Sweden etc comparisons. And thanks for the in-depth data on the states.
We are considering a move, possibly to another state besides Tennessee. This pandemic is helping me cross off certain states that we wouldn’t want to be stuck in. These Democratic Governors are all too quick to become tyrannical despots.
We have learned a lot and we are headed out of the tunnel.
"Just a reminder: The flu HAS a vaccine and still kills 45k to 65k each year."
Try it again now.
I uploaded it again. Seems to be working okay.
I didn’t try it before. I just uploaded it again and then
tried it.
This is the same link as above.
http://www.hotr.us/drop/coronavirusjhufile.xlsx
Disclaimer: Opinions posted on Free Republic are those of the individual posters and do not necessarily represent the opinion of Free Republic or its management. All materials posted herein are protected by copyright law and the exemption for fair use of copyrighted works.