Posted on 05/20/2020 2:09:12 AM PDT by DoughtyOne
PING LIST - Please contact me as needed...
COVID-19 Update # 63
As of 05/19/2020 23:15 PDST United States CDC - Provisional Numbers
As of 00/00/2020 23:45 PDST Johns Hopkins University - Capture Nations Informaton
As of 00/00/2020 23:45 PDST Johns Hopkins University - Capture Counties Information
As of 00/00/2020 23:46 PDST Johns Hopkins University - Process JHU Data
As of 00/00/2020 23:59 PDST WorldofMeters - Document Core Numbers
As of 00/00/2020 23:59 PDST WorldofMeters - Capture Nations Information
As of 00/00/2020 23:59 PDST WorldofMeters - Capture States Information
As of 00/00/2020 00:00 PDST WorldofMeters - Data Processing begins...
As of 00/00/2020 ??:?? PDST Publish COVID-19 Update - 00/00/00
Thank you for stopping by to check out the COVID-19 Update.
Here you can find...
Section: 01 Commentary, Special Reports, COVID-19 Update Info, & System Notes
Section: 02 the United States Situation
Section: 03 the Global Community Situation Outside China
Section: 04 the Global Community Situation Including China with reservations
Section: 05 the Mortality Report
Section: 06 Miscellaneous Reports of Interest
Section: 07 the United States, Counties (alphabetical / case no descending)
Section: 08 the United States, States Ranking, Provisional Numbers, & Territories
Section: 09 the United States, Ranked with Other Nations
Section: 10 the End of this COVID-19 Update
Section: 11 Data Sources and a Link to My Own Spreadsheet
Section: 12 Linked Spreadsheet: Counties, States, Provisional, Territories, & Nations
Section: 13 Links to Other Resources
Section: 01
Commentary, Special Reports, and COVID-19 Update Information3
Interesting Tid-bits (hopefully)
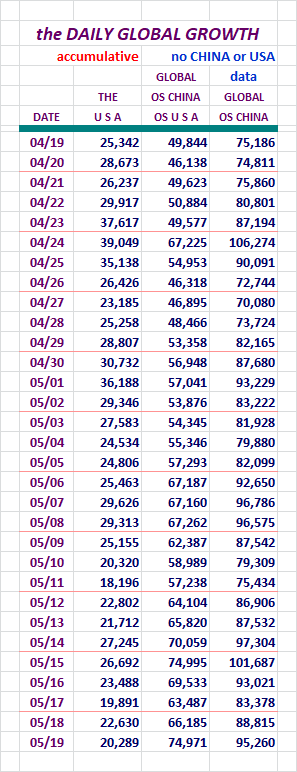
Yesterday's Summary in a Nutshell
It was a record day for a Tuesday on the Global scene. Monday's number was
88,821, and Tuesday the number came in at 95,265.
The previous record was 86,913 on May fifteenth, so this was a sizable increase.
For the United States the numbers for the day dropped. The day before we had
22,630 cases, but Tuesay saw 20,289. Last Tuesday came in at 22,802.
As for Fatalities, the Global numbers wound up at 4,781 for the day, coming
in a considerable amount higher than the 3,436 figure from the day before.
Our Fatalities for Tuesday came in at 1,552. The day before it was 1,003.
Well see how we do heading into the heavy numbers part of the week.
Global Scene Passes Another Milestone
Early this morning, the Global Declared Cases of COVID-19 will pass the five
millionth case mark.
Additional Feature Added / Testing and New Case Declarations
I was asked to address and compare Testing with New Case declarations. At
the bottom of the USA Section: 02, you'll see a new set of Data and a Chart.
The percentage of New Cases compared to the Tests administered is what I think
folks wanted to see. It's there with the Data and Chart.
Section: 02
The Following Addresses the Numbers Here in
the United Staetes of America
Here we go...
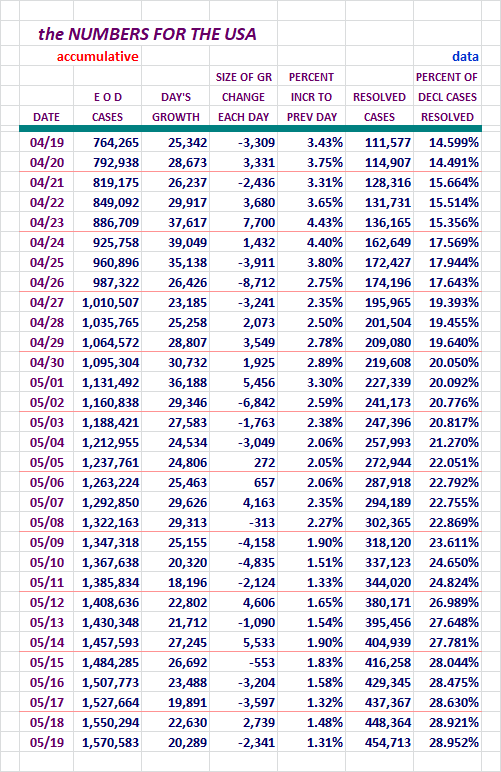
You can see the decreased Case Count today. We're in a low range, but it is
Tuesday. The real weekly test will heat up now as we head toward Friday.
Concept of adding in Active Cases and Serious Critical here, courtesy of amorphous
Here are more of our numbers...
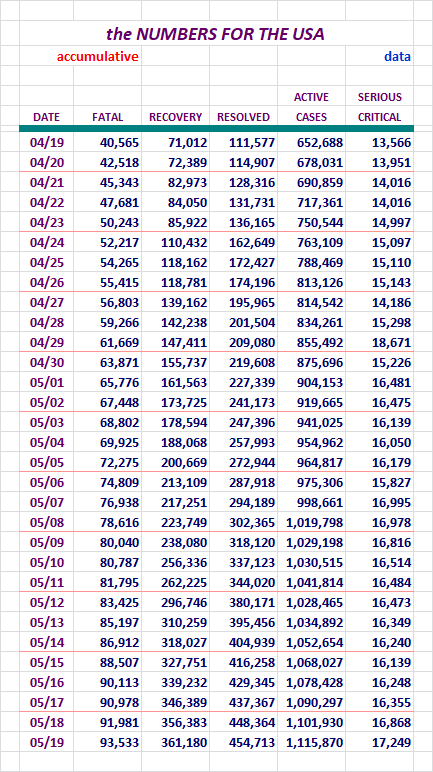
Fatalities went back up as we headed deeper into the week. We'll look into the
exact numbers down below.
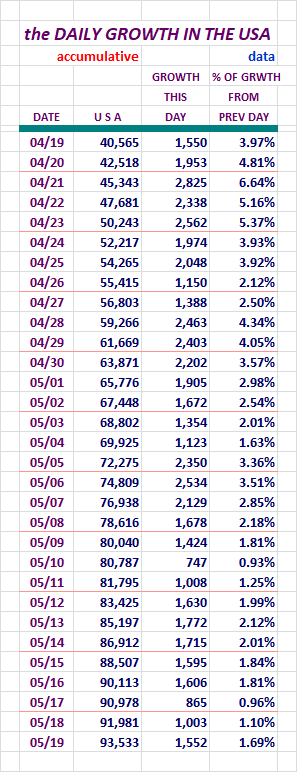
Our Slice of the COVID-19 Pie
The growth of our slice of the pie has been dropping recently.
Here are the numbers I've been tracking, Globally Declared and Active Cases.

Our slice of the global pie has been getting smaller. I'm glad to see this.
All these little indicators support the idea we are moving in the right
direction. These slice of the pie numbers have been dropping for eleven days now. Numbers of Resolved Cases are growing, and the increase in the Active
Case category is slowing down.
Active Cases in the United States / Chart
Unlike some of the other charts here, we should see a good rise and
fall at some point withone.
Note that this presents the one day and then 7 and 14 day averaging versions.
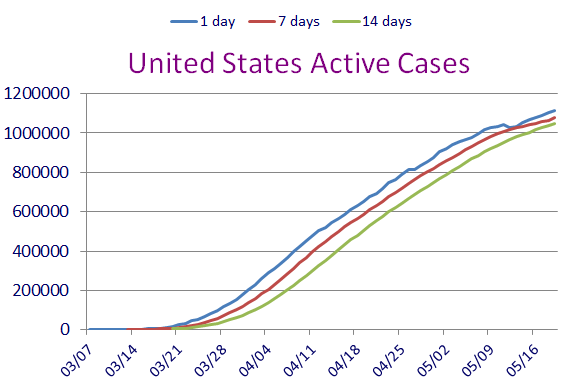
Remember, these are not new Declared Cases. These are remaing Active Cases.
All three indicators here point to a flattening out of remaining Active Cases.
The lower numbers of new Cases coupled with the rate of reported recoveries
are causing the Active Cases to grow noticably slower.
Testing and New Case Figures
Requested by stocksthatgoup
Some folks have shown an interest in seeing the COVID-19 Test figures compared
to the New Cases being declared. This following Data addresses that.
I went back as far as I could in my records. I plan on keeping a running
30 day display here, with the Chart starting on 04/21 & 04/23 ongoing.
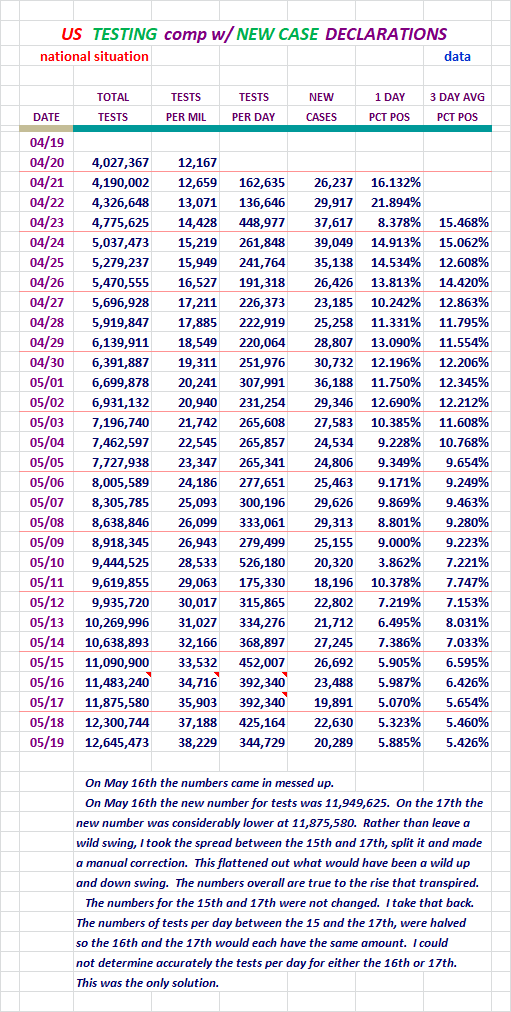
You can see how the Declared Cases to Testing percentage has gone down over
time.
Here is a chart to reveal visually what the decline has looked like.
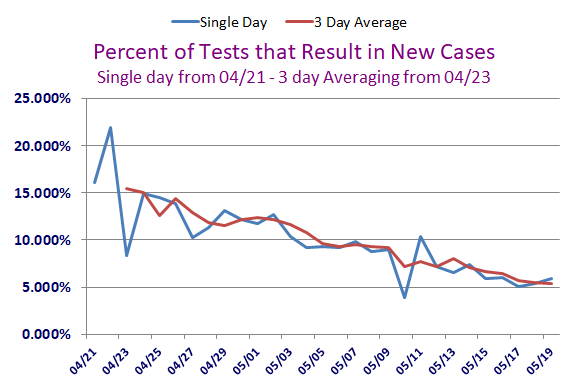
Folks can determine for themselves just how New Cases are affected by the
Testing.
Section: 03
The Following Addresses the Global Numbers
without Mainland China
Here is the first set of Data for the Global Outside China
Territories
The growth of new Global Cases outside China is not going well. Those
nations we've been tracking with over 1,000 cases each, there are over 100
of them now, and some of them are growing exponentially now.
Fatalities, Recoveries, Resolved, Active Cases, and
Serious/Critical Cases - Globally, Excluding M/L China
Concept of adding in Active Cases and
Serious/Critical here, courtesy of amorphous
Here we go...
Again, I don't believe there is anything unusual here today.
How is the Global Community Outside China Doing,
Without U. S. numbers?
Well, a little better yesterday...
Globally out side China and the U. S., the numbers went up again.
The group of nations I show that have at least 1,000 cases, some of them
are experiencing a lot of new cases. Sadly, we have over 100 of those
nations now. Some of them are ones we've seen explode already, so they
are not the problem at this point. It's the emerging infection zones that
are.
Well, we're supposed to be in a valley here, but guess what, there's a lot
less valley than usual. On the Global scene, Saturday, Sunday, Monday, and now
Tuesday, have been record days for the day of the week. I'll touch on this
more down below.
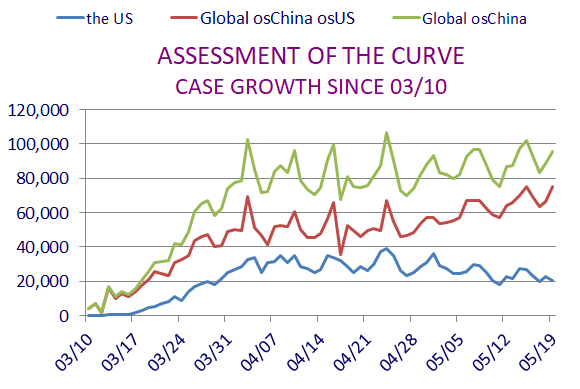
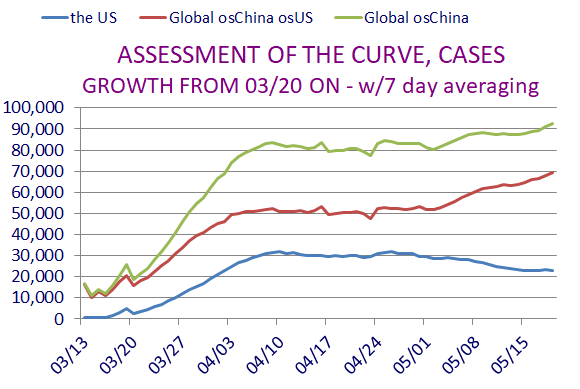
Our day wasn't bad today, but Globally outside China, things are on fire.
It's not looking good. Check out the direction of those red lines above.
It's fitting that Excel chose red for them.
The Active Cases outside China Globally / Chart
As in the U. S. version of this, we should see a good rise and fall at
some point these two.
Note that these present the one day and then 7 and 14 day averaging versions.
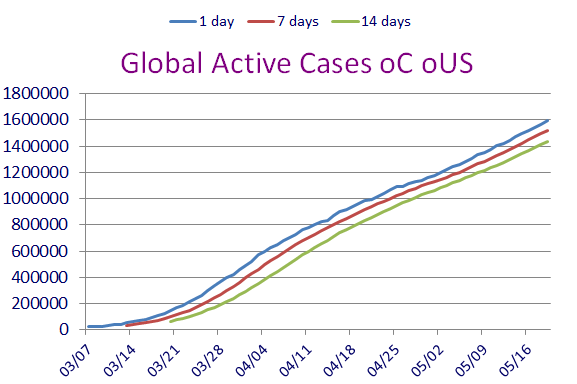
Remember, these are not new declared Cases. These are remaing active cases.
If you look closely at that last one, it shows that just when thing looked
ready to flatten out, new nations caught fire with COVID-19, and up when the
count of Cases again.
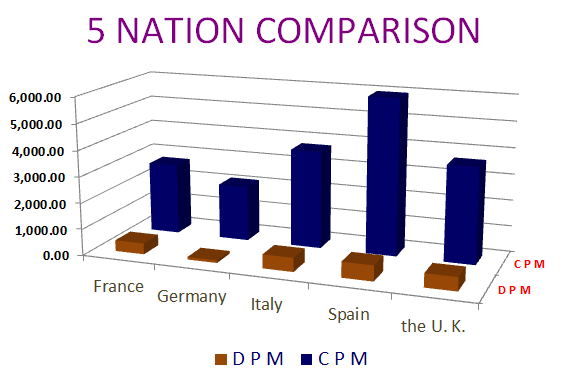
Special Section on France, Germany, Italy, Spain, and the U. K.
Case growth.
Let's Look at Some Numbers in Five Day Increments:
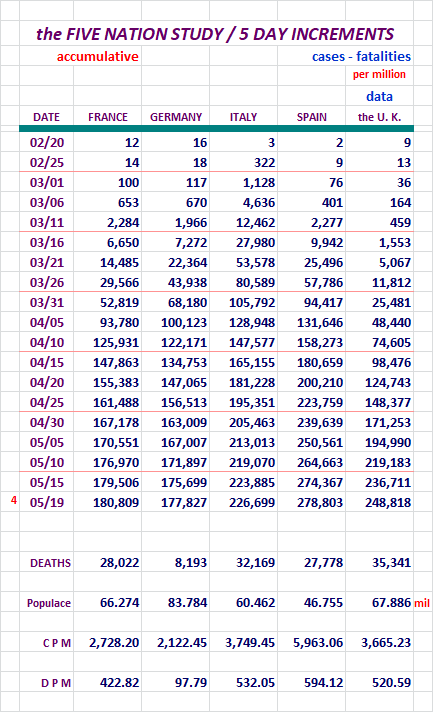
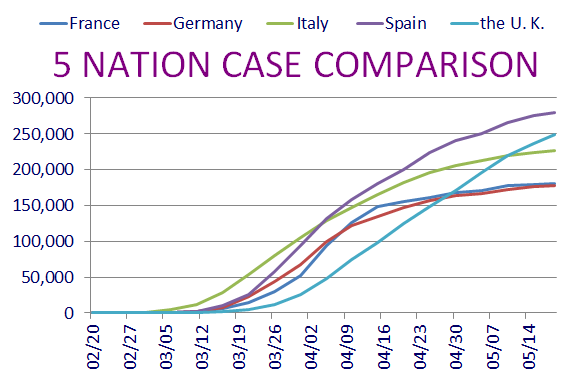
The same comments fit for about each day here.
The chart of Cases, causes the perception that it is in conflict with the
second chart below it. Actually it isn't. It is depicting raw numbers
of New Cases. Down below the chart addresses per million numbers.
They appear to skew, but everything is accurate here.
Sweden and It's Neighbors, Who Has the Best Tactic Against COVID-19?
Sweden is doing its own thing with regard to isolating. I think most people
are aware of it by now.
Here are some numbers to help us look at this issue.
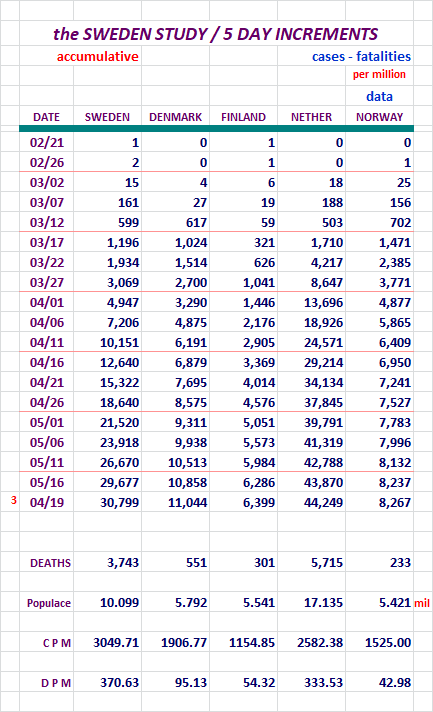
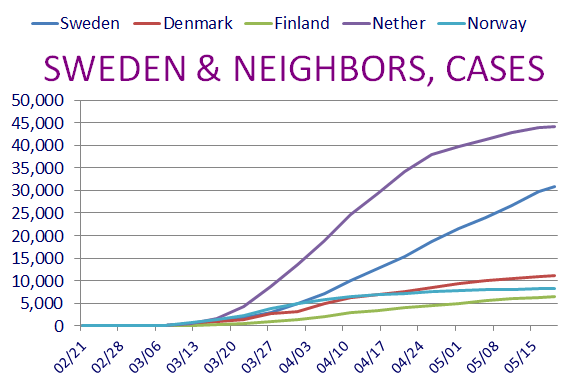
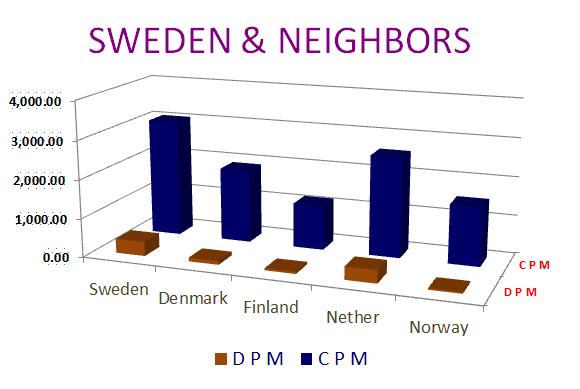
Sweden still remains a hot topic.
Section: 04
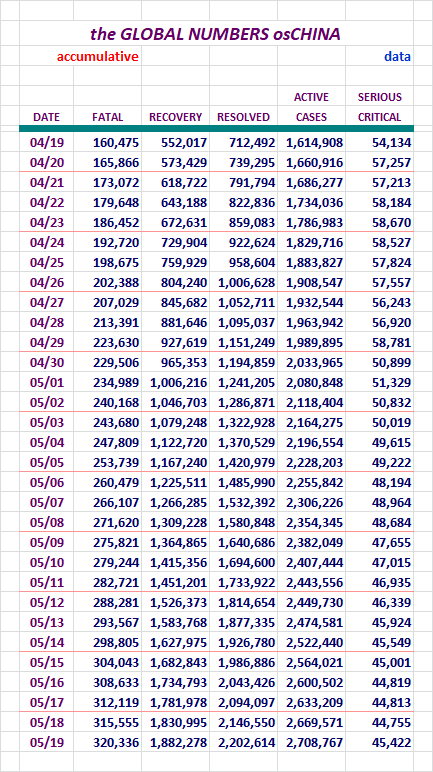
The Following Addresses the Global Numbers
including Mainland China*
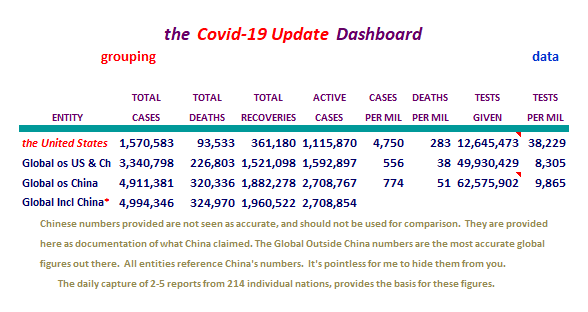
Mainland China's numbers are 0.003% of today's total global numbers.
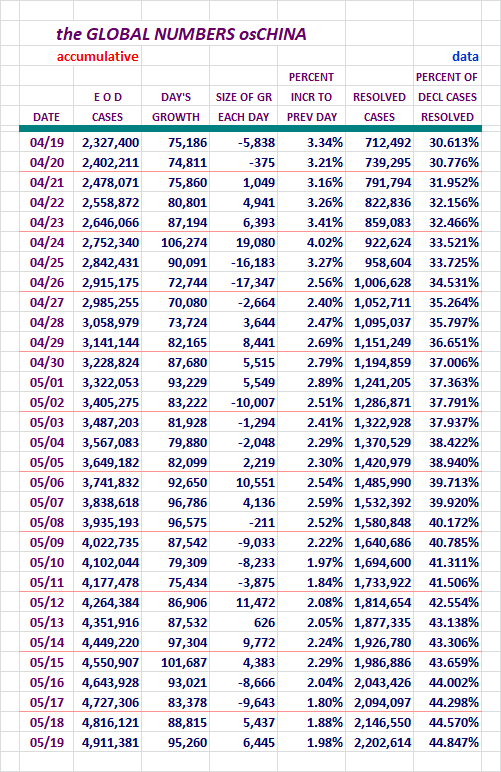
A Look at Declared, Resolved, and Active Cases, Includes M/L China
End of day figures follow:
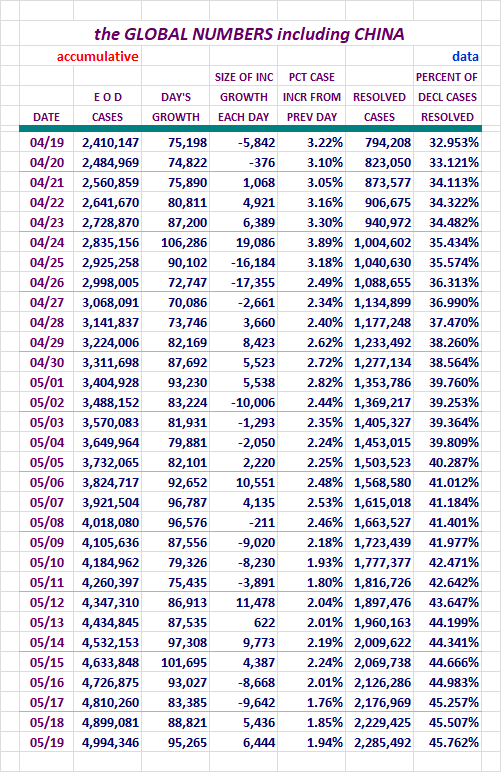
The New Cases number was a new record for a Tuesday. On the right that
Declared Cases resolution percentage continues to grow.
We should be at 50% by the 28th to the 30th of May. As it has been going,
we may actually hit 50% earlier than that. We'll see.
Fatalities, Recoveries, Resolved, Active, and Serious/Critical
Cases Globally, Including M/L China
Concept of adding in Active Cases and
Serious/Critical here, courtesy of amorphous
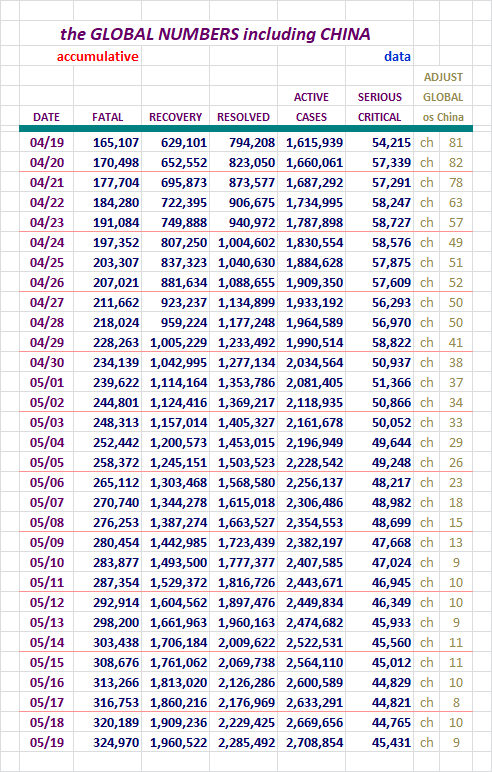
Not much to say here. Big numbers getting bigger...!
Section: 05
the Mortality Report
Making an effort to provide more mortality numbers these days.
Hopefully these upcoming numbers and charts will help with that.
Our numbers are big enough that they can hide the finer nuances of the
Global numbers outside China. For that reason, I strip our numbers off
that group and report them separately for this area of study.
Here are the figures for the growing case totals for four entities.
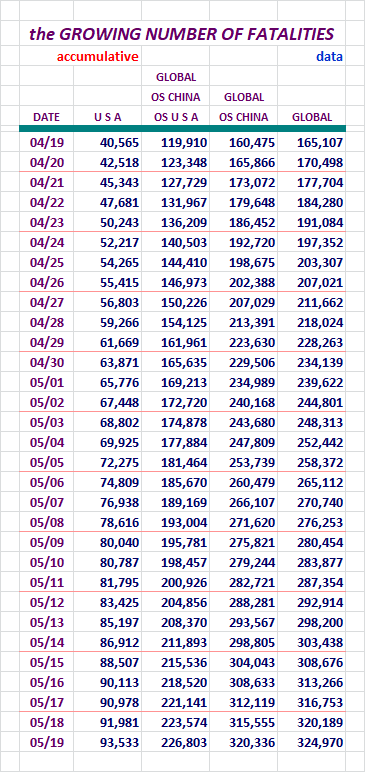
Our number of fatalities continues to go up, but at a slower pace.
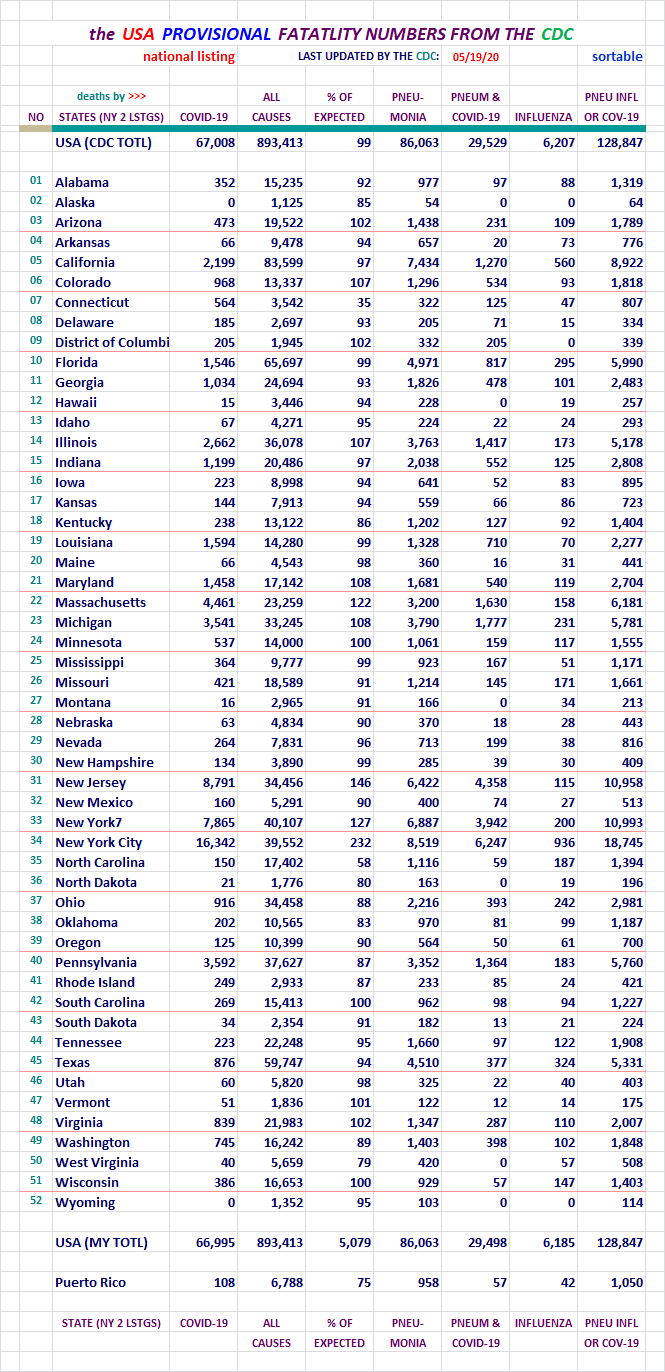
I urge folks to review the CDC's Provisional numbers bellow. I am not
touting this count (93,533), but it's out there so I mention it.
Here is the chart to go along with those figures.
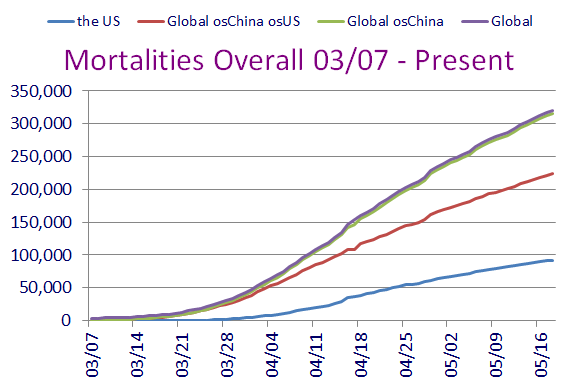
Looks pretty ominous there doesn't it.
Here are figures revealing the daily growth for those four entities.
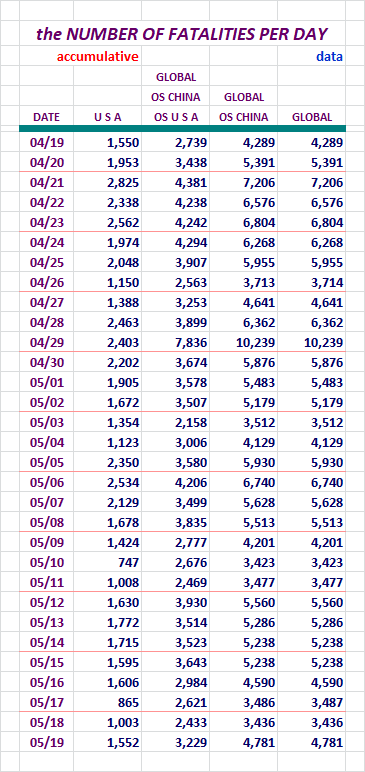
Our numbers of new Fatalities went up today. They remain in a low range.
It was a Tuesday. Hopefully we'll be able to keep them low this week. Good
luck to us...
Here are two charts to go with the above data.
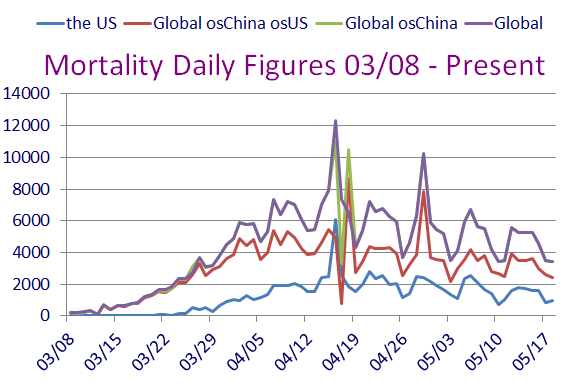
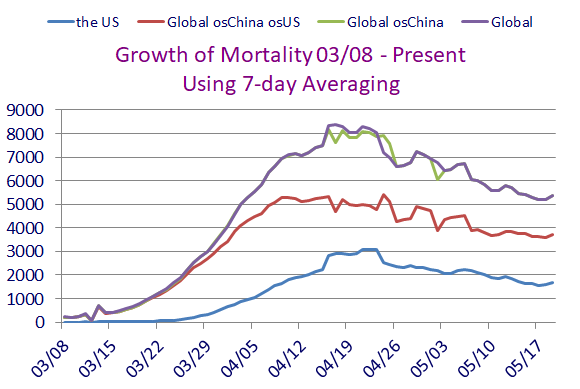
These each seem to be taking a little bounce up. We'll have to watch this
one closely.
Here, let's look at data for the U. S. broken out by itself.
A week back, we jumped up from Monday to a higher level. It seems that
we are able to move a bit lower most of the time.

We're still pretty low, but again, for how long?
Section: 06
Population Saturation
Here are figures revealing how many people in each population base represent one case.
I'm also showing what percent of each population base is infected at this time.
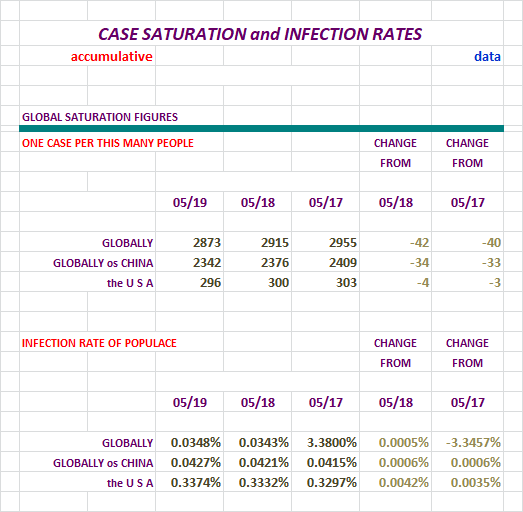
Not liking the trend here for us. I want to see our infection percentage drop.
Nations With Lots of Cases
At the end of the day yesterday, there were:
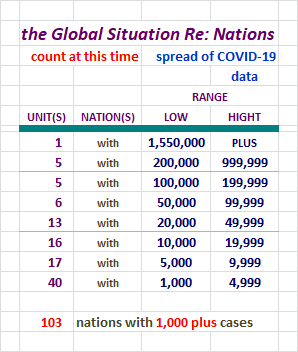
That's a whole lot of nations there. With over 1,000 in each one, we know
that over time they are potential declared cases time-bombs.
Right now in the Global scene, some of these nations are going exponential.
It's sad to see. Sadly, those folks can infect other nations too depening on
how things are handled. Other nations need to stay on top of things,
including our own.
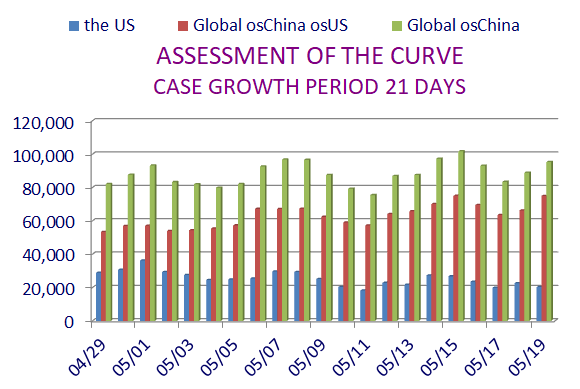
Daily Case Report Evaluation
I'll be keeping tabs on the daily tallies for days of the week for a while. Folks have
noticed some patterns of larger and smaller data entry on certain days, and on Fridays
sometimes the numbers get noticeably larger because of it.
And we now know Thursdays have potential to break out also. Yikes!
Let's check out the numbers and a chart.
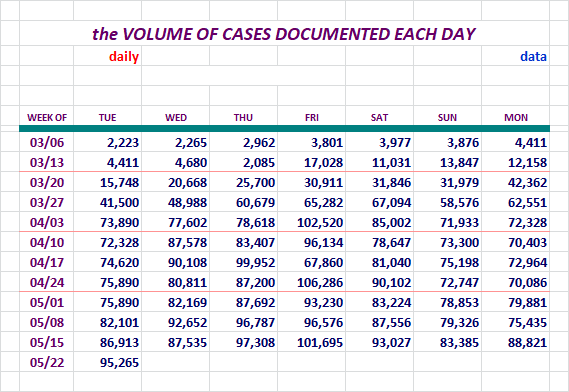
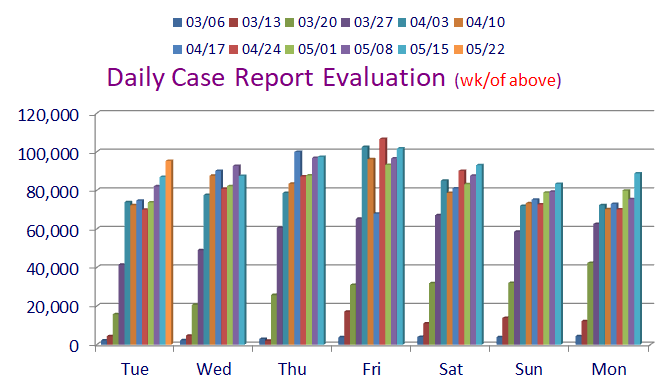
Today's new Cases set a new record for the day. So now that's Saturday, Sunday
Monday, and Tuesday. As high as we were today, tomorrow's record looks sure
to fall also. Tuesday's number was already higher than any Wednesday so far.
I increased the width of this chart so you could see the individual columns
better.
Section: 07
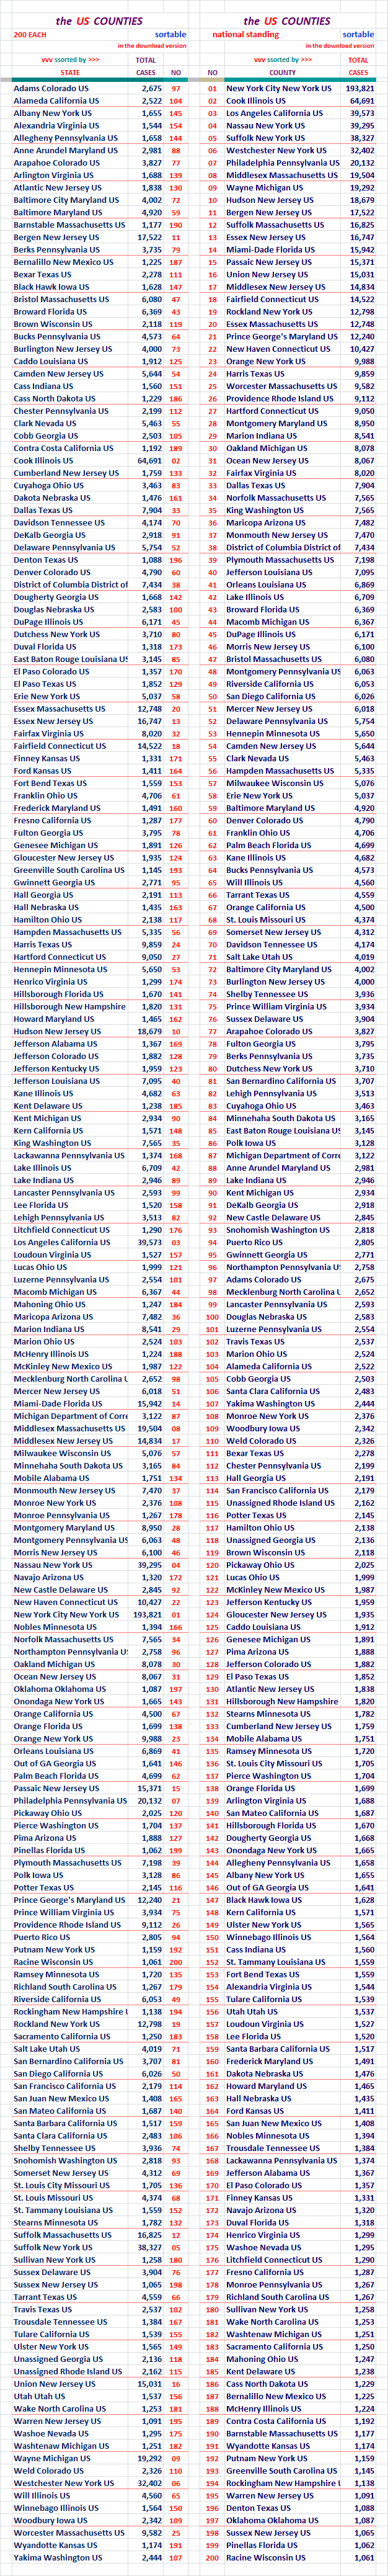
The Top 200 Counties in the U. S., by Number of Cases
This little report lists 200 Counties in the United States in declining Case numbers.
There is also a listing that is alphabetical. This report list only the entities
and the number of Cases in the two different sorts.
It will also be available as a downloadable Excel file in Section 12.
Section: 08
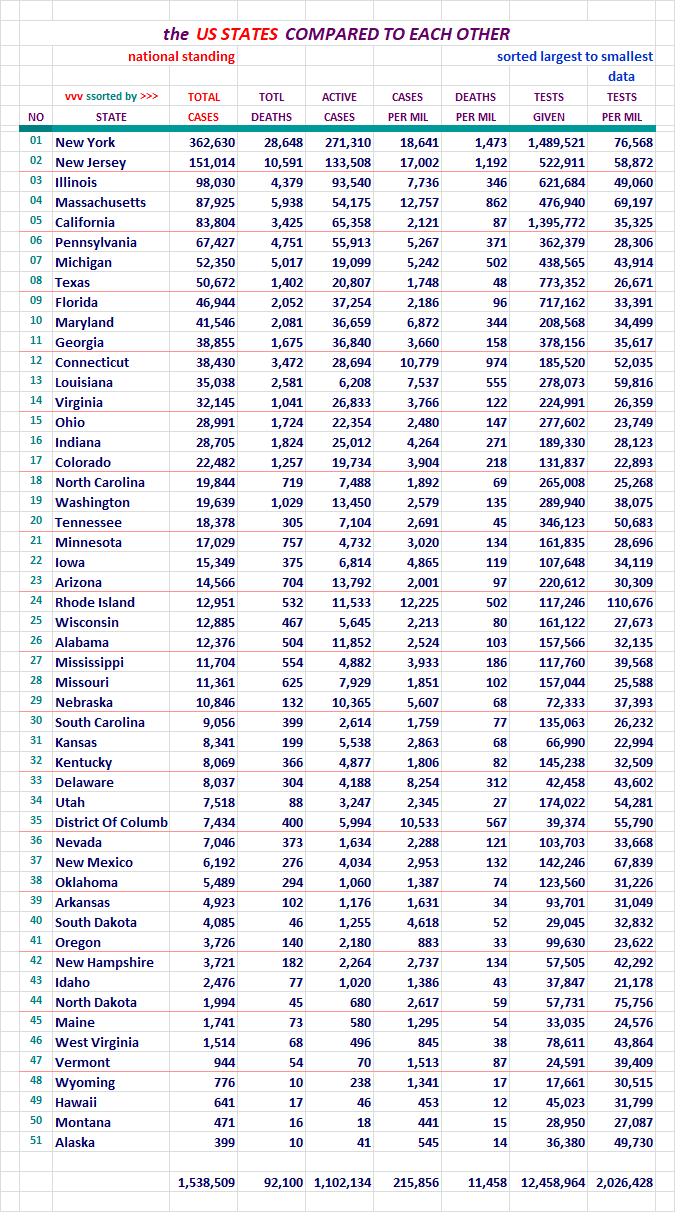
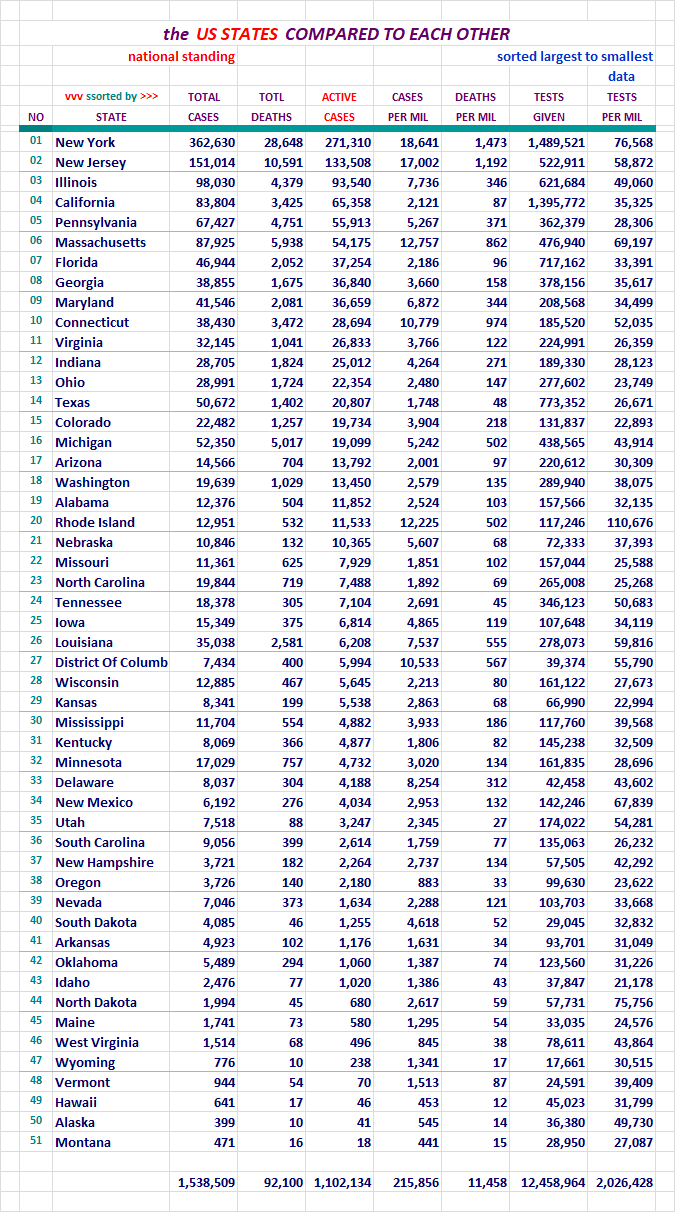
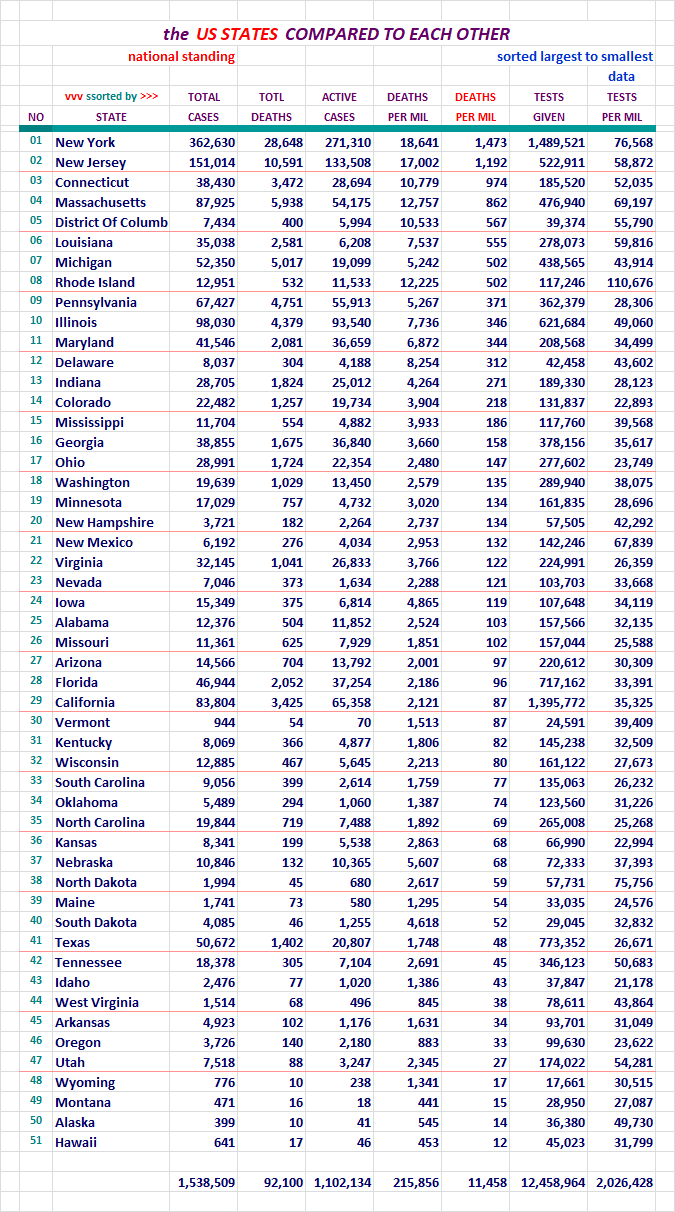
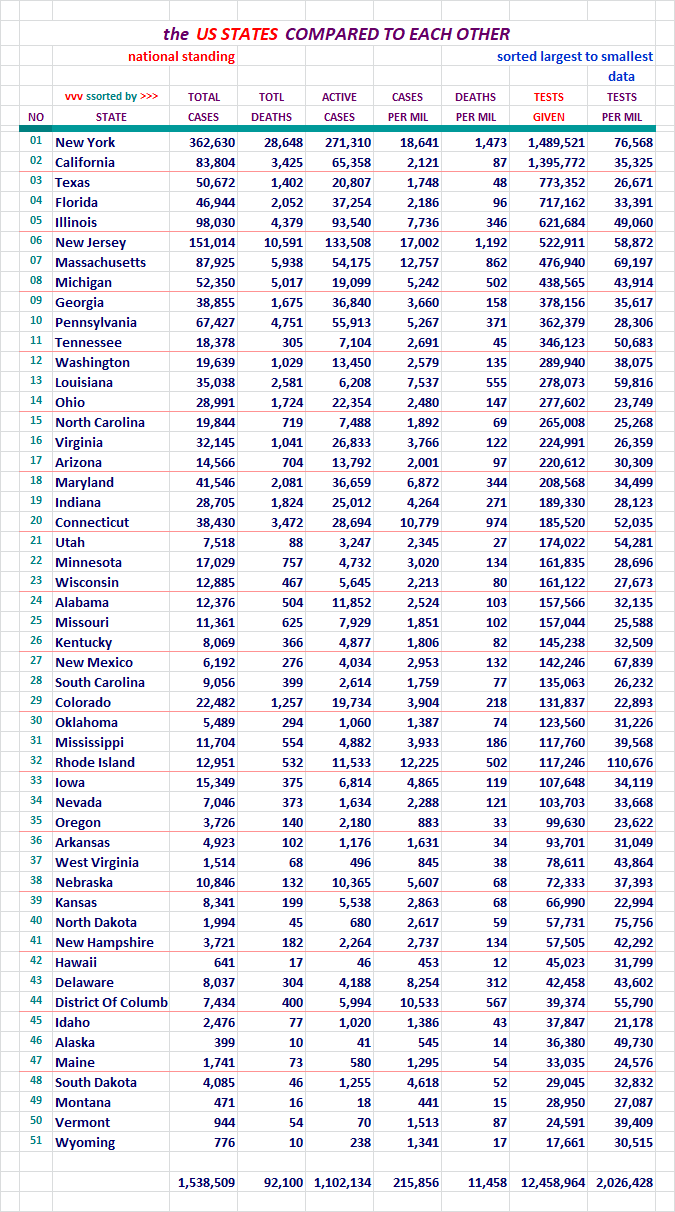
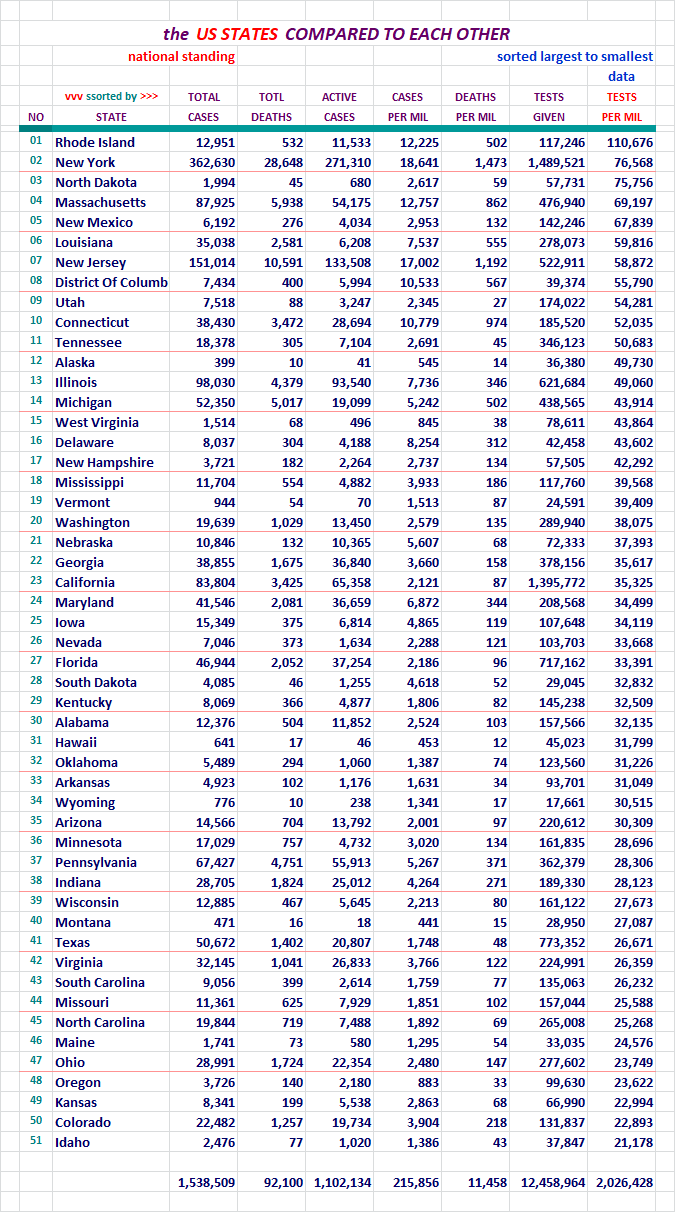
States of the Union and the District of Columbia, Compared to Each Other
Each of these pages is sorted differently. Look at the red header above
the columns to see which column was used for the sort on any given page.

For your review...
For your review...
For your review...
For your review...

For your review...
For your review...
For your review...
For your review...
For your review...
If this area interests you, please use this LINK to the source, and review
the lengthy description and explanation of it's development process.
There are two reports. The presentation above comes from the second one,
and the detailed segmented information below it, may interest you.
I'm contemplating moving these numbers under the states on the Alphabetical
list. The states and these entity's numbers should be combined to match
that of the U. S. figures each day. I'm kind of short changing these
states in that one alphabetical list, I'll be able to combine the numbers
so that folks can evaluate things better.
I may change it. I may not. Thinking...
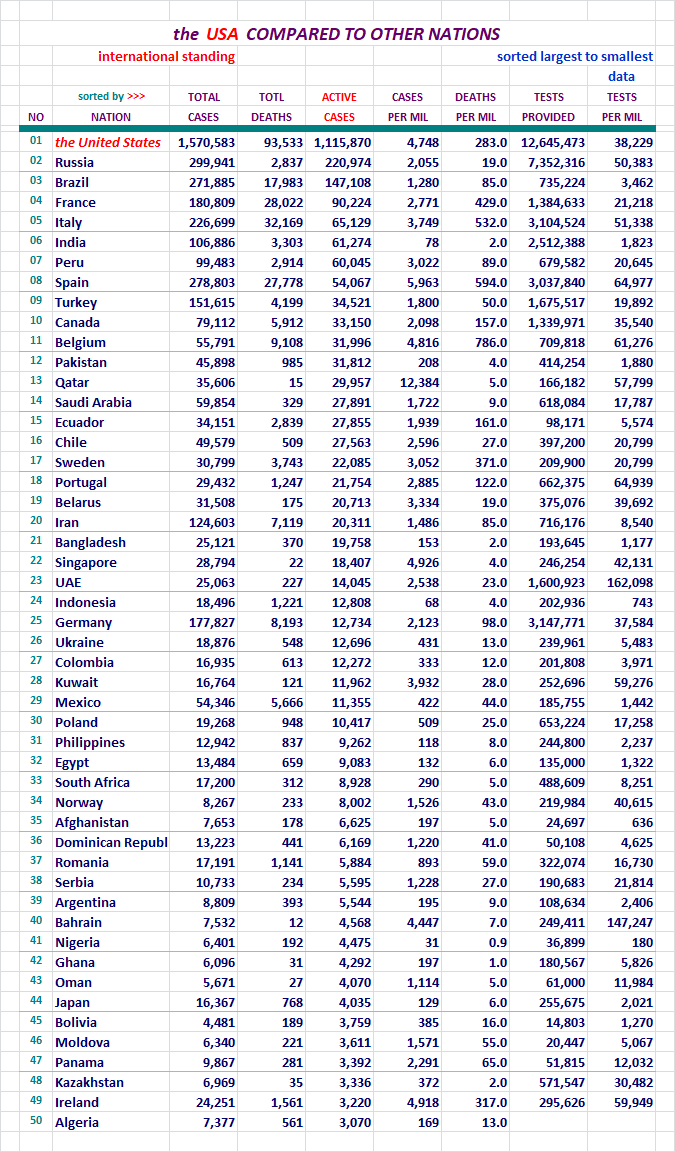
Section: 09
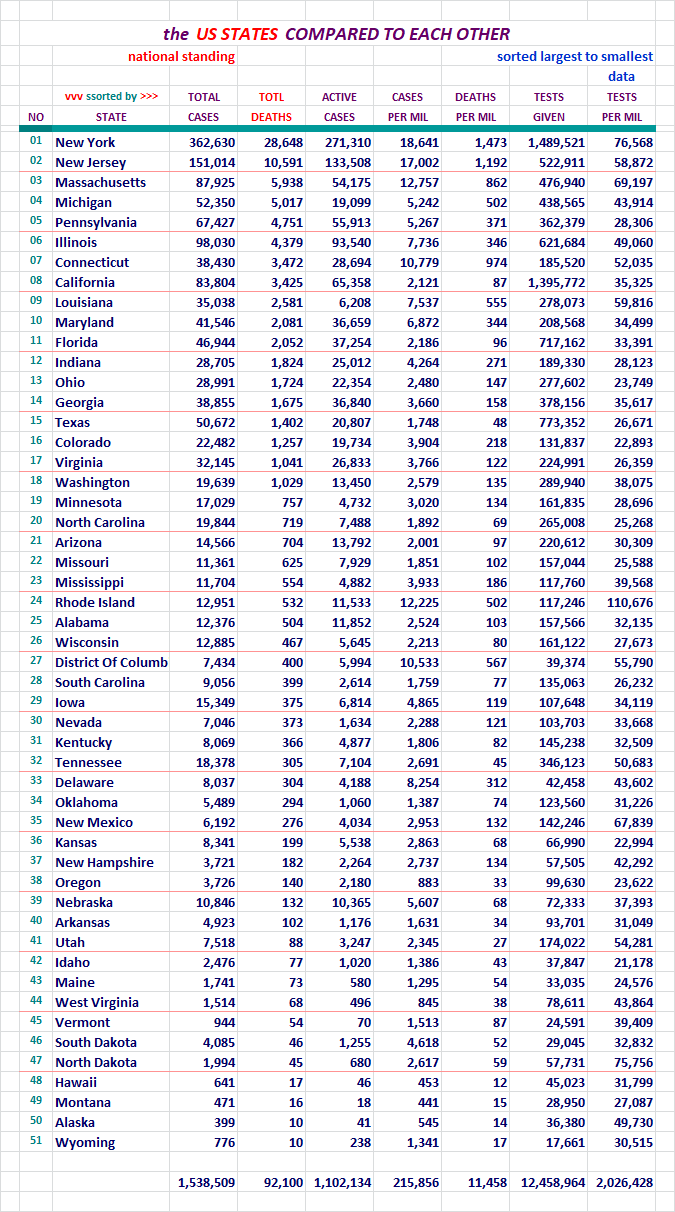
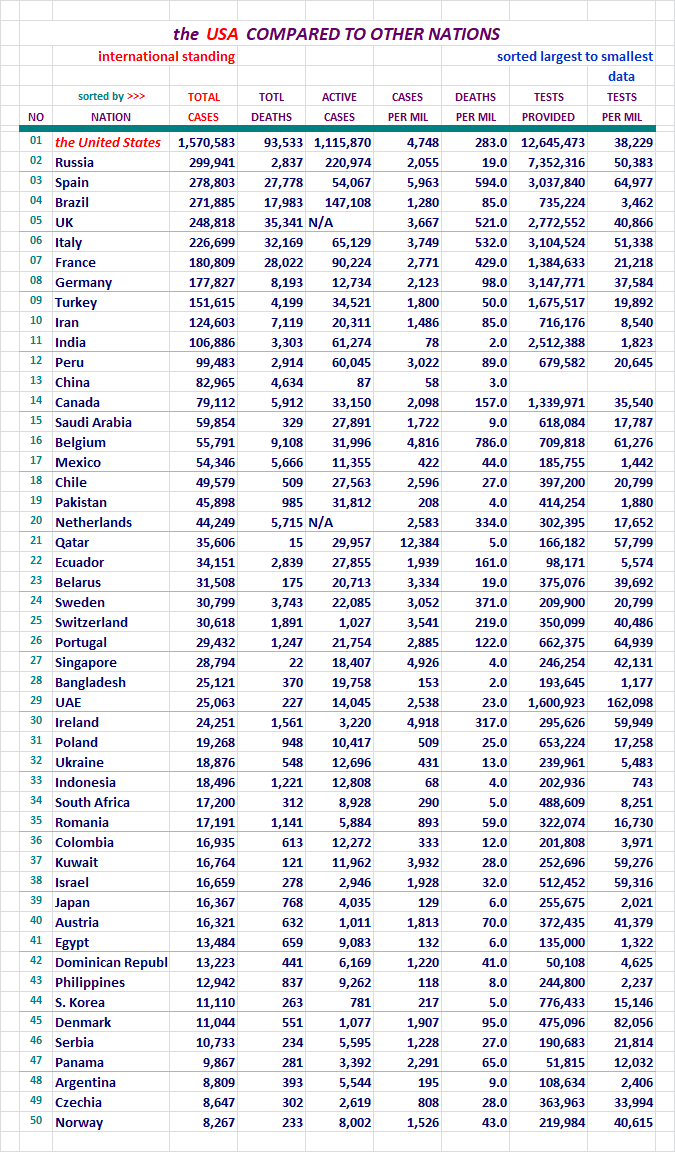
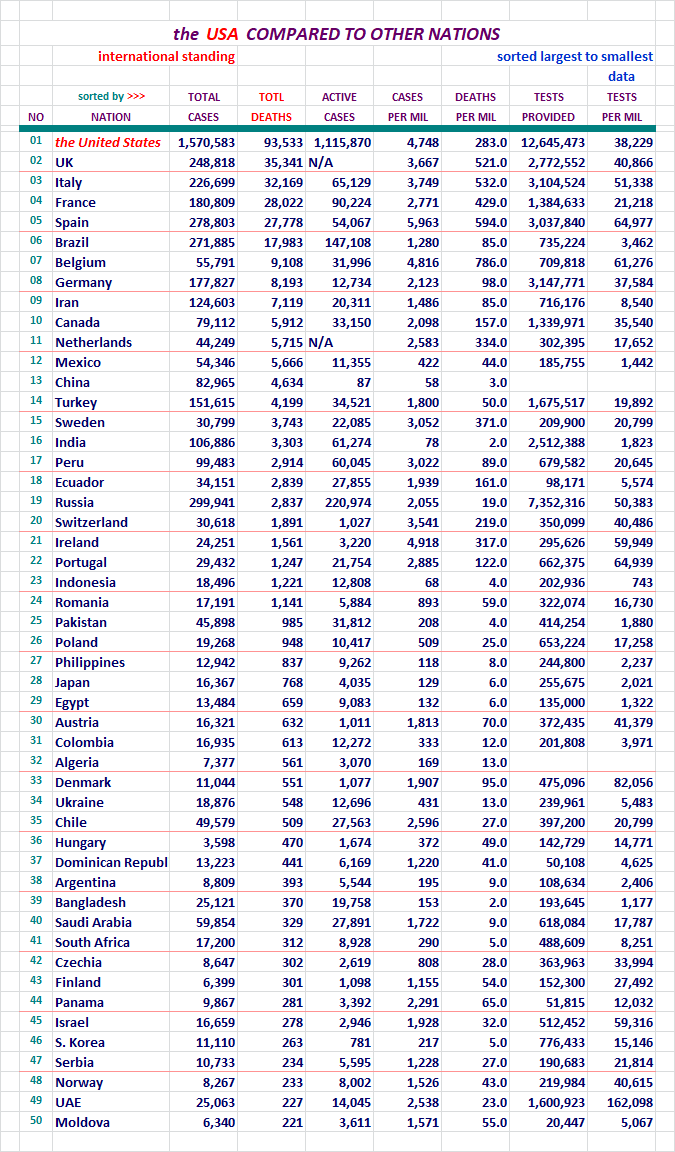
The United States, Where it Ranks With Other Nations?
Each of these pages is sorted differently. Look at the red header above
the columns to see which column was used for the sort on any given page.
The U. S. will be highlighted red here so we can find it easily in the list.
There was 215 nations on this list last night now. I didn't want to post
seven lists with 215 nations on it, so I picked the top 50. Coincidentally,
one report category had the U. S. at 41st, so it wasn't showing up on the
list with the 31 top nations on it. That wasn't the reason why I extended the
list length, but it did work out well.
I work on the nations right next to the states on my spreadsheet. The
states with the District of Columbia come in at a total of 51 lines.
I decided to keep the international reports near that length, and 50
was good enough.
Here we go... for your review.
For your review...
For your review...
For your review...
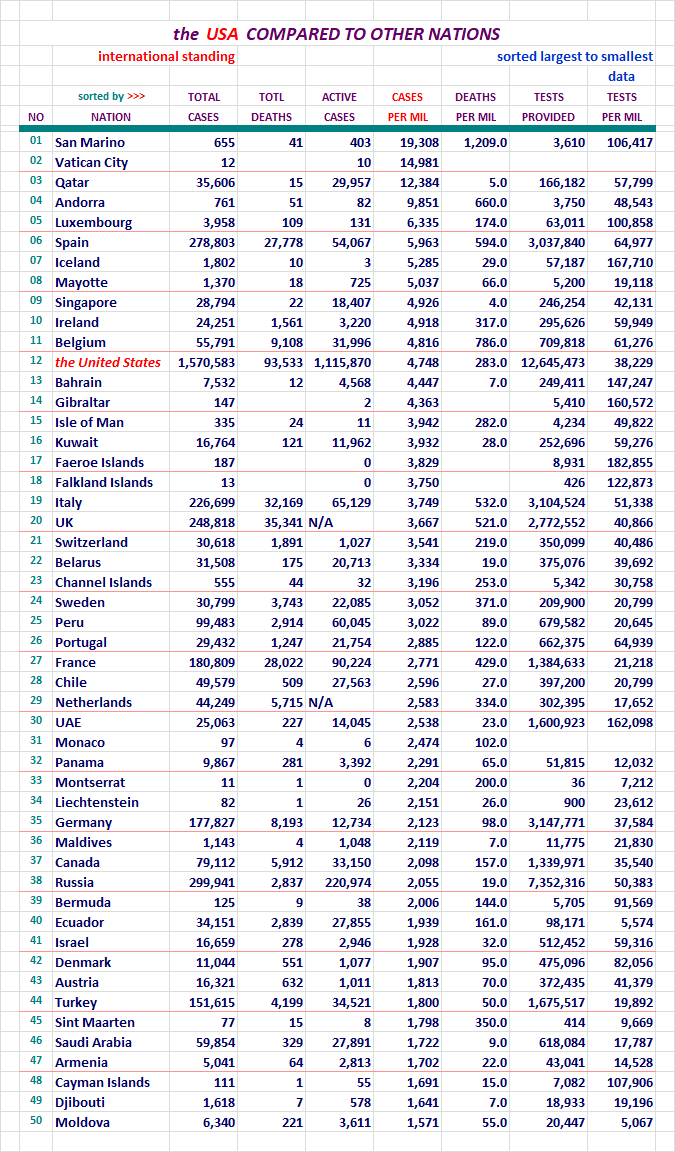
For your review...
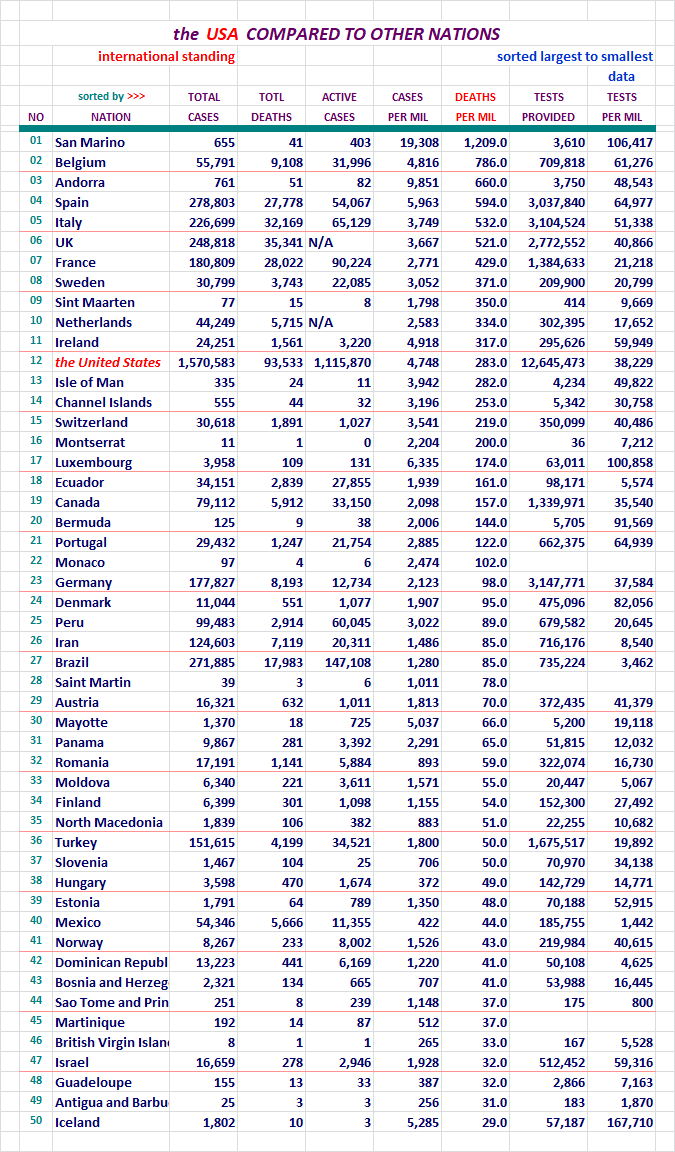
For your review...
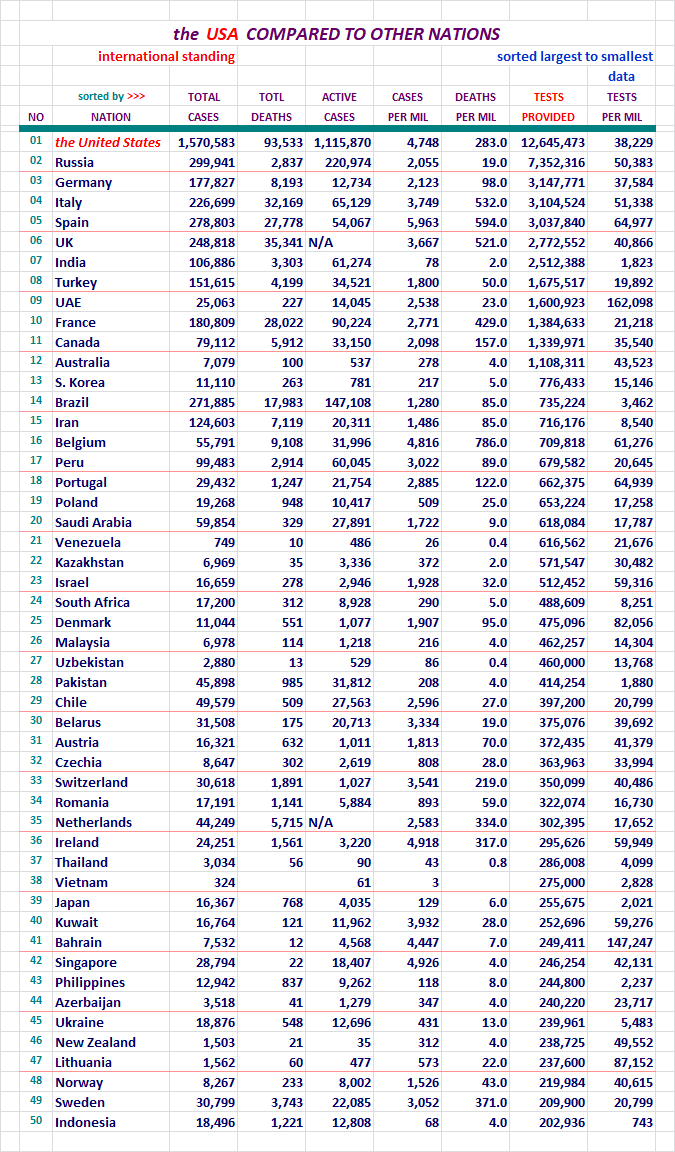
For your review...
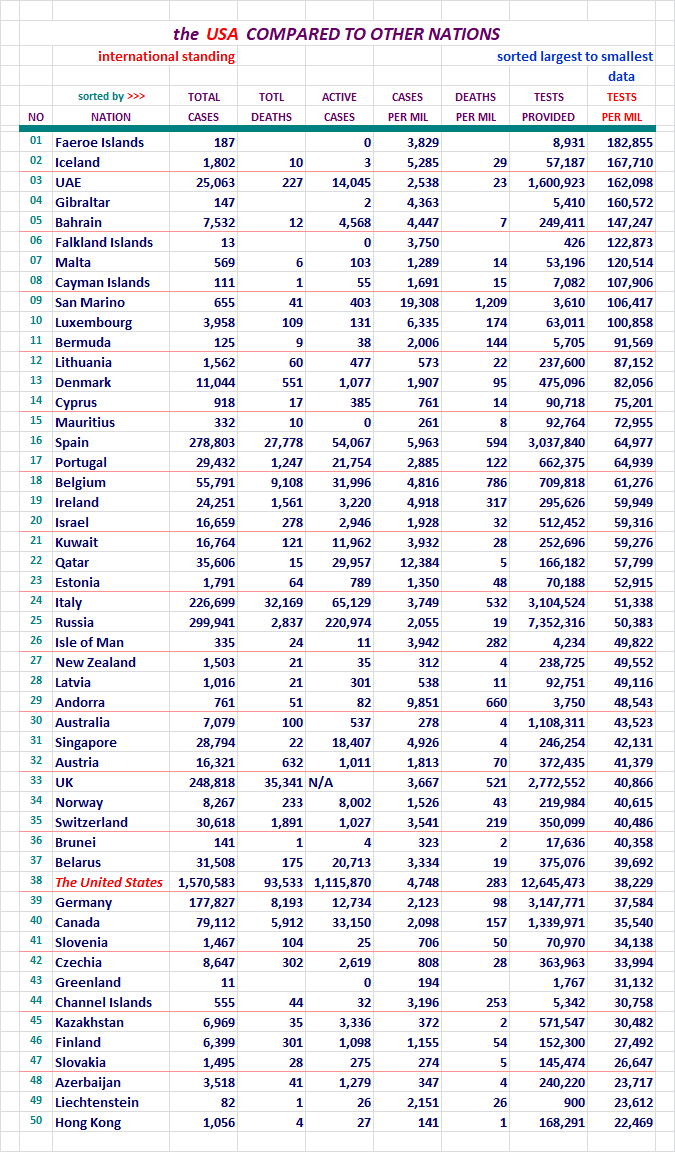
Okay, we're back down to 38th in testing
Section: 10
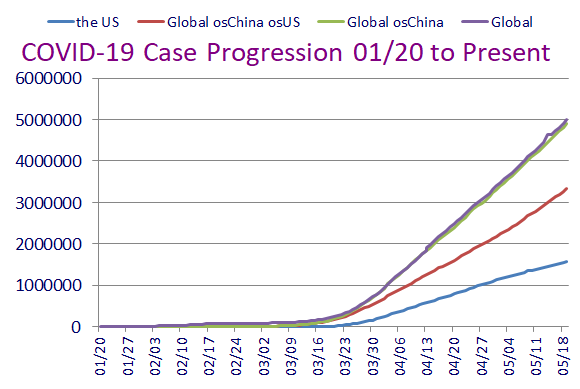
Here is what it is all about. From January 20th to the present.
This concludes our look back at yesterday's data. Take care...

Section: 11
Data for this Report Sourced From:
LINK WorldoMeters
LINK Johns Hopkins University
The Center for Systems Science and Engineering (CSSE)
LINK United States Center for Disease Control - Provisional Numbers
Listed in the order of current utilization...
LINK You are Invited to Review My COVID-19 Spreadsheet (XLSX)
There is not an XLS version available for distribution at this time.
Section: 12
Other Features:
LINK US Counties200, States & DC51, Territories & Other Entities11, Nations214,
and the CDC Provisional Counts53
Five Excel Spreadsheet datasets you can sort for your own studies...
Section: 13
Links to other resources:
I cannot vouch for these sites. Please use your own judgement.
LINK Adventist Health Coronavirus Resource Hub - Scroll down for useful info
LINK Antibiotic Vitamin, the (Vitamin D)
Good article on Vitamin D's likely role in prevention of infection. Thanks Blam.
LINK CDC Data for Download - Scroll down - Excel required. Includes death stats.
LINK CDC National Center for Health Services
Provisional deaths as determined by review of vital documents. Much lower...
LINK CDC Secondary Data and Statistics - Portal Entry / Look around
LINK Coronavirus (COVID-19) Map
LINK Coronavirus infection risk may be reduced by Vitamin D
by Former CDC Chief Dr. Tom Frieden
LINK Coronavirus Spread Quickly Around the World in Late 2019, Study Shows
the University College London Genetics Institute
LINK COVID-19 Deaths Broken Out by Thirds, 05/07/20 Map of US Counties
Very revealing display of Concentrated Death Zones - thanks hoosiermama
LINK COVID-19 First U.S. Case, Treatment, features Remdesivir
New England Journal of Medicine article
LINK Cytokine Storm, med Actemra, Physician near death saved
LINK Diamond Princess Review at 634 Case Point of Eventual 712
LINK Hydroxychloroquine Article: International Poll
Daily Mail Reports, Most Effective Treatment According to 6,000 Physicians
LINK Hydroxychloroquine Has about 90 Percent Chance of Helping COVID-19 Patients
the Association of American Physicians and Surgeons, reports 91.6% of patients improved clinically
LINK IHME - Institute for Health Matrix and Evaluation
LINK National Institutes of Health - Cornavirus (COVID-19)
LINK Nasal Irrigation is the Key, COVID-19 Related
LINK New York City - interesting breakdown, borough, age, sex
LINK On the Origin of CCP Virus, A Documentary Movie (turn up the sound)
Epoch Times: I highly recommend this very well documented report.
LINK Rt COVID-19
Calculates and displays the Rt Factor for each state. Thanks FreedomPoster.
LINK World Health Organization

Checking in on your presentation. TY
Now that is not a range, that is not even a SWAG, that is pure bullshit.
I don't care how long it takes for states to report the numbers, a 31,000 death differential can not be even close to the facts.
This is the same CDC that reports the covid 19 crap.
I'm not blaming DoughtyOne for what he is reporting, I'm just not believing it, it's not even close to reality.
Thank you D1
I keep hearing of states revising/correcting past death numbers DOWNWARD from past reports.
Wondering why I am not seeing any of that in your daily report?
Thanks for the numbers. And wanted to verify some post I had seen about the mortality rate. I didn’t have to go far into your numbers to find what I needed :-) not this time anyway. Looks like the US is that just about 6%. And that the global numbers without China about 6.5. So it’s pretty consistent. So there’s actually a 94% recovery rate. Some things I have seen said 98 or 99.
[THREAD]
-The success of Hydroxychloroquine as a treatment in Italy, India, Bahrain, France, Costa Rica, South Korea, China, South Dakota, etc
-Media coordinates attacks on Hydroxychloroquine with blatantly flawed studies
Credit to @niro60487270 and @JamesTodaroMD
https://threadreaderapp.com/thread/1253154064868626432.html
Disclaimer: Opinions posted on Free Republic are those of the individual posters and do not necessarily represent the opinion of Free Republic or its management. All materials posted herein are protected by copyright law and the exemption for fair use of copyrighted works.