Posted on 05/22/2020 3:57:56 AM PDT by DoughtyOne
PING LIST - Please contact me as needed...
COVID-19 Update # 65
As of 05/21/2020 23:15 PDST United States CDC - Provisional Numbers
As of 00/00/2020 23:45 PDST Johns Hopkins University - Capture Nations Informaton
As of 00/00/2020 23:45 PDST Johns Hopkins University - Capture Counties Information
As of 00/00/2020 23:46 PDST Johns Hopkins University - Process JHU Data
As of 00/00/2020 23:59 PDST WorldofMeters - Document Core Numbers
As of 00/00/2020 23:59 PDST WorldofMeters - Capture Nations Information
As of 00/00/2020 23:59 PDST WorldofMeters - Capture States Information
As of 00/00/2020 00:00 PDST WorldofMeters - Data Processing begins...
As of 00/00/2020 ??:?? PDST Publish COVID-19 Update - 00/00/00
Thank you for stopping by to check out the COVID-19 Update.
Here you can find...
Section: 01 Commentary, Special Reports, COVID-19 Update Info, & System Notes
Section: 02 the United States Situation
Section: 03 the Global Community Situation Outside China
Section: 04 the Global Community Situation Including China with reservations
Section: 05 the Mortality Report
Section: 06 Miscellaneous Reports of Interest
Section: 07 the United States, Counties (alphabetical / case no descending)
Section: 08 the United States, States Ranking, Provisional Numbers, & Territories
Section: 09 the United States, Ranked with Other Nations
Section: 10 the End of this COVID-19 Update
Section: 11 Data Sources and a Link to My Own Spreadsheet
Section: 12 Linked Spreadsheet: Counties, States, Provisional, Territories, & Nations
Section: 13 Links to Other Resources
Section: 01
Commentary, Special Reports, and COVID-19 Update Information4
Interesting Tid-bits (hopefully)
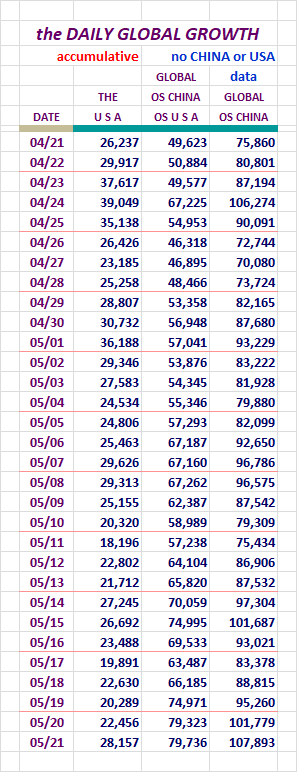
New Global COVID-19 Cases Set Single Day Record
On Thursday the Global number of new Cases of COVID-19 came in at 107,897.
That eclipsed the previous record of 106,286 set on 04/24. (yikes)
Yesterday's Summary in a Nutshell
It was another record breaking day globally. Thursday's 107,897 was fed
by that group of nations I've been mentioning. With over 1,000 cases in
over 104 different nations now, we could be seeing scores of massive cases
from many of them. The Global community is being hit hard. There's no
other way to put it.
Saturday through Thursday saw a record of New Cases for the day. Having
already set the new one day record, I think there's a very good chance the
record set yesterday will fall today.
The U. S. numbers climbed back up into familiar territory at 28,157. The
Thursday/Friday double whammy is back. We spent a week with lower per day
numbers since we were last in this region. We have to go back to the 8th to
find a day with more new Cases than yesterday.
Thursday may be the big day this week, but if not look out. That 107,897
record number may be retired today.
As for Fatalities, the Global numbers wound up at 4,937 for the day, coming
in higher than the 4,787 figure from the day before.
Our Fatalities for Wednesday came in at 1,418. The two days before were 1,408
and 1,552. This is at least 1,000 points below our highest levels of
fatalities, so we can be thankful for being lower than that range.
Friday on deck!
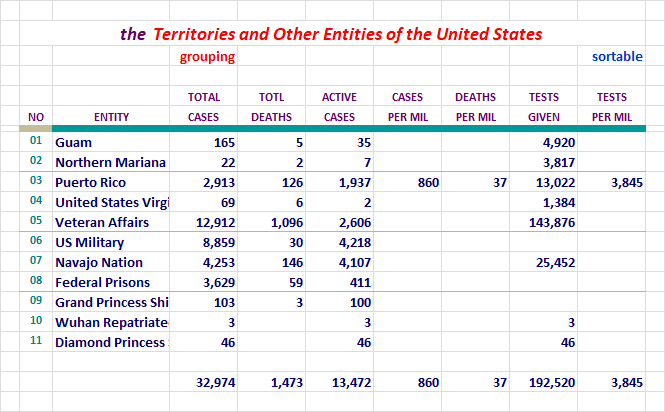
Territories, Other Entites Have Additional Location in the Update
I have been posting the Territories/Other Entities in it's own location at
the end of the States Comparison section. That will remain there. Starting
last night I am also providing data for these entites at the bottom of the
States Alphabetical printout. (where I compare states with numerous sourts)
United States figures have come from both the states and these Territories
and other entities. Tonight for the first time they will be grouped so
that you can see the full total of them all, and compare to the U. S.
national numbers. They'll match up if I do things right. Don't hold your
breath. LOL (some nights...)
Additional Feature Added / Testing and New Case Declarations
I was asked to address and compare Testing with New Case declarations. At
the bottom of the USA Section: 02, you'll see a new set of Data and a Chart.
The percentage of New Cases compared to the Tests administered is what I think
folks wanted to see. It's there with the Data and Chart.

Section: 02
The Following Addresses the Numbers Here in
the United Staetes of America
Here we go...
You can see the increased Case Count today. We jump up a tier into a higher
neighborhood. Hopefully tomorrow won't be a blow-out day. We'll see...
Concept of adding in Active Cases and Serious Critical here, courtesy of amorphous
Here are more of our numbers...

Fatalities are still holding lower. We've been much higher than this, and
not all that long ago either.
Our Slice of the COVID-19 Pie
The growth of our slice of the pie has been dropping recently.
Here are the numbers I've been tracking, Globally Declared and Active Cases.
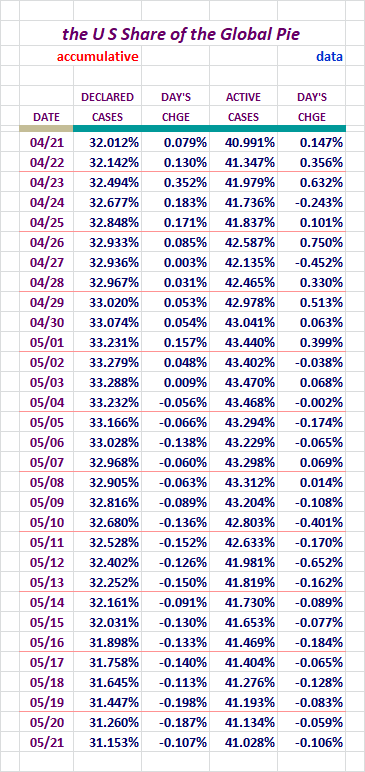
Our slice of the global pie has been getting smaller. I'm glad to see this.
While each day the percentage drop isn't that impressive, since 05/04 we
have dropped 2.340% as it relates to Active Cases. When it comes to
Declared Cases, we have dropped 2.018% since 05/03. As nubmers grow
outside the U. S., this drop is sure to speed up.
Active Cases in the United States / Chart
Unlike some of the other charts here, we should see a good rise and
fall at some point withone.
Note that this presents the one day and then 7 and 14 day averaging versions.
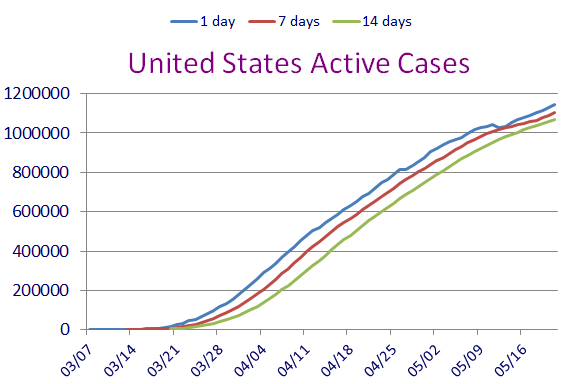
Remember, these are not new Declared Cases. These are remaing Active Cases.
All three indicators here were pointing to a flattening out of remaining Active
Cases.
Now it seems as if they might be having second thoughts. This bears watching
over the next few days. The move back up to the 28,000 area won't be helpful.
Testing and New Case Figures
Requested by stocksthatgoup
Some folks have shown an interest in seeing the COVID-19 Test figures compared
to the New Cases being declared. This following Data addresses that.
I went back as far as I could in my records. I plan on keeping a running
30 day display here, with the Chart starting on 04/21 & 04/23 ongoing.
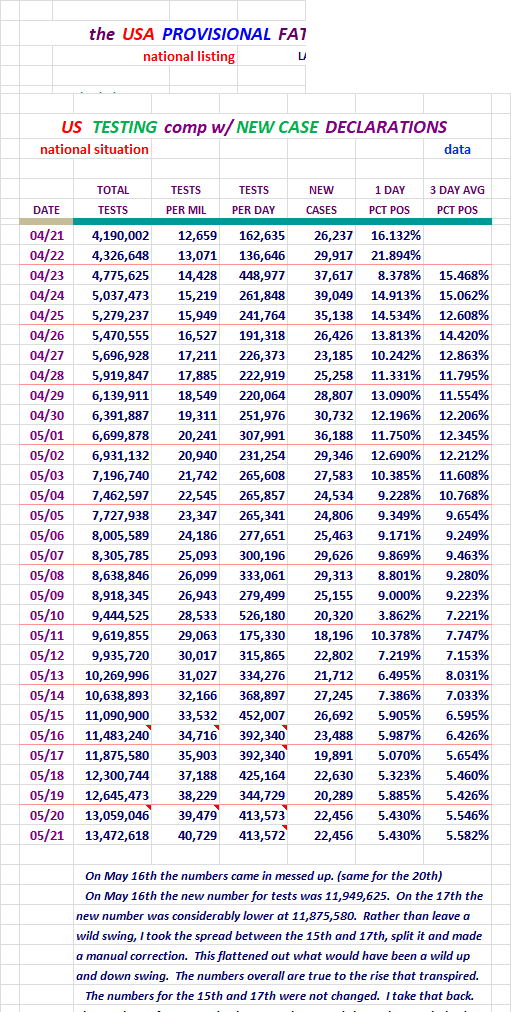
You can see how the Declared Cases to Testing percentage has gone down over
time.
There was another massive overstatement of testing figures two days ago. I had
to take measures to bring things back to reality. The count the day before
showed over 14 million tests, which was bogus. We are not testing 1.5 million
people per day. Yesterday we were back to the mid 13 million range.
I took the same sort of measures I did when this happened on the 16th.
Here is a chart to reveal visually what the decline has looked like.
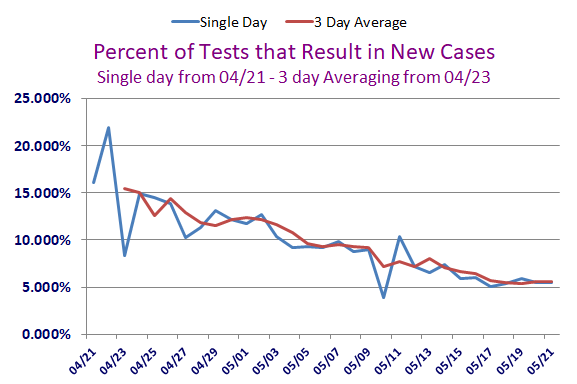
Folks can determine for themselves just how New Cases are affected by the
Testing. Please disregard the last day on that line. It was messed up by
above data problem. I'll work on that tomorrow.
Section: 03
The Following Addresses the Global Numbers
without Mainland China
Here is the first set of Data for the Global Outside China
Territories
The growth of new Global Cases outside China is not going well. Those
nations we've been tracking with over 1,000 cases each, there are 104 of them
now, and some of them are growing exponentially. Brazil and Russia are two that
are.
Fatalities, Recoveries, Resolved, Active Cases, and
Serious/Critical Cases - Globally, Excluding M/L China
Concept of adding in Active Cases and
Serious/Critical here, courtesy of amorphous
Here we go...
Again, I don't believe there is anything unusual here today.
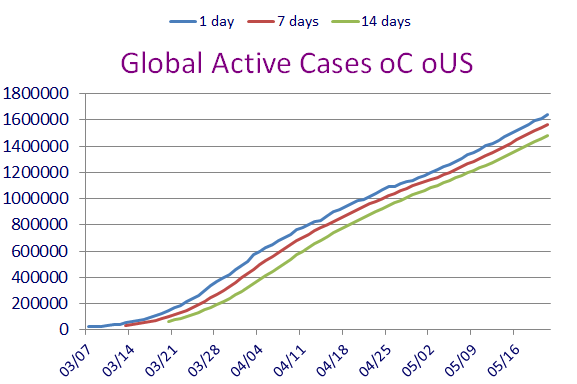
How is the Global Community Outside China Doing,
Without U. S. numbers?
Well, a little better yesterday...
Globally out side China and the U. S., the numbers are a mess. That middle
number there is the highest it has been, and it indicates an out of control
situation. Look at those numbers go up.
Well, we were supposed to have a valley this week, but guess what, there's a lot
less valley than usual. On the Global scene, starting Saturday, every single
day has seen a record day for the day of the week. I'll touch on this more down
below.
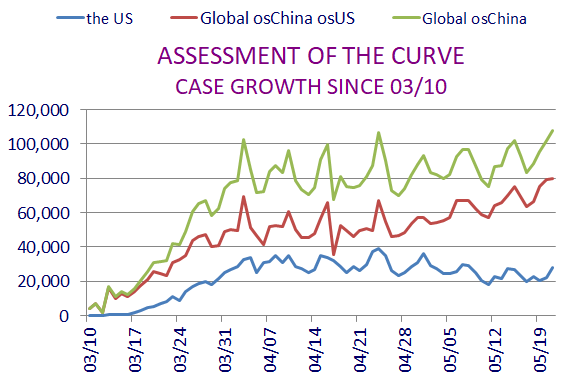
Our day wasn't bad today, but Globally outside China, things are on fire.
It's not looking good. Check out the direction of those red lines above.
It's fitting that Excel chose red for them.
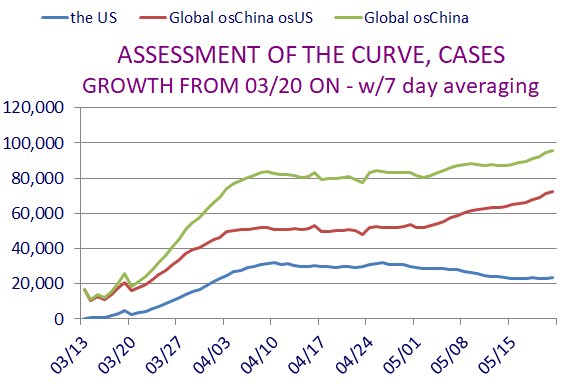
The Active Cases outside China Globally / Chart
As in the U. S. version of this, we should see a good rise and fall at
some point these two.
Note that these present the one day and then 7 and 14 day averaging versions.
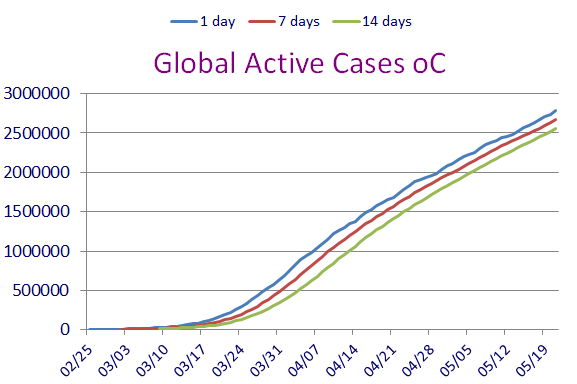
Remember, these are not new declared Cases. These are remaing active cases.
If you look closely at that last one, it shows that just when things looked
ready to flatten out, new nations caught fire with COVID-19, and up went the
count of Cases again.
Special Section on France, Germany, Italy, Spain, and the U. K.
Case growth.
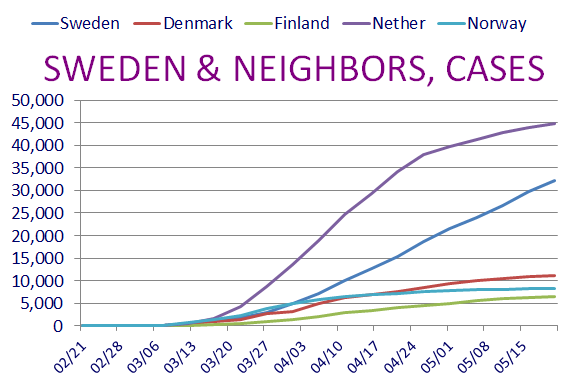
Let's Look at Some Numbers in Five Day Increments:

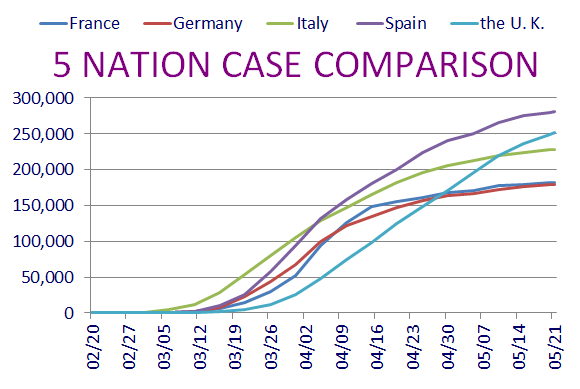
The same comments fit for about each day here.
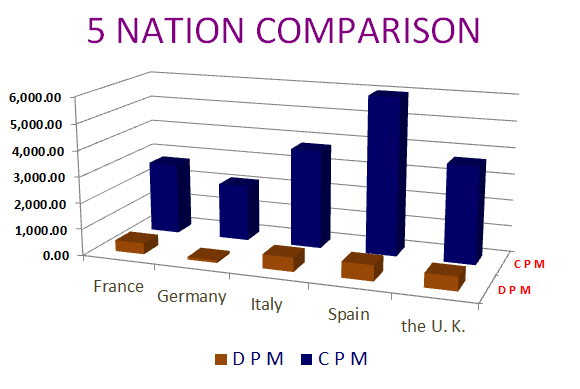
The chart of Cases, causes the perception that it is in conflict with the
second chart below it. Actually it isn't. It is depicting raw numbers
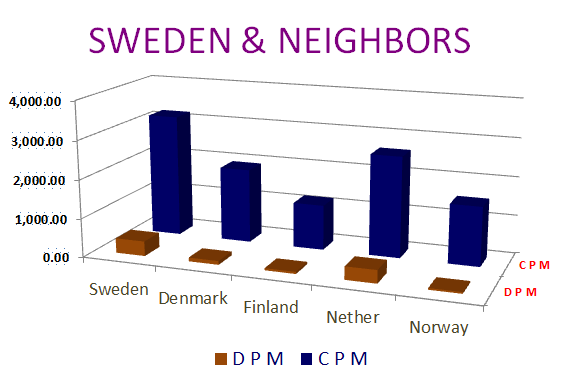
of New Cases. Down below the chart addresses per million numbers.
They appear to skew, but everything is accurate here.
Sweden and It's Neighbors, Who Has the Best Tactic Against COVID-19?
Sweden is doing its own thing with regard to isolating. I think most people
are aware of it by now.
Here are some numbers to help us look at this issue.
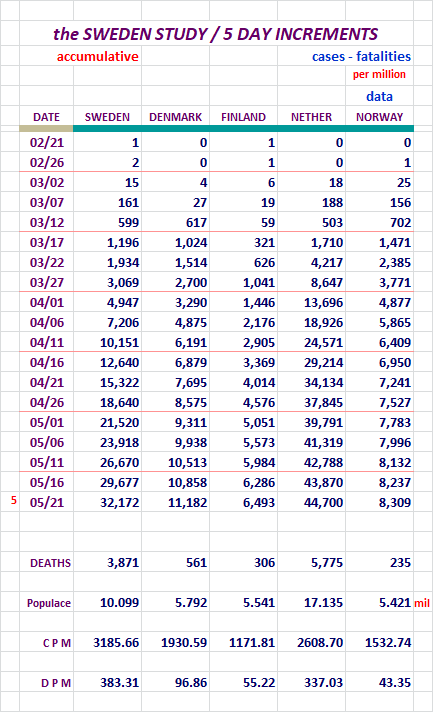
Sweden still remains a hot topic.
Section: 04
The Following Addresses the Global Numbers
including Mainland China*
Mainland China's numbers are 0.003% of today's total global numbers.
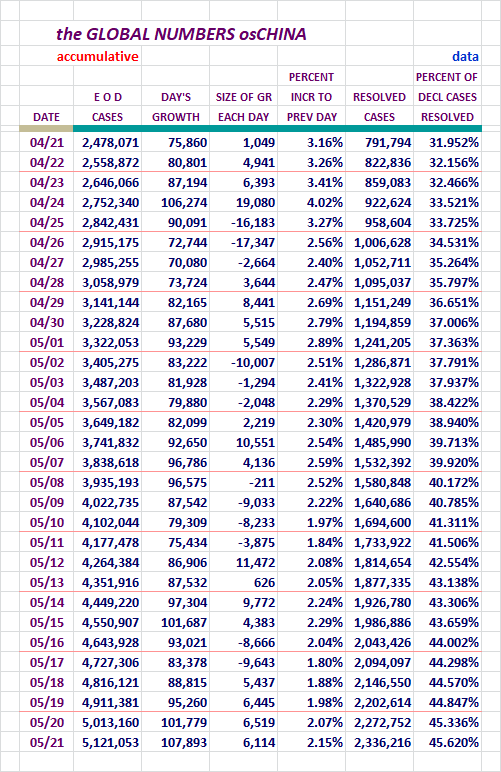
A Look at Declared, Resolved, and Active Cases, Includes M/L China
End of day figures follow:
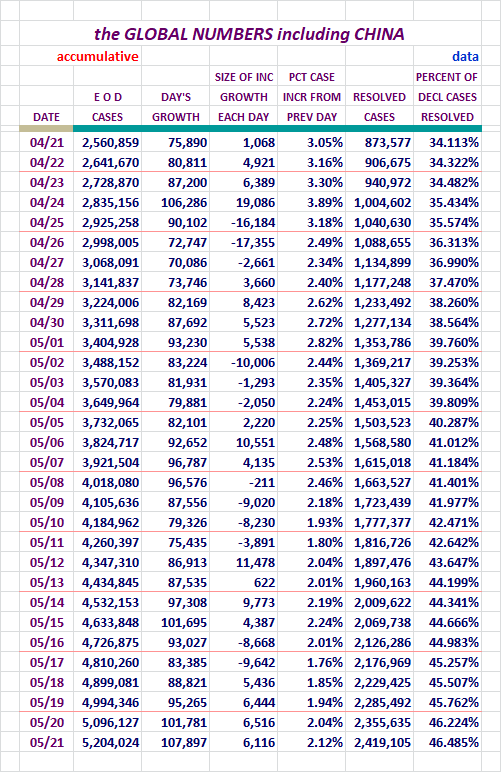
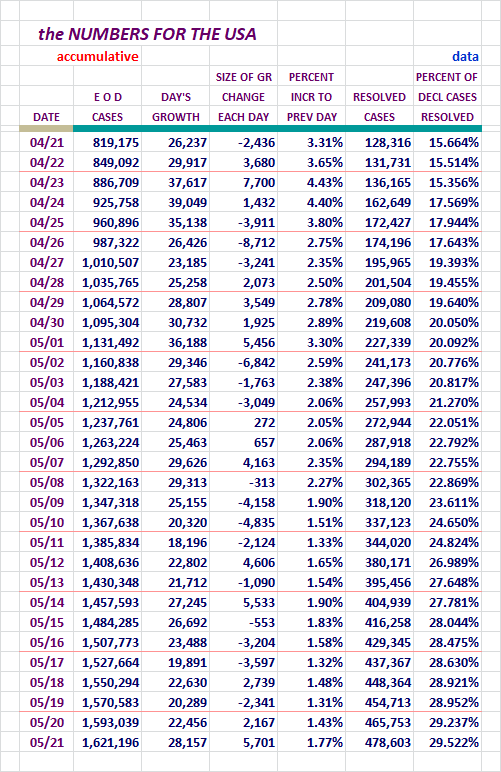
The New Cases number was a new record for a Thursday. On the right that
Declared Cases resolution percentage continues to grow.
Look at the increase from 04/21 to this point. Nice...
We should be at 50% by the 28th to the 30th of May. The way it has been going,
we may actually hit 50% earlier than that. We'll see.
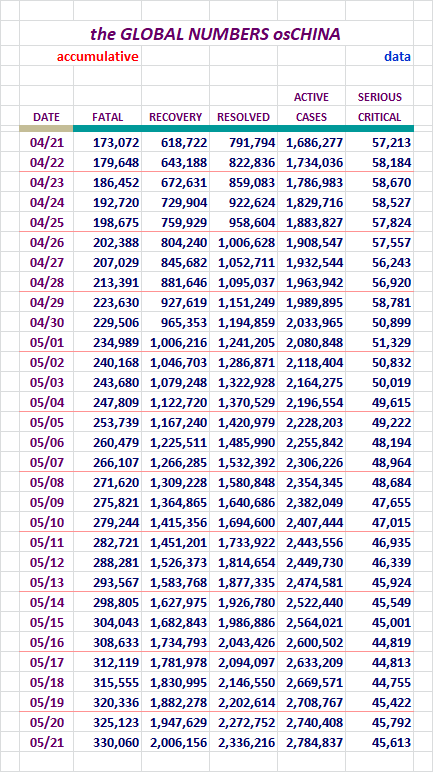
Fatalities, Recoveries, Resolved, Active, and Serious/Critical
Cases Globally, Including M/L China
Concept of adding in Active Cases and
Serious/Critical here, courtesy of amorphous
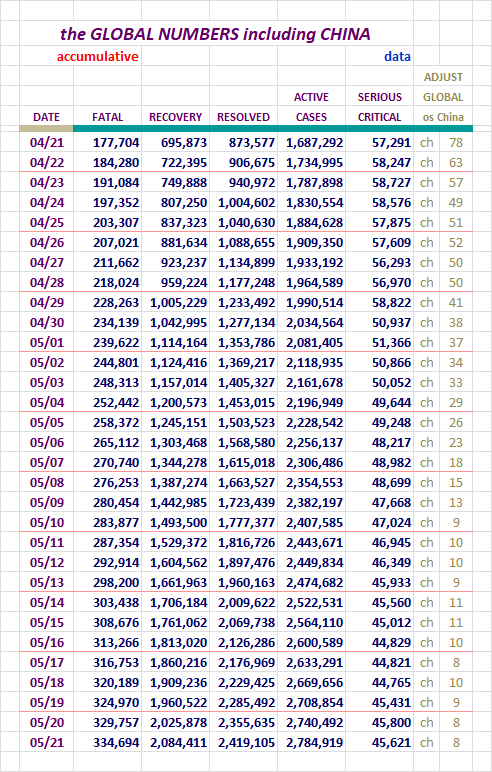
Not much to say here. Big numbers getting bigger...!
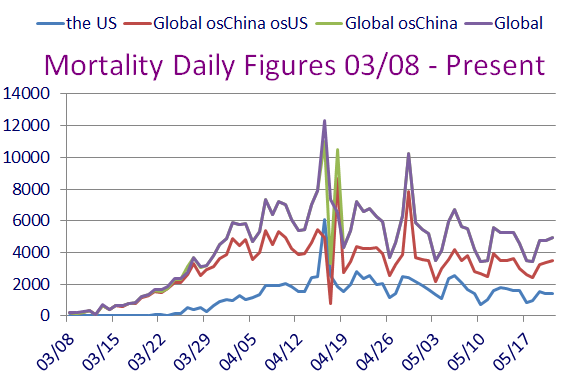
Section: 05
the Mortality Report
Our numbers are big enough that they can hide the finer nuances of the
Global numbers outside China. For that reason, I strip our numbers off
that group and report them separately for this area of study.
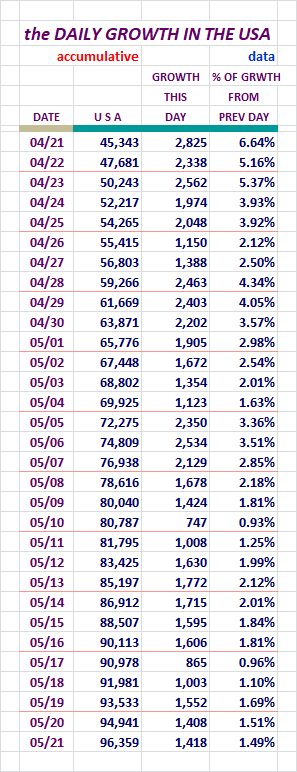
Here are the figures for the growing case totals for four entities.
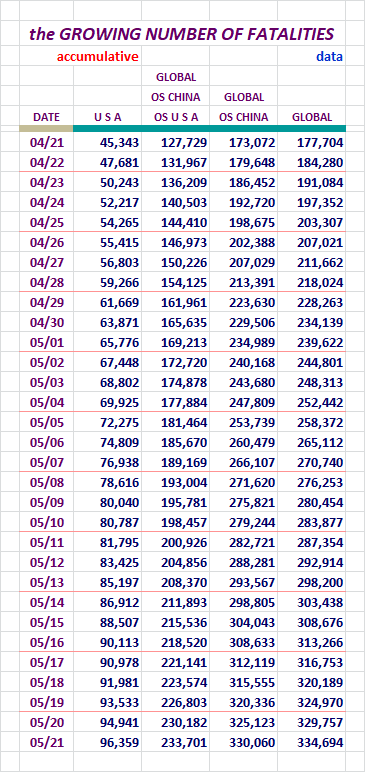
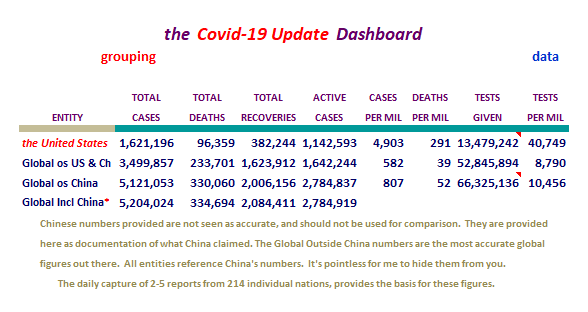
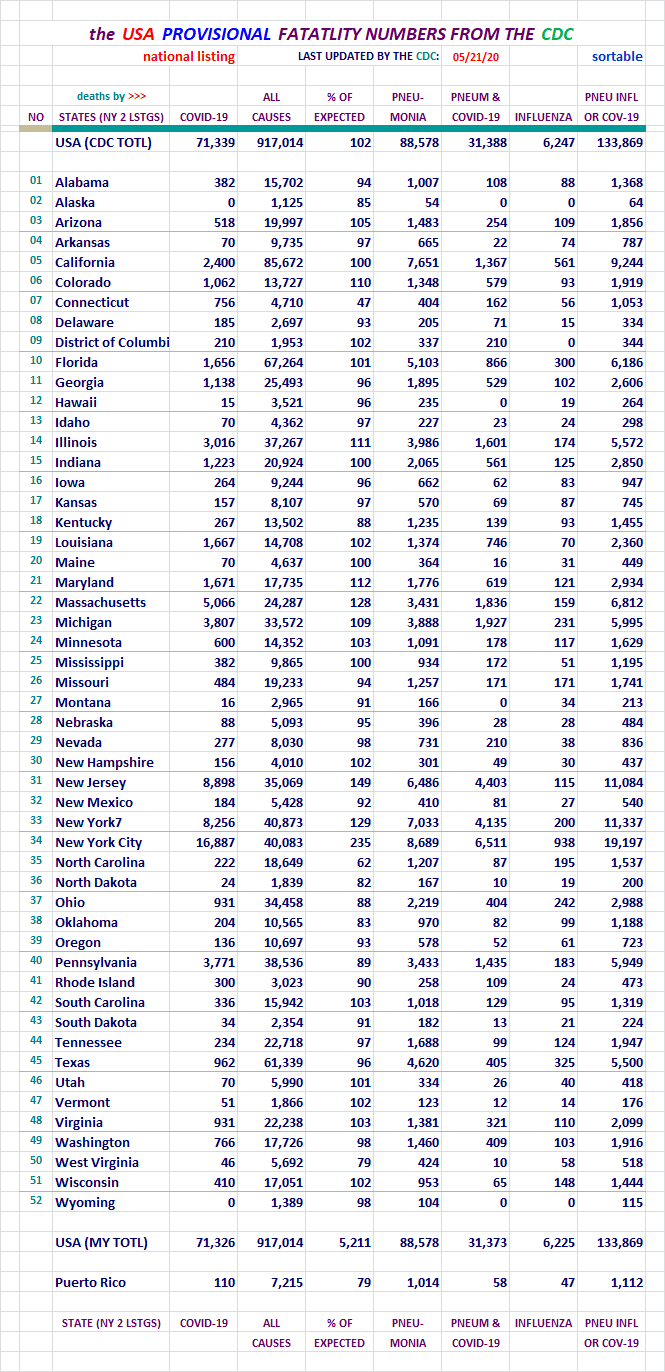
I urge folks to review the CDC's Provisional numbers bellow. I am not touting this count (96,359), but it's out there so I mention it.
Here is the chart to go along with those figures.
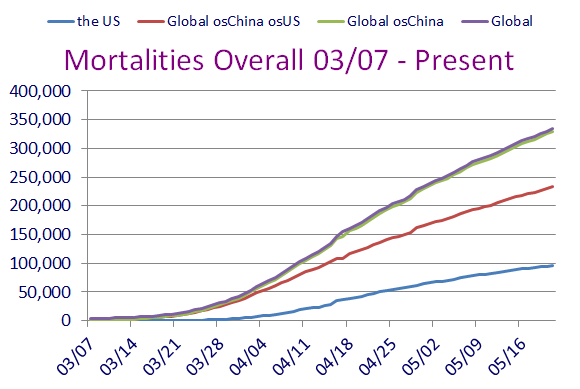
Looks pretty ominous there doesn't it.
Here are figures revealing the daily growth for those four entities.
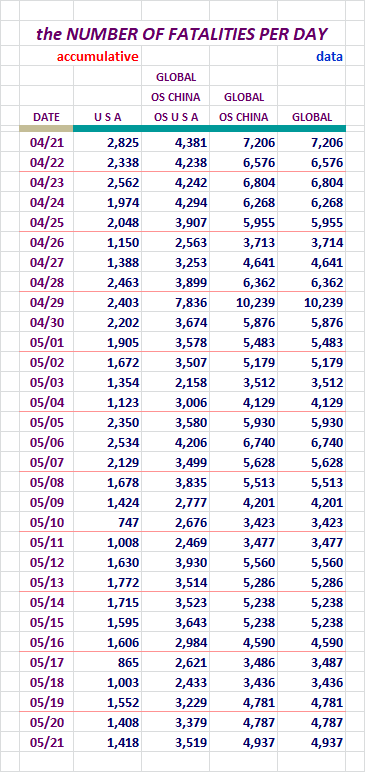
Our numbers of new Fatalities went down yesterday. Heading deeper into the
the week we went down even as the Global community has been breaking records.
Good for us!
Here are two charts to go with the above data.
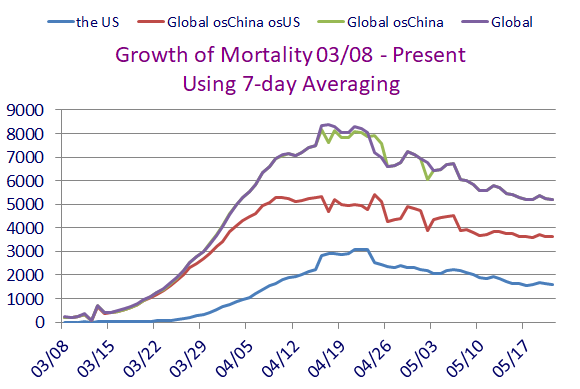
These each seem to be taking a little bounce up, then down. We'll have to
watch this one closely.
Here, let's look at data for the U. S. broken out by itself.
Looking back, yesterday's figure looks a lot better. Even in the last month
we can see a lot higher days.
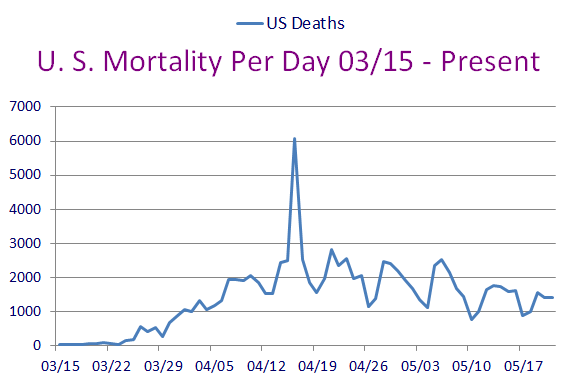
Despite moving up, we're still lower than we have been, but again, for how long?
Section: 06
Population Saturation
Here are figures revealing how many people in each population base represent one case.
I'm also showing what percent of each population base is infected at this time.
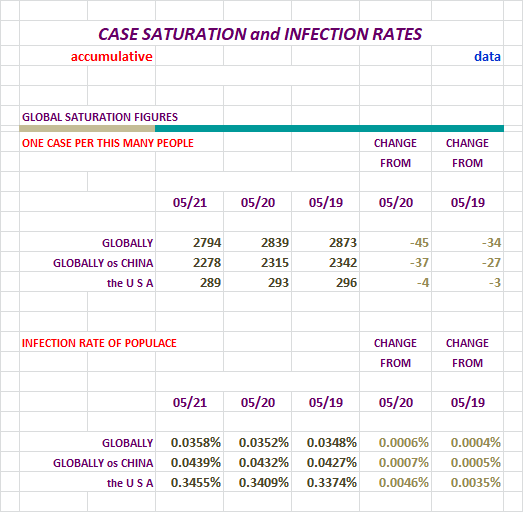
Not liking the trend here for us. I want to see our infection percentage drop.
Nations With Lots of Cases
At the end of the day yesterday, there were:

That's a whole lot of nations there. With over 1,000 in each one, we know
that over time they are potential declared cases time-bombs.
Right now in the Global scene, some of these nations are going exponential.
It's sad to see. Sadly, those folks can infect other nations too depening on
how things are handled. Other nations need to stay on top of things,
including our own.
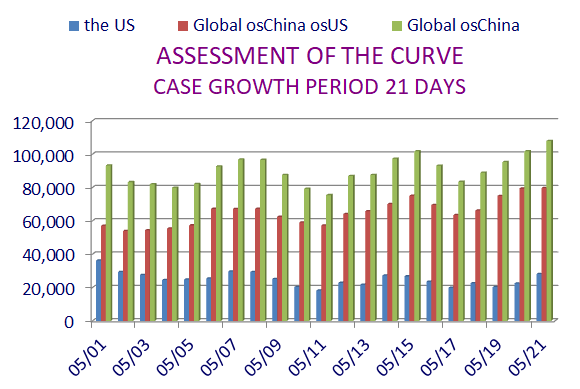
Daily Case Report Evaluation
I'll be keeping tabs on the daily tallies for days of the week for a while. Folks have
noticed some patterns of larger and smaller data entry on certain days, and on Fridays
sometimes the numbers get noticeably larger because of it.
And we now know Thursdays have potential to break out also. Yikes!
Let's check out the numbers and a chart.
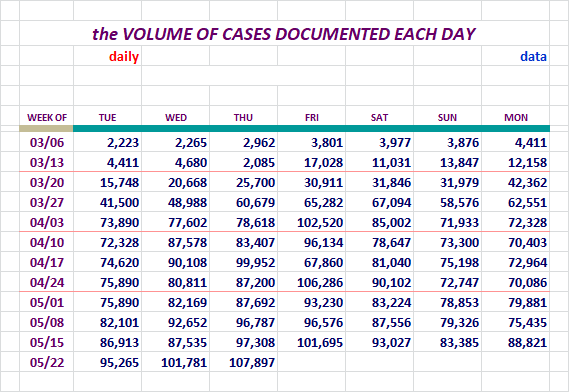
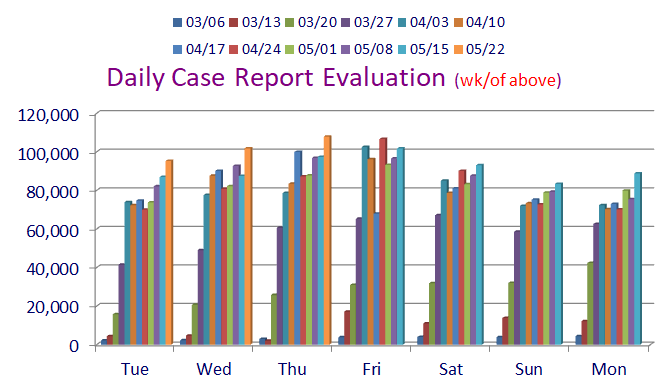
Look at the last column on the right of each grouping since last Friday a
week ago. That was the last day not to have set a record for the day of
the week Six days now and counting, we've been hitting record marks.
Not liking this one bit. I'd like to see everyone winding down.
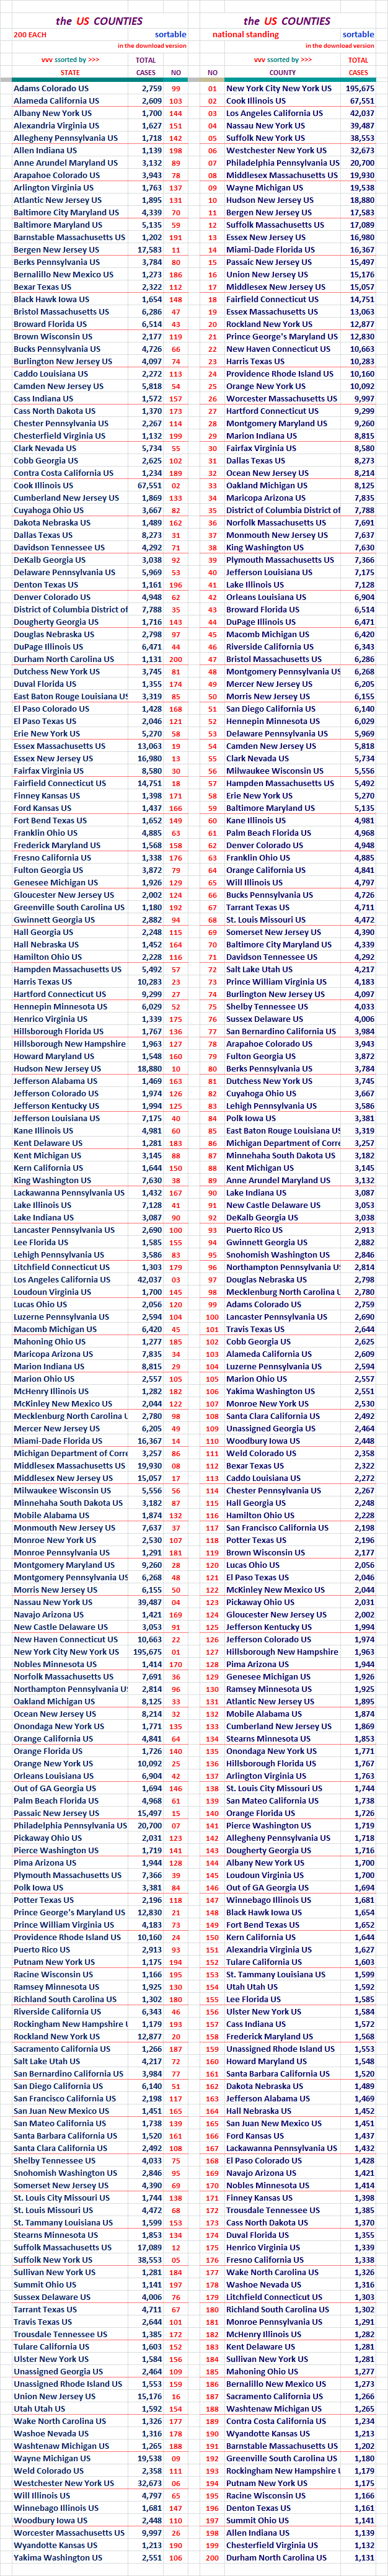
Section: 07
The Top 200 Counties in the U. S., by Number of Cases
This little report lists 200 Counties in the United States in declining Case numbers.
There is also a listing that is alphabetical. This report list only the entities
and the number of Cases in the two different sorts.
It will also be available as a downloadable Excel file in Section 12.
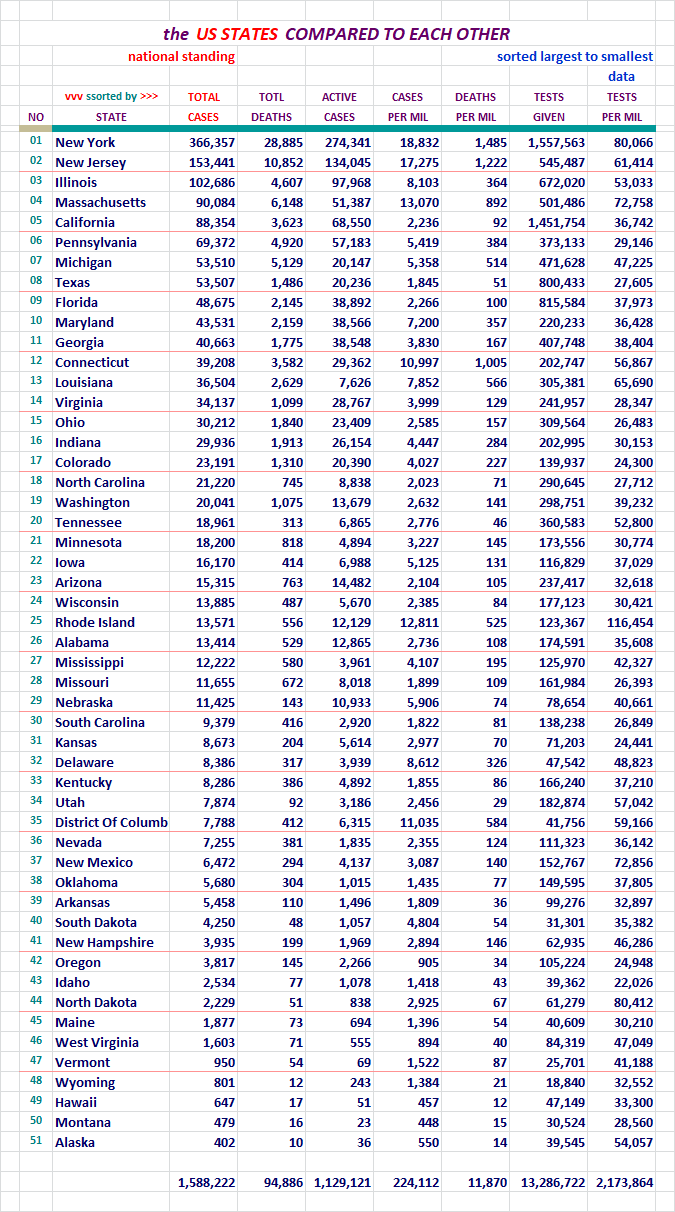
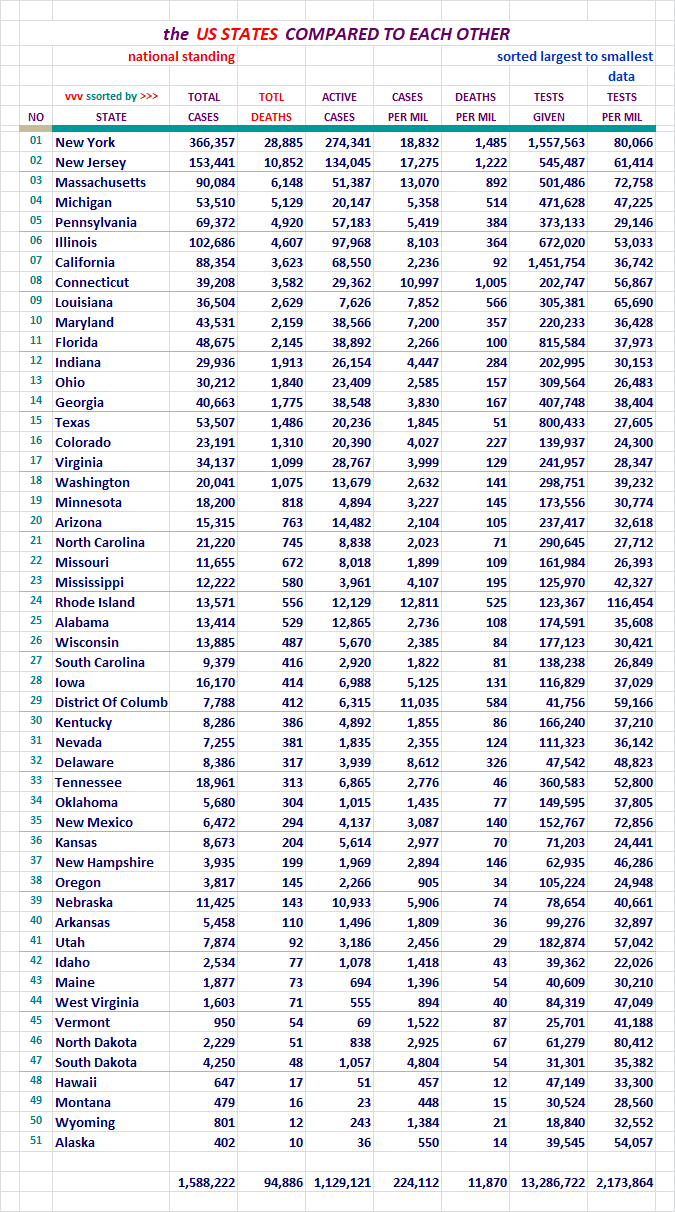
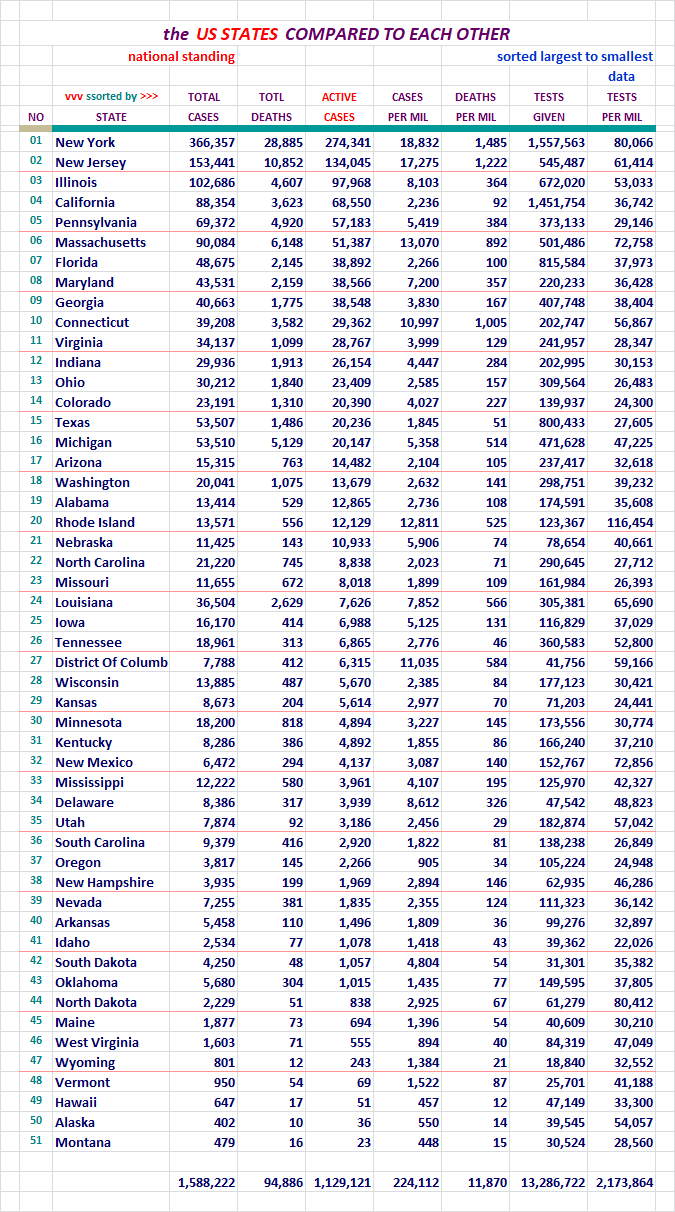
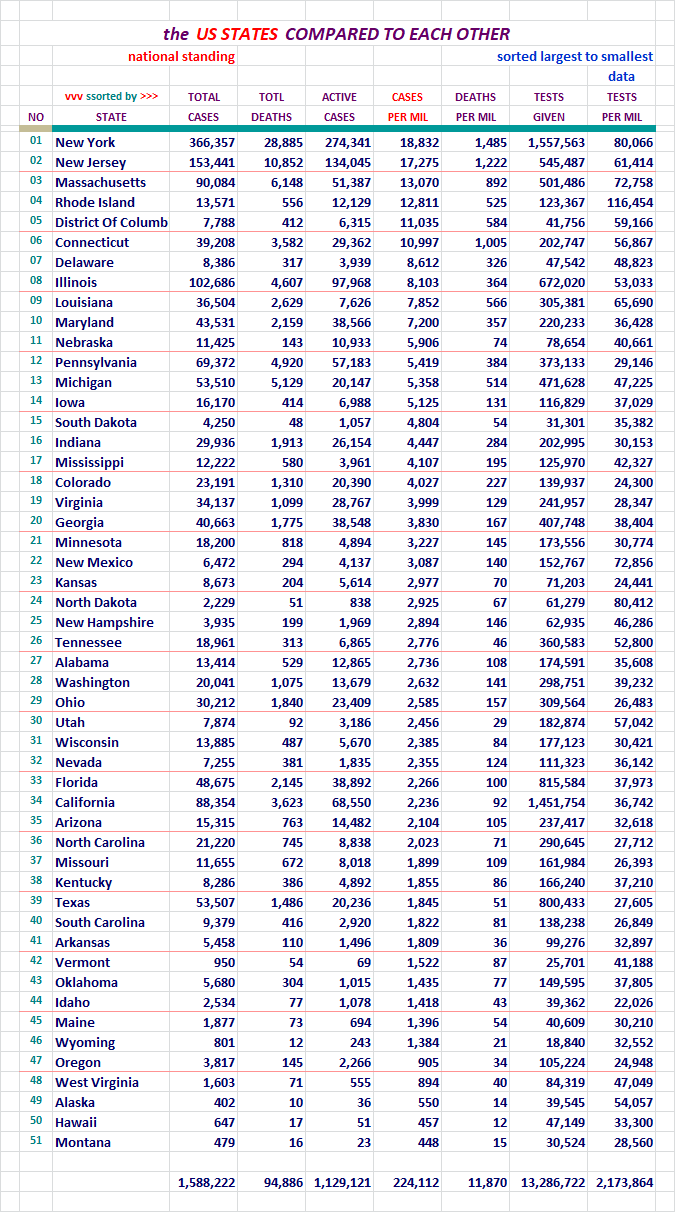
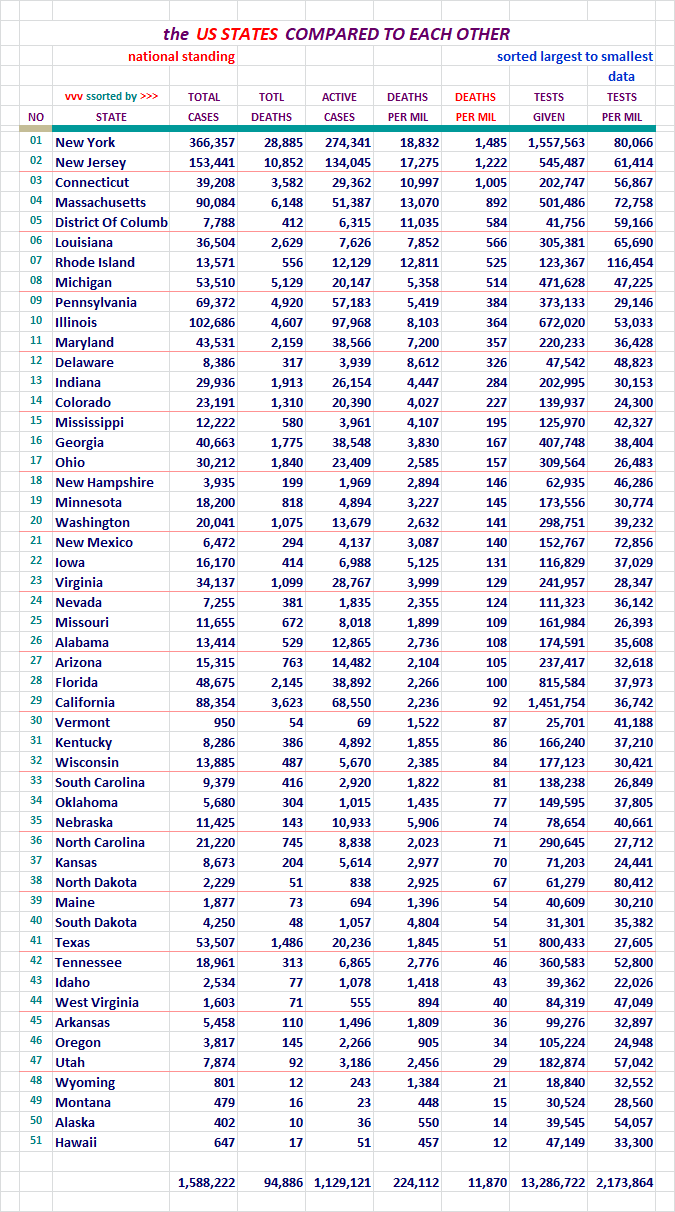
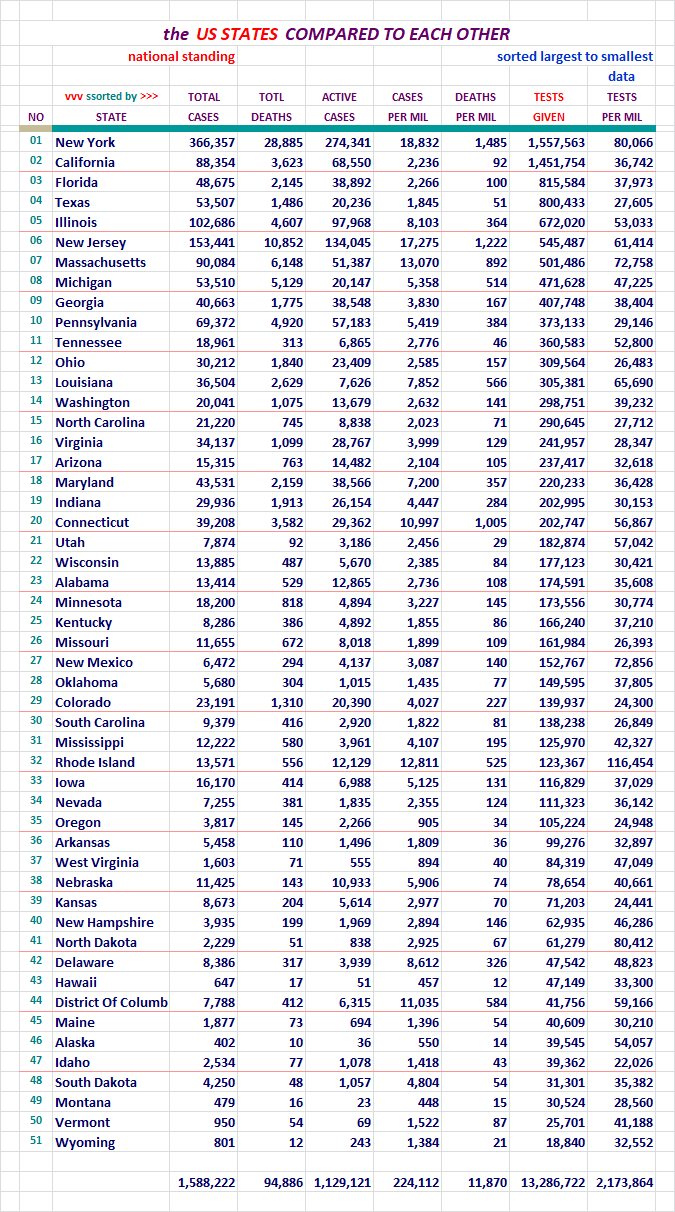
Section: 08
States of the Union and the District of Columbia, Compared to Each Other
Each of these pages is sorted differently. Look at the red header above
the columns to see which column was used for the sort on any given page.

For your review...
For your review...
For your review...
For your review...
For your review...
For your review...
For your review...

For your review...
For your review...
If this area interests you, please use this LINK to the source, and review
the lengthy description and explanation of it's development process.
There are two reports. The presentation above comes from the second one,
and the detailed segmented information below it, may interest you.
I'm contemplating moving these numbers under the states on the Alphabetical
list. The states and these entity's numbers should be combined to match
that of the U. S. figures each day. I'm kind of short changing these
states in that one alphabetical list, I'll be able to combine the numbers
so that folks can evaluate things better.
I may change it. I may not. Thinking...
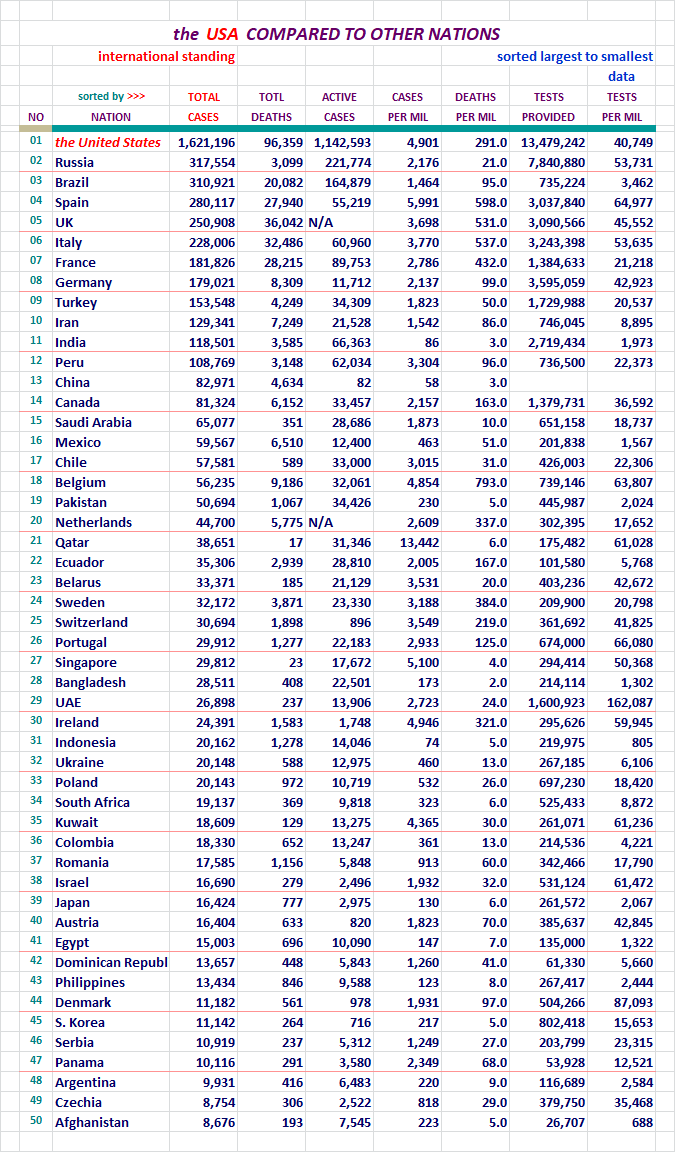
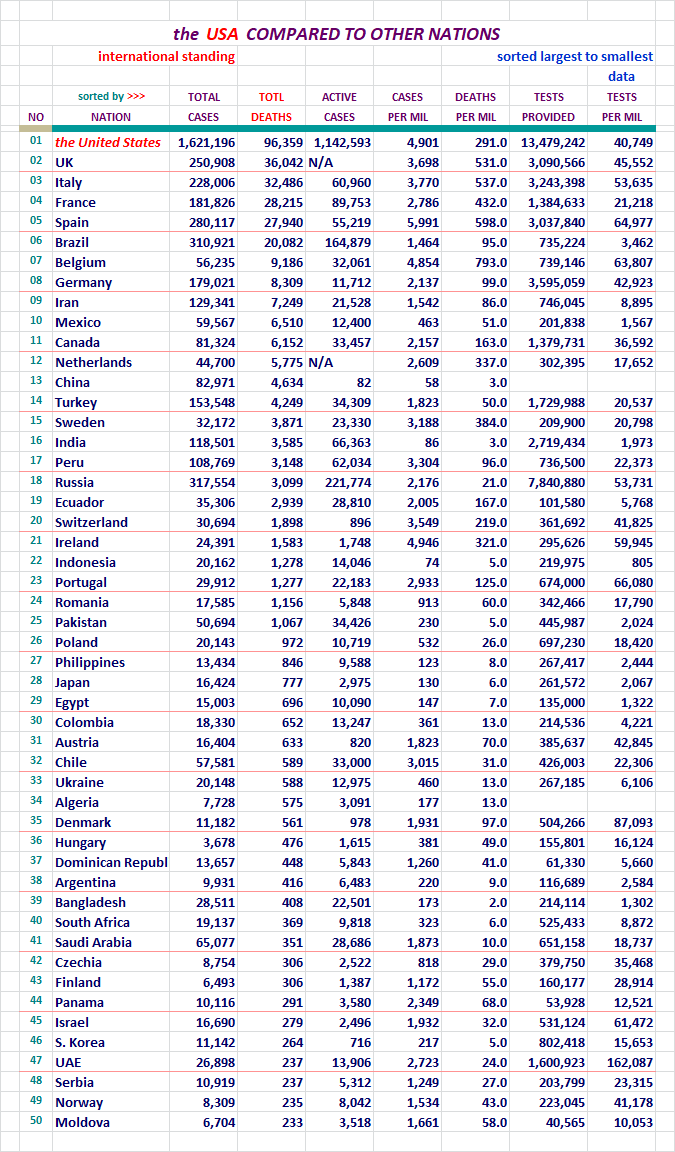
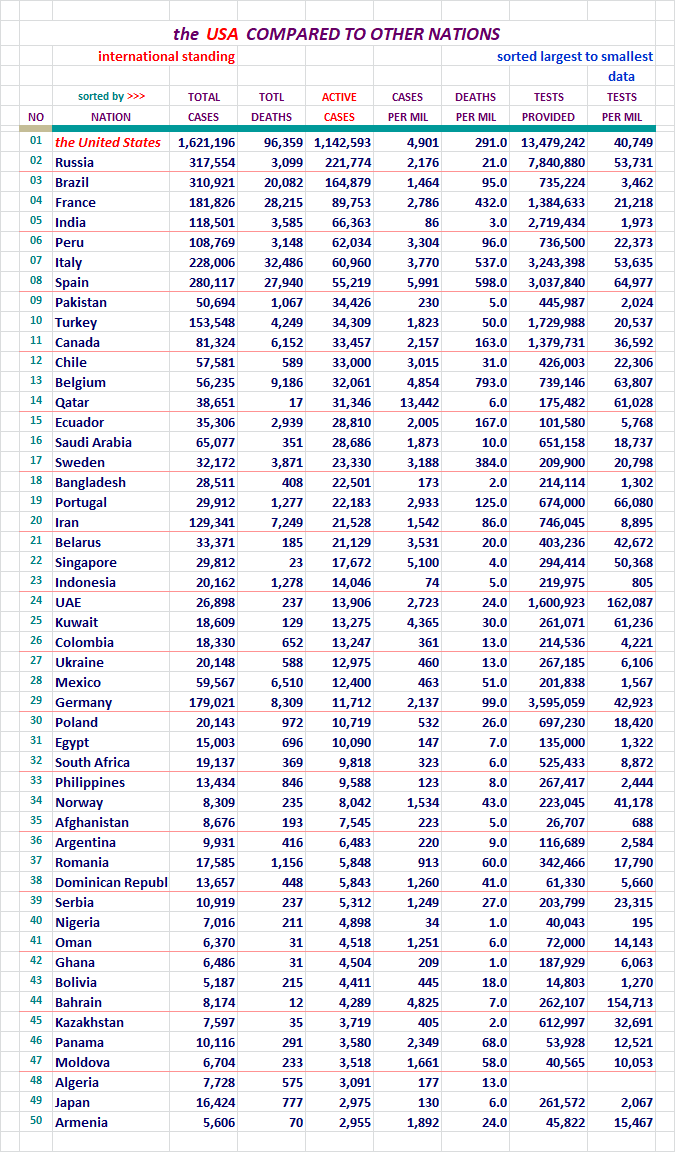
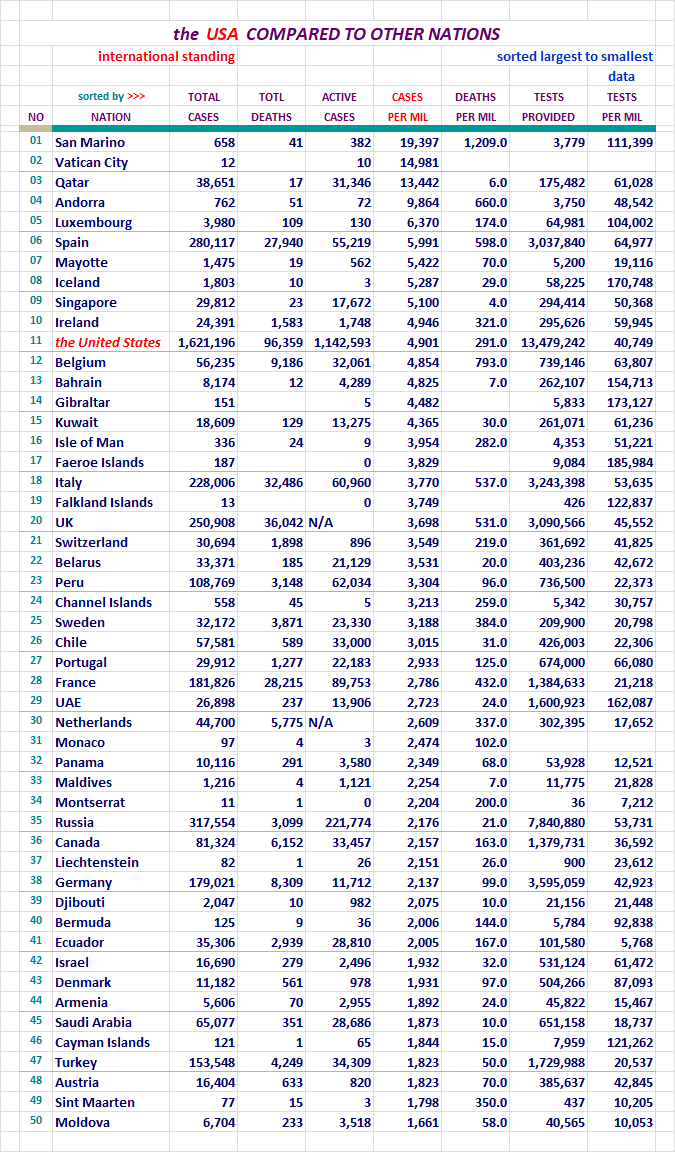
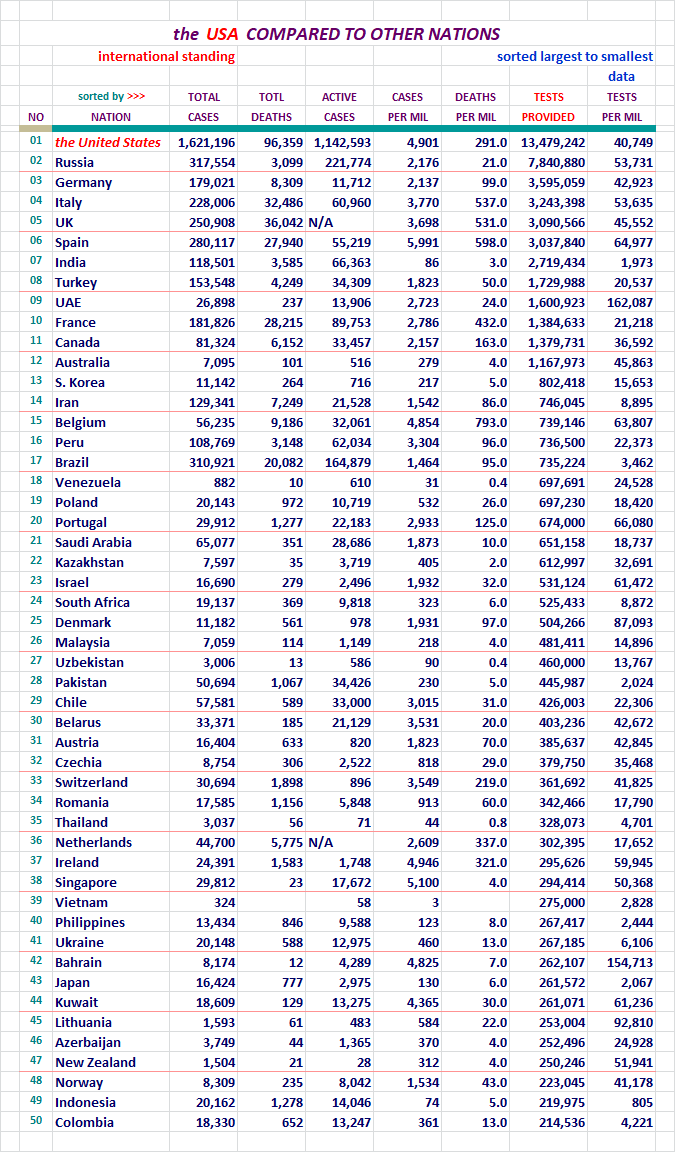
Section: 09
The United States, Where it Ranks With Other Nations?
Each of these pages is sorted differently. Look at the red header above
the columns to see which column was used for the sort on any given page.
The U. S. will be highlighted red here so we can find it easily in the list.
There was 215 nations on this list last night now. I didn't want to post
seven lists with 215 nations on it, so I picked the top 50. Coincidentally,
one report category had the U. S. at 41st, so it wasn't showing up on the
list with the 31 top nations on it. That wasn't the reason why I extended the
list length, but it did work out well.
I work on the nations right next to the states on my spreadsheet. The
states with the District of Columbia come in at a total of 51 lines.
I decided to keep the international reports near that length, and 50
was good enough.
Here we go... for your review.
For your review...
For your review...
For your review...
For your review...

For your review...
For your review...
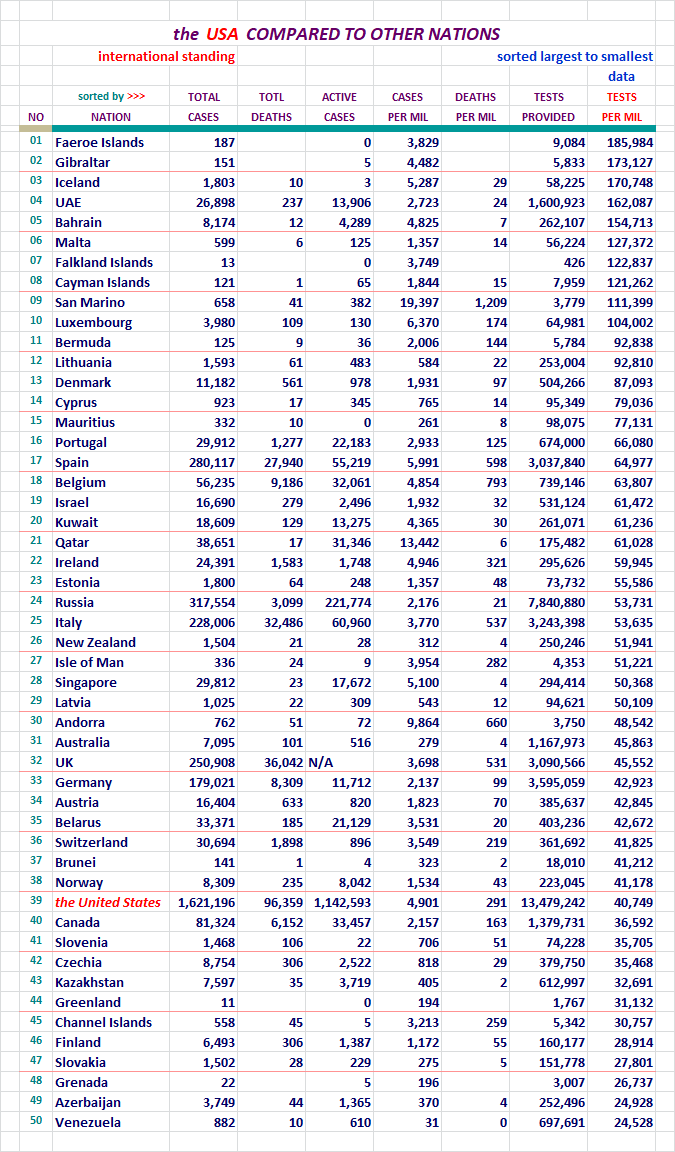
We're back home in the 39th slot. There was a reporting error that tossed
everything on it's head yesterday.
Section: 10
Here is what it is all about. From January 20th to the present.
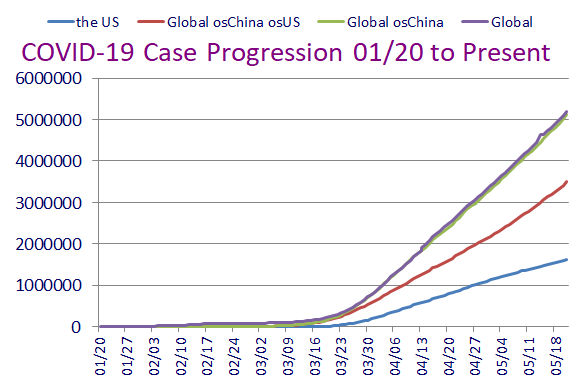
This concludes our look back at yesterday's data. Take care...

Section: 11
Data for this Report Sourced From:
LINK WorldoMeters
LINK Johns Hopkins University
The Center for Systems Science and Engineering (CSSE)
LINK United States Center for Disease Control - Provisional Numbers
Listed in the order of current utilization...
LINK You are Invited to Review My COVID-19 Spreadsheet (XLSX)
There is not an XLS version available for distribution at this time.
Section: 12
Other Features:
LINK US Counties200, States & DC51, Territories & Other Entities11, Nations214,
and the CDC Provisional Counts53
Five Excel Spreadsheet datasets you can sort for your own studies...
Section: 13
Links to other resources:
I cannot vouch for these sites. Please use your own judgement.
LINK Adventist Health Coronavirus Resource Hub - Scroll down for useful info
LINK Antibiotic Vitamin, the (Vitamin D)
Good article on Vitamin D's likely role in prevention of infection. Thanks Blam.
LINK CDC Data for Download - Scroll down - Excel required. Includes death stats.
LINK CDC National Center for Health Services
Provisional deaths as determined by review of vital documents. Much lower...
LINK CDC Secondary Data and Statistics - Portal Entry / Look around
LINK Coronavirus (COVID-19) Map
LINK Coronavirus infection risk may be reduced by Vitamin D
by Former CDC Chief Dr. Tom Frieden
LINK Coronavirus Spread Quickly Around the World in Late 2019, Study Shows
the University College London Genetics Institute
LINK COVID-19 Deaths Broken Out by Thirds, 05/07/20 Map of US Counties
Very revealing display of Concentrated Death Zones - thanks hoosiermama
LINK COVID-19 First U.S. Case, Treatment, features Remdesivir
New England Journal of Medicine article
LINK Cytokine Storm, med Actemra, Physician near death saved
LINK Diamond Princess Review at 634 Case Point of Eventual 712
LINK Hydroxychloroquine Article: International Poll
Daily Mail Reports, Most Effective Treatment According to 6,000 Physicians
LINK Hydroxychloroquine Has about 90 Percent Chance of Helping COVID-19 Patients
the Association of American Physicians and Surgeons, reports 91.6% of patients improved clinically
LINK IHME - Institute for Health Matrix and Evaluation
LINK National Institutes of Health - Cornavirus (COVID-19)
LINK Nasal Irrigation is the Key, COVID-19 Related
LINK New York City - interesting breakdown, borough, age, sex
LINK On the Origin of CCP Virus, A Documentary Movie (turn up the sound)
Epoch Times: I highly recommend this very well documented report.
LINK Rt COVID-19
Calculates and displays the Rt Factor for each state. Thanks FreedomPoster.
LINK World Health Organization

since we know the agenda of the Left is to have the reported cases come in as high as possible and since we have already seen several States drop the number of deaths by as much as 25% (Colorado is one) and since even Birx has stated the death count is 25% higher than it really is and that she doesn’t have faith in anything coming from the CDC I believe a strong disclaimer ought to preface the reporting of what is becoming an ever increasingly Armageddon report.
Deaths should be more accurately reported by being broken out as those who died EXCLUSIVELY from CHINA VIRUS and those who had co morbidity conditions which may have been exacerbated by the China Virus.
“an ever increasingly Armageddon report”
Total number of “cases” is not greatly important, anymore than is the total number of cases of the seasonal flu, in as much in both cases MOST 80-90+% either have little reaction, a mild reaction, a mild illness, or an illness they recover from in the hospital. Same as with the flu.
The ONLY important numbers are hospitalizations and deaths.
Both are higher this first year of the Wuhan Virus because the medical community is still finalizing the best medical responses to the Wuhan Virus, and they are improving steadily every week.
Already it is clear the hospital system is NOT overwhelmed,
What that means it is now handling the current hospitalization case load without being overwhelmed.
As the number of known cases increases with testing, the death rate per X number of people declines.
NOTHING in it all is “Armageddon”.
The real problem isn’t “deaths”, it’s “active cases”.
All new + PCR tests become a “case”. What is unknown is, how many “new cases” are actually long-term asymptomatic persons with IgG antibody, i.e., non-infectious but persistently or intermittently PCR +?
Korea calls the latter ones “re-positives”, and has nicely demonstrated that they are not infectious.
This has HUGE implications for containment. How much of the increase in “cases” is due to more PCR testing (finding non-infectious people) and how much is due to spread of infection occurring right now?
The fact is, we don’t know.
I need your help. You’ve been navigating the JH data for some weeks now. I got lost in their web pages for the Covid-19 maps/data this morning.
I am trying to get their raw U.S. data for all the U.S. counties. I’d prefer if you can lead me to your JH source table(s) than to have to get it second hand from you. I am guessing maybe???? they have more than just 200 of the U.S. counties. I want to crunch some numbers myself. Thanks in advance.
Yesterday, there was a posting on FR that Belgium was counting anyone who died in a nursing home as a covid death.
I have been watching Belgium for some time and could not understand why Belgium was reporting 800 deaths per million while their neighbor Germany was reporting 100 deaths per million.
On May 17th WAPO came to Belgium’s rescue with the claim that Belgium might actually be the most accurate.
We need to keep in mind the Brussels, Belgium is the capital of the EU so it could be conjectured that Belgium is setting the ‘tone’ for the rest of the EU to make covid worse than it is and use that ‘made up fact’ as the basis for totally removing any remnant of free enterprise from Europe.
“””Belgian officials have sought to tamp down concern by suggesting their chart-topping numbers are products of their accounting methods and commitment to capturing an accurate picture of their outbreak. Other ways of estimating virus-related deaths suggest that the Belgian method might indeed turn out to be among the most accurate in the world, and that other countries may be significantly undercounting their death tolls.”””
I think that’s an excellent analysis. The graphs show that despite the continued progression of the disease through the population at a steady rate, the medical profession now knows much more about treating it. And I expect continued reduction in the mortality rates. In fact, if we could get politics out of medicine, we would find that this is actually a very treatable disease.
One other item that appears, and which is disappointing, is that while warm weather may be helping against the spread, it’s not tamping it down the way seasonal colds and flu normally do. It appears we are going to be at this steady state, or slow decline, most of the summer.
“One other item that appears, and which is disappointing, is that while warm weather may be helping against the spread, it’s not tamping it down the way seasonal colds and flu normally do. It appears we are going to be at this steady state, or slow decline, most of the summer.”
Time will tell of course.
The overall tone of the report is gloom and doom which mirrors the media reporting.
States are opening up left right and center and more and more people are effectively saying to their local and State Gov “GFY”
Not saying the report shouldn’t be offered as it is but only that a disclaimer be issued stating the numbers of deaths attributable to China Virus is questionable at best.
Regarding the CDC provisional death numbers.
As we all know the CDC Provisional death numbers are those deaths that have been processed when the death certificate is completed, submitted to NCHS and processed for reporting purposes. This delay can range from 1 week to 8 weeks or more.
As a result of the time lag, the CDC provisional death numbers as of May 21 are 71,339 versus the worldometer death numbers are 96,385 as of May 21.
https://data.cdc.gov/NCHS/Provisional-COVID-19-Death-Counts-by-Week-Ending-D/r8kw-7aab
In order to test the ‘time lag’ I looked at the cumulative deaths reported in the CDC provisionals as of April 25, 2020. As of April 25 the CDC provisional death number was 54529.
On April 25, 2020 WORLDOMETER reported 54265 deaths.
Thus, it certainly appears Worldometer is accurately collecting covid death data each day.
If you can do better, have at it.
If you just show up to correct me, get lost.
If you had paid attention to the report, you would know that I reference the numbers of death being iffy, and direct folks to the CDC Provisional numbers in several places.
Most folks here are not dumber than you are. They are aware of the situation.
By the way bright guy, exactly where is the good news when documenting severe illness and death? Duh!
I provide an in-house resource. I collect data and present it here.
If this is too much for you, you don’t like it, or you think I’m doing good it all wrong, too bad. I decide what and how I present what I present here.
“By the way bright guy, exactly where is the good news when documenting severe illness and death? Duh!”
Depends. In this particular case the good news is in the fact that close to 40%+ of all deaths occurred in Nursing Homes and the average age of those dying is well over 70 yrs And hige majority having multiple underlying health issues. It is good news in the sense it clearly shows the over reaction in locking us down as a Nation which in turn makes it much easier to open us back up. Good is relative and considering the gloom and doom we were subject to day in and day out (panic porn) what I mentioned is good news.
BTW, you’re way to touchy.
When you have hundreds of hours in this project, you can have input on how it’s run. You and one person other person come here to run you your mouths negatively.
I’m not here to post positive stories.
I’m here to provide what I’ve been providing, and that is all.
You’ve demonstrated you haven’t even read the full post, by your nonsensical suggestion I do what I’m already doing.
Not sorry if that frank observation puts down your five minutes of investment on this thread.
Go back to chasing cars dumb ass. There are only so many hours in the day.
Go here:
https://gisanddata.maps.arcgis.com/apps/opsdashboard/index.html#/bda7594740fd40299423467b48e9ecf6
You will see a list of nations on the Left.
Down below you will see three tabs.
The third tab on the right is the one that displays the
Counties. I’m not aware of any other provision there for
counties, but who knows.
I do know in this location they limit it to 200. I’ve not
nosed around to see if I could find more.
Humidity is important also.
Breathing in hot humid air is supposed to really do a number
on it. At least that’s what I’ve read.
I have no idea what our capacity for hot air is, until it
starts to be a problem.
If I had access to a sauna, I’d be spending some time there.
Seems as if you have a serious and negative self image. You take what I say as a personal attack. It is not.
Btw, thel volume of work does not equate in any way with its accuracy.
Perhaps counciling in anger management is in order.
LOL
You come on the thread and spout off about what I need to do.
But of course I have the problem, and you don’t.
Perhaps you are the one who needs some medical help.
There’s a solution to your problem. Stay off my thread.
You don’t get to dictate what I do. Got it?
Nah, you don’t have an anger problem, not you.
And here I thought I was going easy on you.
There’s a reason why your daily massive and repetitive info dump gets limited responses. Perhaps you can figure out why.
Look back on your first post on this thread.
Then tell me you don’t have issues.
You’re like a classic walking case of projection.
Disclaimer: Opinions posted on Free Republic are those of the individual posters and do not necessarily represent the opinion of Free Republic or its management. All materials posted herein are protected by copyright law and the exemption for fair use of copyrighted works.