Posted on 05/26/2020 3:01:56 AM PDT by DoughtyOne
PING LIST - Please contact me as needed...
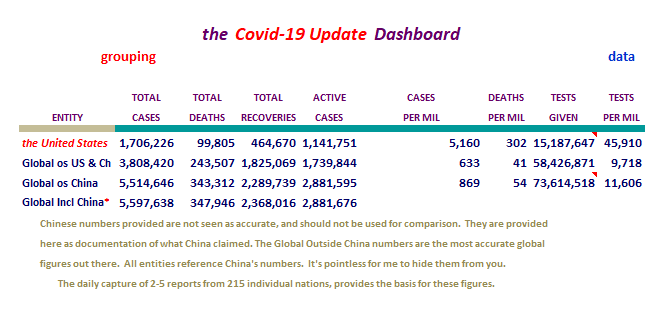
COVID-19 Update # 69
As of 05/25/2020 23:15 PDST United States CDC - Provisional Numbers
As of 00/00/2020 23:45 PDST Johns Hopkins University - Capture Nations Informaton
As of 00/00/2020 23:45 PDST Johns Hopkins University - Capture Counties Information
As of 00/00/2020 23:46 PDST Johns Hopkins University - Process JHU Data
As of 00/00/2020 23:59 PDST WorldofMeters - Document Core Numbers
As of 00/00/2020 23:59 PDST WorldofMeters - Capture Nations Information
As of 00/00/2020 23:59 PDST WorldofMeters - Capture States Information
As of 00/00/2020 00:00 PDST WorldofMeters - Data Processing begins...
As of 00/00/2020 ??:?? PDST Publish COVID-19 Update - 00/00/00
Thank you for stopping by to check out the COVID-19 Update.
Here you can find...
Section: 01 Commentary, Special Reports, COVID-19 Update Info, & System Notes
Section: 02 the United States Situation
Section: 03 the Global Community Situation Outside China
Section: 04 the Global Community Situation Including China with reservations
Section: 05 the Mortality Report
Section: 06 Miscellaneous Reports of Interest
Section: 07 the United States, Counties (alphabetical / case no descending)
Section: 08 the United States, States Ranking, Provisional Numbers, & Territories
Section: 09 the United States, Ranked with Other Nations
Section: 10 the End of this COVID-19 Update
Section: 11 Data Sources and a Link to My Own Spreadsheet
Section: 12 Linked Spreadsheet: Counties, States, Provisional, Territories, & Nations
Section: 13 Links to Other Resources
Section: 01
Commentary, Special Reports, and COVID-19 Update Information2
Interesting Tid-bits (hopefully)
Yesterday's Summary in a Nutshell
Before I present the numbers, we need to acknowledge this was a holiday
Monday. The figures could be compared to a low report day, a Sunday or
a normal low count Monday, only worse.
That isn't said to lament the low numbers. It is an attempt to recognize a
failure to provide a level reporting proces.
Don't use these types of days to develop an opinion about where we are headed.
They aren't indicative of a normal count.
On the Global scene yesterday, it was the first day in ten days, that there
wasn't a reord of New Cases reported for the day. At 88,429 this brought
our string of ten record days to an end. The records have been the high
counts for the day of the week. Yesterday, the Global scene failed to set a
daily record by just 392 New Cases short of the Monday record of 88,821 cases.
Our numbers of New Cases came in at 19,790, That number was up 72 cases
from the day before.
On the global scene, the Fatalities reported out were very low at 1,172. That
compares favorably with the 2,745 the day before, and the 3,954 the day before
that. This was Memorial Day though.
Our Fatalities came in at 505. Sunday's 617 was the lowest day since March 29th, when there were 259 New Cases announced. And yes, that was a Sunday. It was
eight Sundays ago. Well, we came in under that 617 yesterday.
Sadly, today's numbers should bounce back. Too bad...

Section: 02
The Following Addresses the Numbers Here in
the United Staetes of America
Here we go...
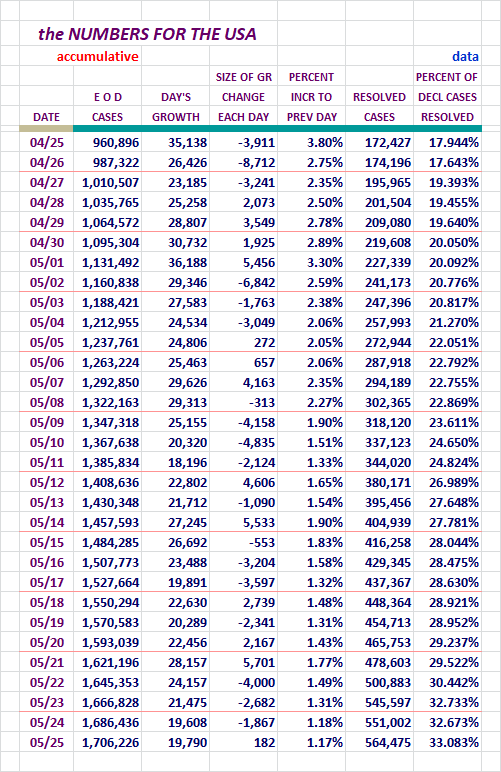
Our New Case numbers continued to remain low. Yesterday was Memorial Day, but over the last week we were significantly under prior weeks Charts are picking that
up.
Concept of adding in Active Cases and Serious Critical here, courtesy of amorphous
Here are more of our numbers...
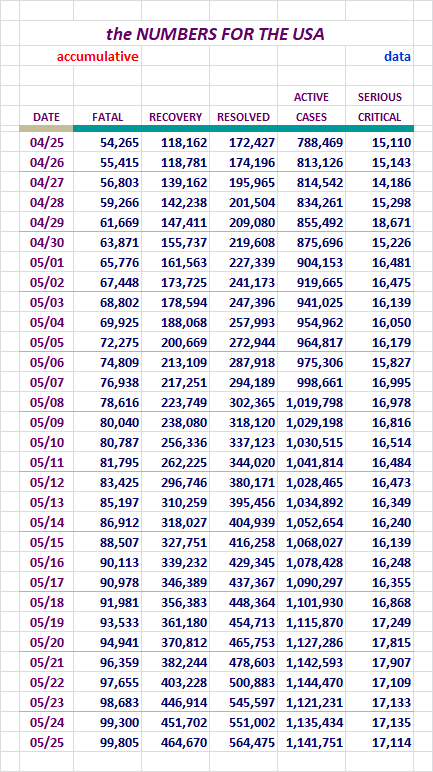
Fatalities went even lower for us. We'll be able to see them better down
below in the Mortality Section: 05.
Our Recoveries and Resolved Cases were about normal.
Our Slice of the COVID-19 Pie
The growth of our slice of the pie has been dropping recently.
Here are the numbers I've been tracking, Globally Declared and Active Cases.
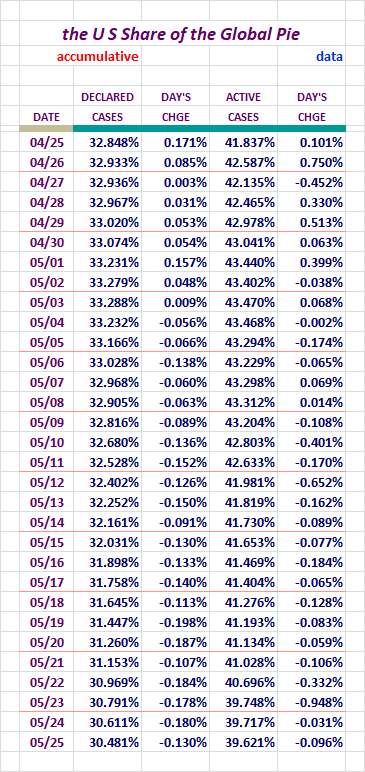
This was a low end day on our shrinking slice of the Global pie.
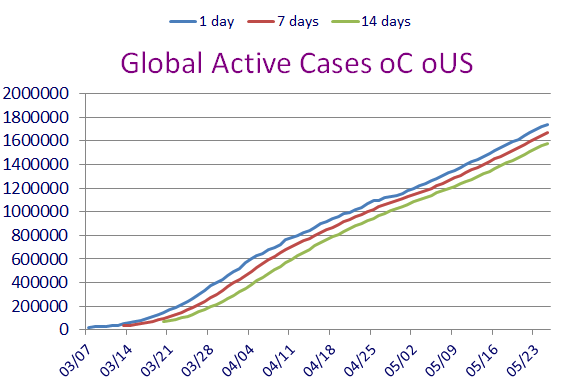
Active Cases in the United States / Chart
Unlike some of the other charts here, we should see a good rise and
fall at some point withone.
Note that this presents the one day and then 7 and 14 day averaging versions.
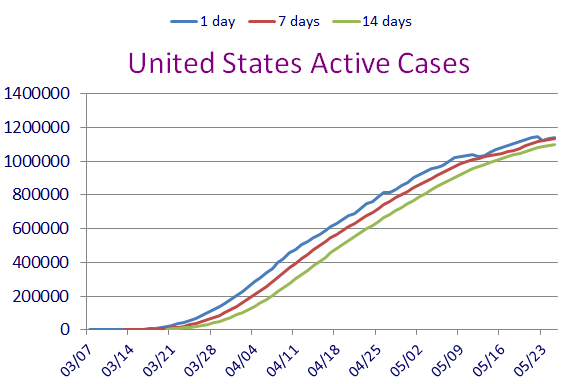
Remember, these are not new Declared Cases. These are remaing Active Cases.
All three indicators here were pointing to a flattening out of remaining Active
Cases.
The numbers from yesterday's additional pleasant surprise, helped a lot again.
Testing and New Case Figures
Requested by stocksthatgoup
Some folks have shown an interest in seeing the COVID-19 Test figures compared
to the New Cases being declared. This following Data addresses that.
I went back as far as I could in my records. I plan on keeping a running
30 day display here, with the Chart starting on 04/21 & 04/23 ongoing.
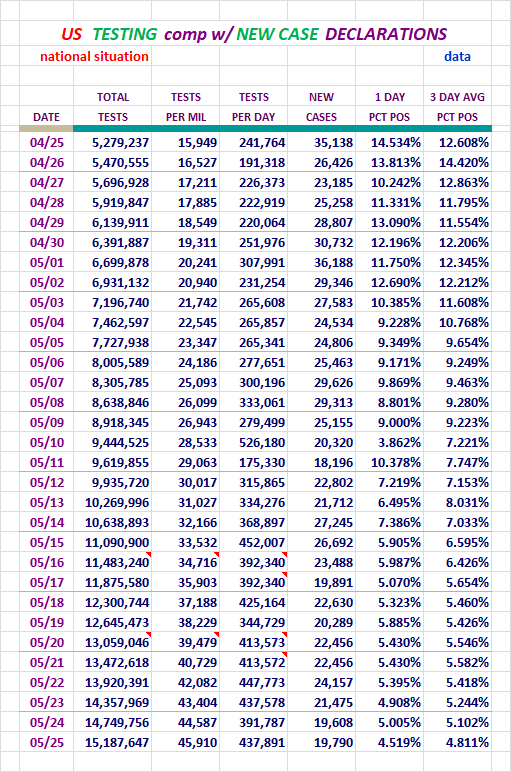
You can see how the Declared Cases to Testing percentage has gone down over
time. Yesterday was a strange reporting day, so I won't make much out of the numbers.
Here is a chart to reveal visually what the decline has looked like.
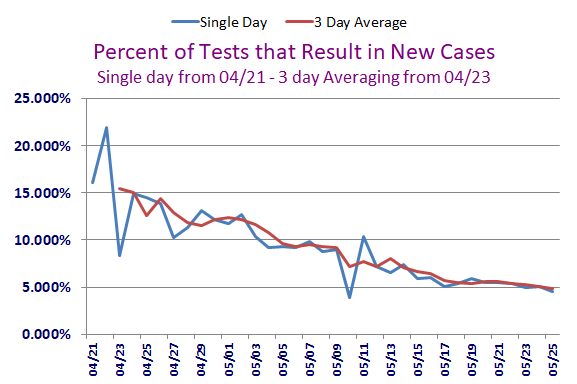
Folks can determine for themselves just how New Cases are affected by the
Testing.
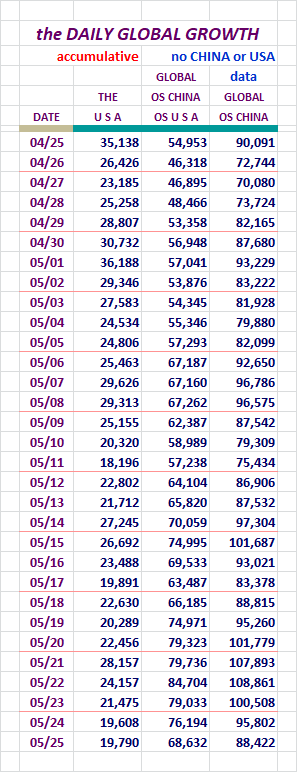
Section: 03
The Following Addresses the Global Numbers
without Mainland China
Here is the first set of Data for the Global Outside China
Territories

The growth of new Global Cases outside China is not going well. Those
nations we've been tracking with over 1,000 cases each, there are 110 of them
now, and some of them are growing exponentially.
Yesterday there were 16 nations with declarations of New Cases over 1,000 per
day. Some days there have been more. Low reporting plays with these numbers.
Look to the new presentation at the bottom of this Section, to see what nations
are putting out the big numbers right now.
We are still pulling in more Cases per day, but Brazil is taking a run at our
figures. They've beaten us a couple of times on Fatalities per day.
Fatalities, Recoveries, Resolved, Active Cases, and
Serious/Critical Cases - Globally, Excluding M/L China
Concept of adding in Active Cases and
Serious/Critical here, courtesy of amorphous
Here we go...
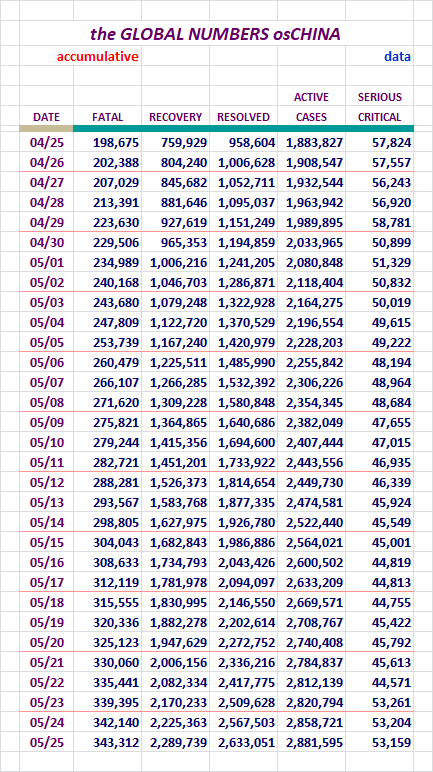
Again, I don't believe there is anything unusual here today.
How is the Global Community Outside China Doing,
Without U. S. numbers?
Well, a little better yesterday...
It is nice to see that middle number lower away from those big highs we've
seen recently. Sadly, I think this was likely reporting related. (clerical)
So now I'm expecting to see today be considerably higher. Maybe not, we'll see.
Look at the massive humbers the Global community has been hitting over the
last ten days or so.
Look at our blue field compared to the Global red field.
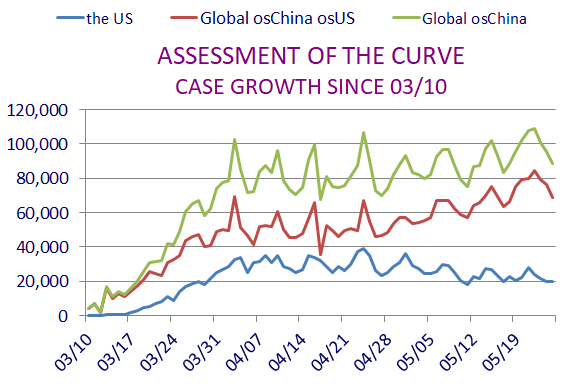
Our day was very decent, but Globally outside China, things are still hot.
It's not looking good. Check out the direction of those red lines above.
It's fitting that Excel chose red for them.
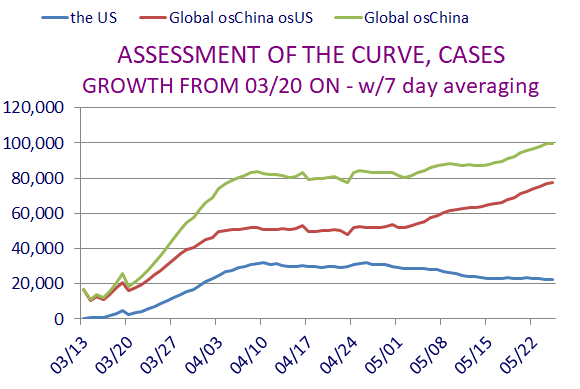
The Active Cases outside China Globally / Chart
As in the U. S. version of this, we should see a good rise and fall at
some point these two.
Note that these present the one day and then 7 and 14 day averaging versions.
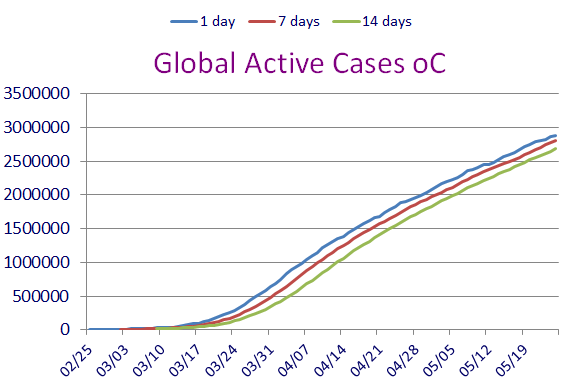
Remember, these are not new declared Cases. These are remaing active cases.
If you look closely at that last one, it shows that just when things looked
ready to flatten out, new nations caught fire with COVID-19, and up went the
count of Cases again.
Special Section on France, Germany, Italy, Spain, and the U. K.
Case growth.
Let's Look at Some Numbers in Five Day Increments:
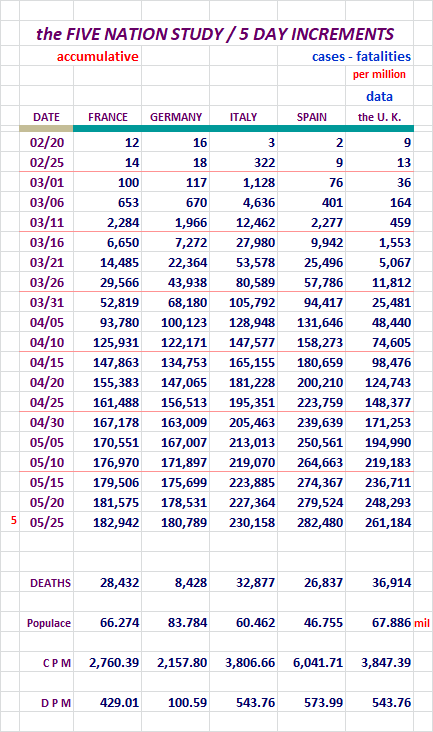
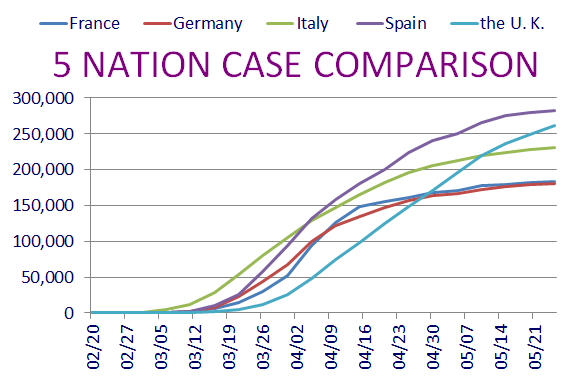
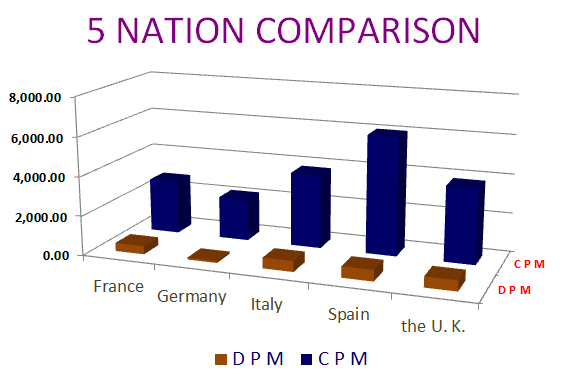
The same comments fit for about each day here.
The chart of Cases, causes the perception that it is in conflict with the
second chart below it. Actually it isn't. It is depicting raw numbers
of New Cases. Down below the chart addresses per million numbers.
They appear to skew, but everything is accurate here.
Sweden and It's Neighbors, Who Has the Best Tactic Against COVID-19?
Sweden is doing its own thing with regard to isolating. I think most people
are aware of it by now.
Here are some numbers to help us look at this issue.
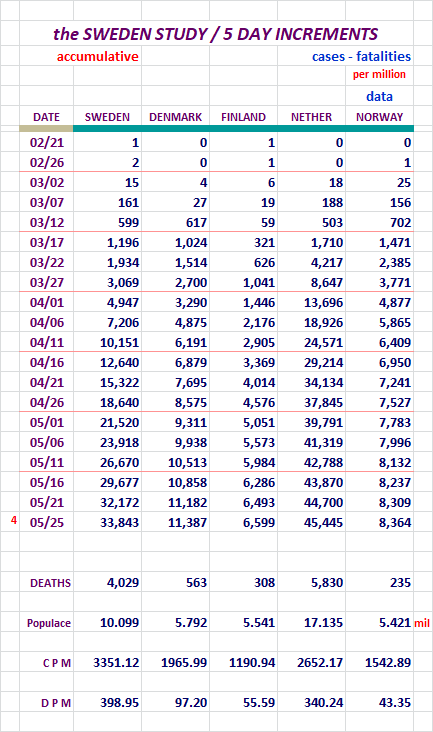
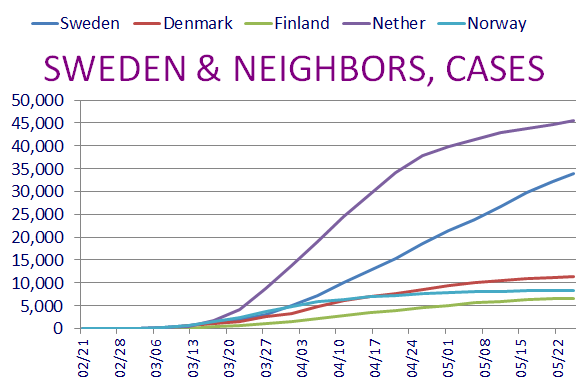

Sweden still remains a hot topic.
Movers and Shakers is a New Feature as of 05/22/2020.
I will present the top fifty nations with the most New Cases and New
Fatilities.
Here we go...
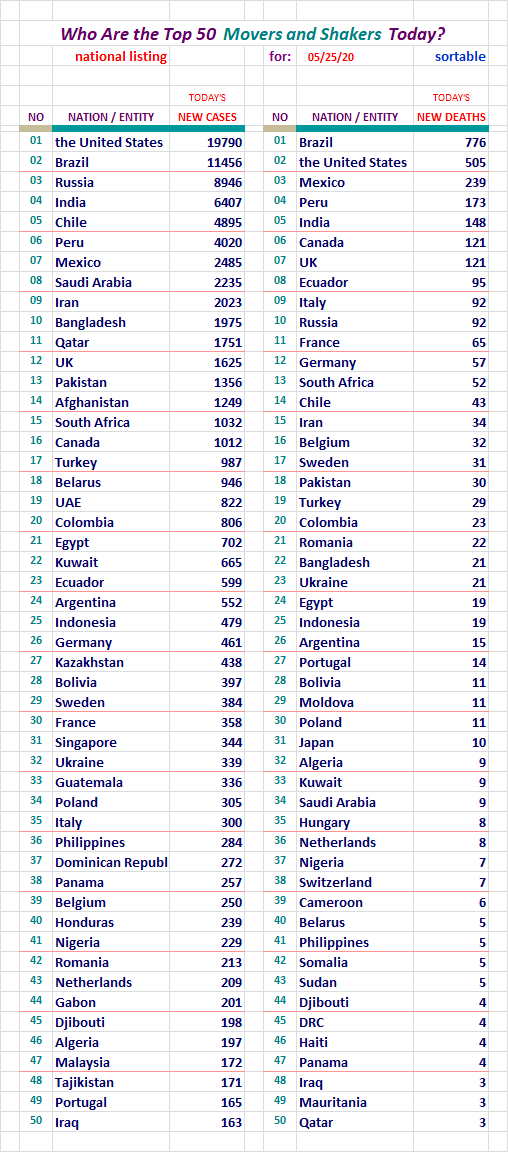
Strange lower numbers skewed this report a bit, and that made it possible
for other nations to take an even better run at our numbers.
Normalcy should return tomorrow.
Section: 04
The Following Addresses the Global Numbers
including Mainland China*
Mainland China's numbers are 0.003% of today's total global numbers.
A Look at Declared, Resolved, and Active Cases, Includes M/L China
End of day figures follow:
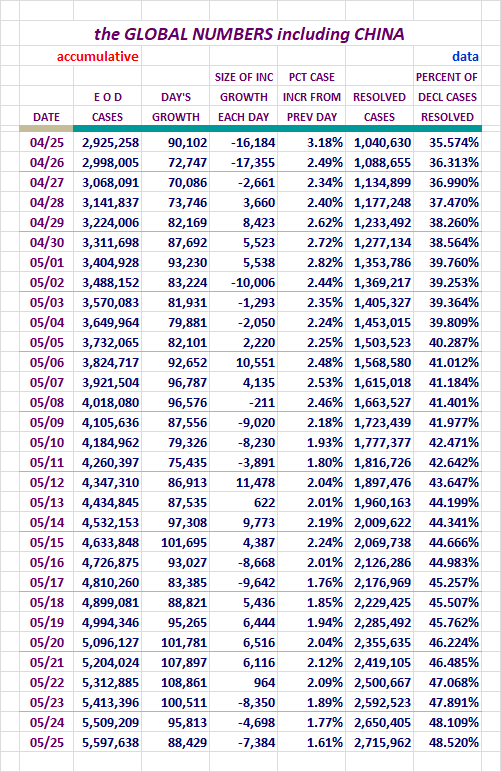
On the right that Declared Cases resolution percentage continues to grow.
Look at the increase from 04/24 to this point. Nice...
We should be at 50% by the 28th to the 30th of May. The way it has been going,
we may actually hit 50% earlier than that. We'll see.
I first presented that prediction about a week ago. It seems I gaged it about
right.
Fatalities, Recoveries, Resolved, Active, and Serious/Critical
Cases Globally, Including M/L China
Concept of adding in Active Cases and
Serious/Critical here, courtesy of amorphous
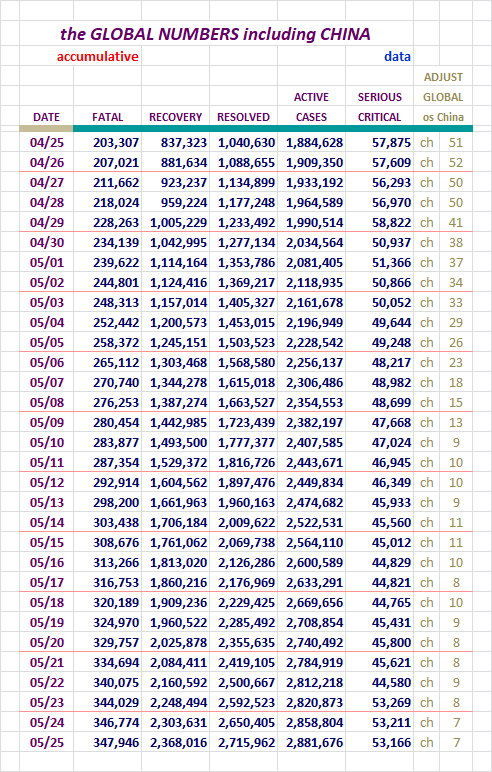
Not much to say here. Big numbers getting bigger!
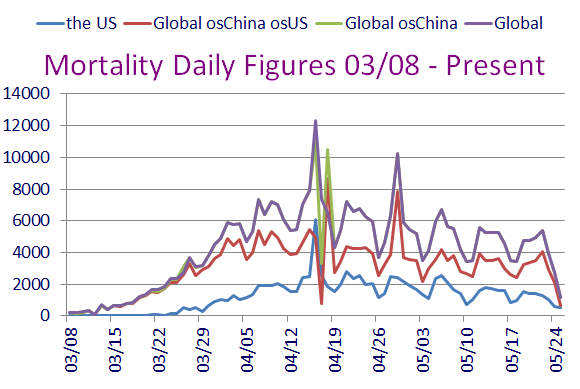
Section: 05
the Mortality Report
Our numbers are big enough that they can hide the finer nuances of the
Global numbers outside China. For that reason, I strip our numbers off
that group and report them separately for this area of study.
Here are the figures for the growing case totals for four entities.

I urge folks to review the CDC's Provisional numbers bellow. I am not touting
this count (99,805), but it's out there so I mention it. We have articles all
over the forum detailing the issues with these numbers, but we have to have
reference points.
With no numbers we'd be flying blind. It's really pretty simple. Well, to
most adults it is.
Here is the chart to go along with those figures.
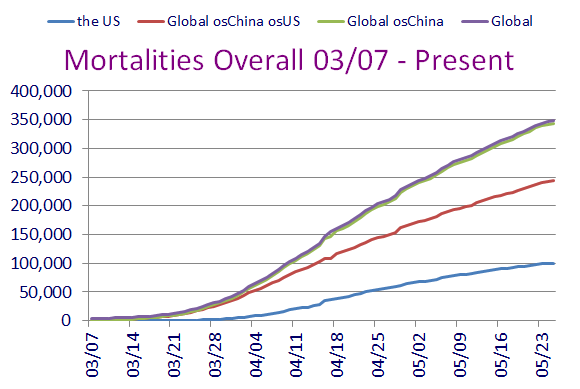
Looks pretty ominous there doesn't it.
Here are figures revealing the daily growth for those four entities.
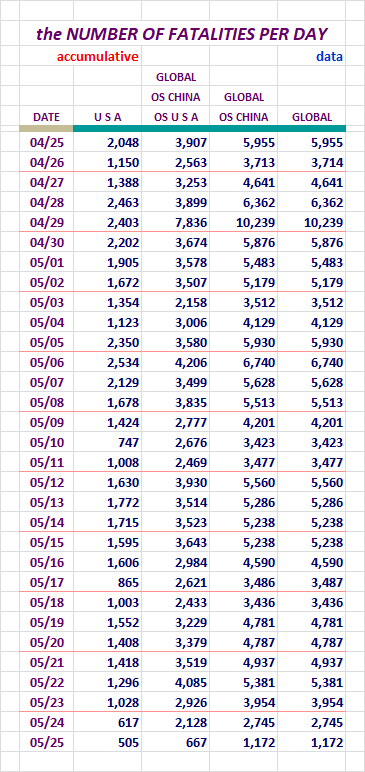
Our numbers of new Fatalities went down again yesterday, to the lowest point
in eight weeks. We beat the day before, that had accomplished that first.
There were 259 Cases that day, and yes it was also reported out on a Sunday,
March 29th. The day befor yesterday was the lowest day back to March 29th, but
then we beat that yesterday.
Holiday reporting here. We shouldn't make much of this. The lower numbers for
a couple of days were nice, but that's a temporary situation.
Here are two charts to go with the above data.
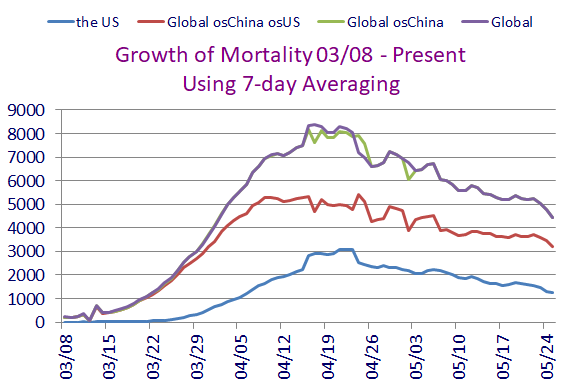
These each seem to be taking a little bounce up, then down. We'll have to
watch this one closely.
Here, let's look at data for the U. S. broken out by itself.
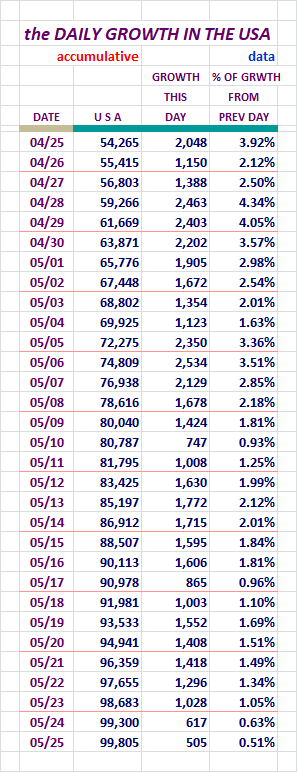
Looking back, yesterday's figure looks a lot better, even better than
Sunday's. Even in the last month we can see a lot higher days. Monday's
numbers went down nicely. Wish this was the new normal, instead of the new
abnormal.
Two back to back low numbers going back to 03/29. Nice...
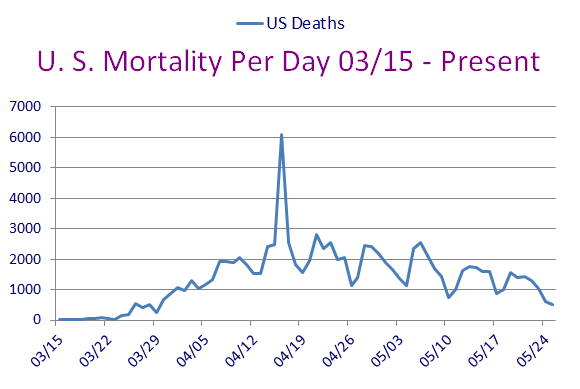
I don't think we can hold this. I like what I am seeing in the U. S.
Areas that have reopened haven't caused much to b concerned about. Let's
hope we can hold it together, even though we're certin to move up a little
after this long weekend.
Section: 06
Population Saturation
Here are figures revealing how many people in each population base represent one case.
I'm also showing what percent of each population base is infected at this time.
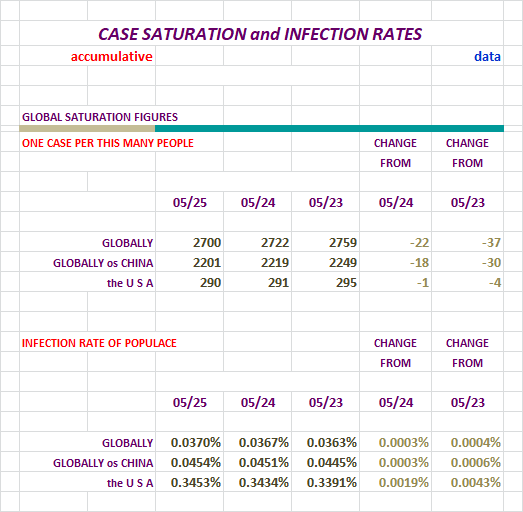
These numbers are skewed by the longer low count days. About all we should be
celebrating is more time off for the clerical class. Smile...
Nations With Lots of Cases
At the end of the day yesterday, there were:
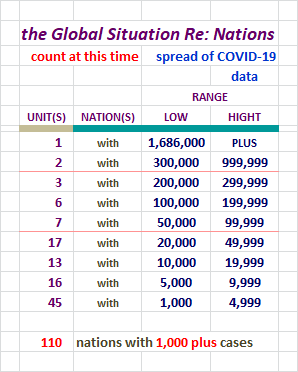
That's a whole lot of nations there. With over 1,000 in each one, we know
that over time they are potential declared cases time-bombs.
Right now in the Global scene, some of these nations are going exponential.
It's sad to see. Sadly, those folks can infect other nations too depening on
how things are handled. Other nations need to stay on top of things,
including our own.
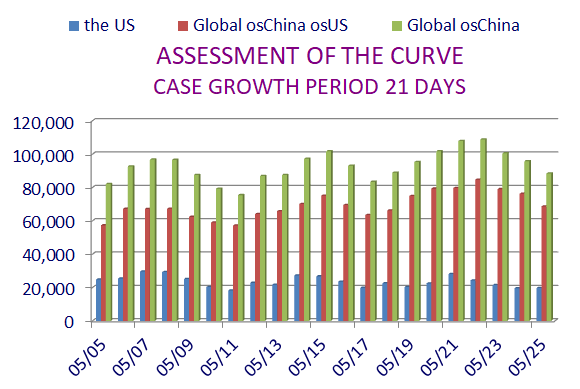
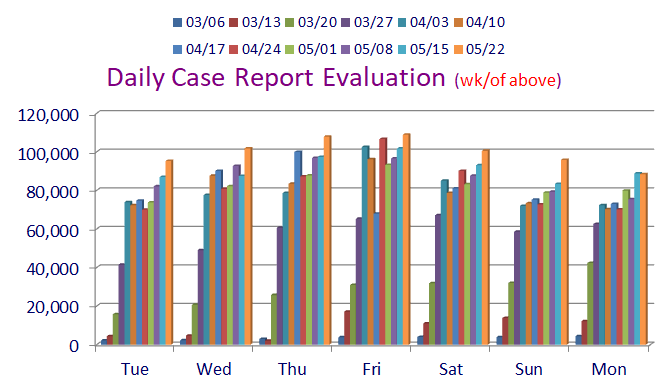
Daily Case Report Evaluation
I'll be keeping tabs on the daily tallies for days of the week for a while. Folks have
noticed some patterns of larger and smaller data entry on certain days, and on Fridays
sometimes the numbers get noticeably larger because of it.
And we now know Thursdays have potential to break out also. Yikes!
Let's check out the numbers and a chart.
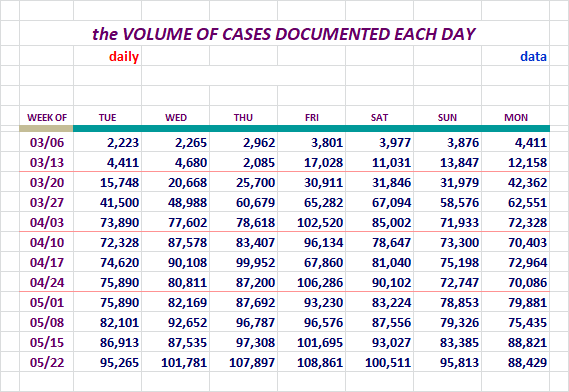
Look at the last column on the right of each grouping, and you'll note that we
are now in our second week of new records for each eay. After nine days, we
finally saw a day that wasn't a record, yesterday. Check out the data above
to see how we just barely missed the record.
As long as those 1,000 plus case nations keep exploding, it is going to be
touch and go Globally.
Not liking this one bit. I'd like to see everyone winding down.
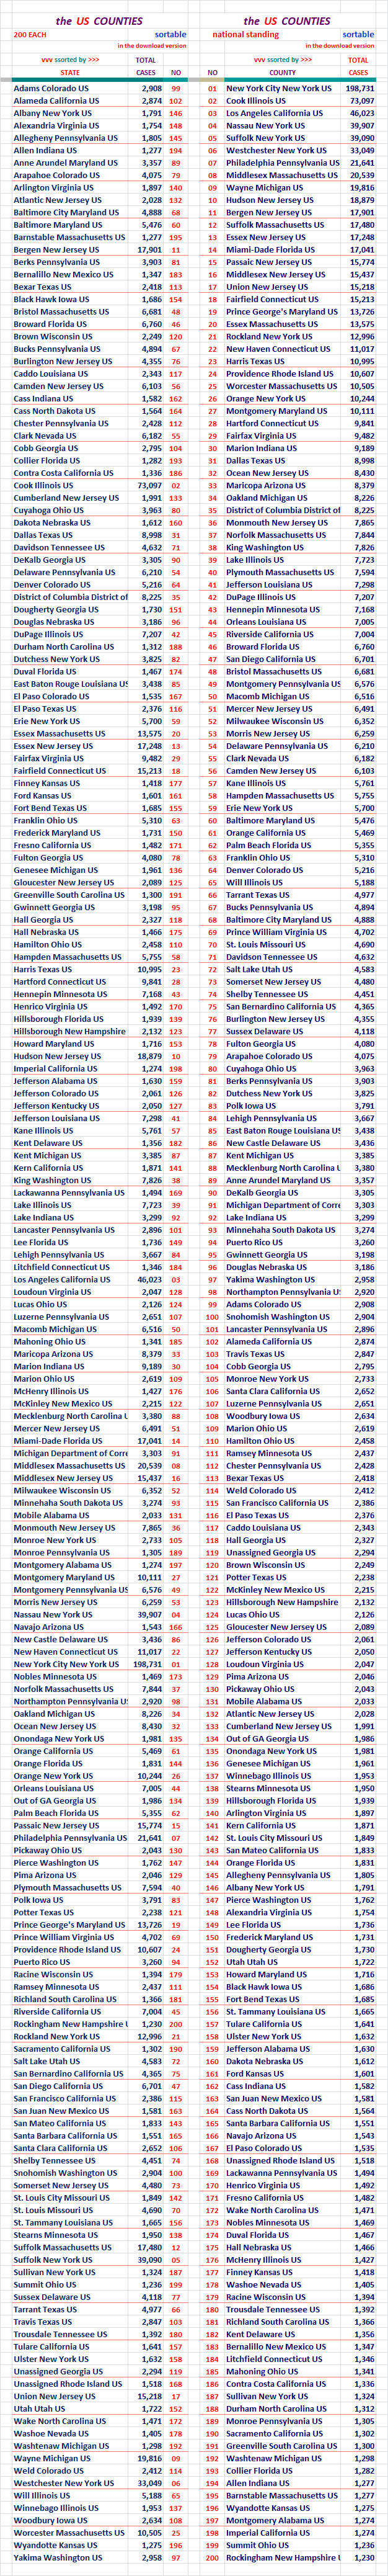
Section: 07
The Top 200 Counties in the U. S., by Number of Cases
This little report lists 200 Counties in the United States in declining Case numbers.
There is also a listing that is alphabetical. This report list only the entities
and the number of Cases in the two different sorts.
It will also be available as a downloadable Excel file in Section 12.
Section: 08
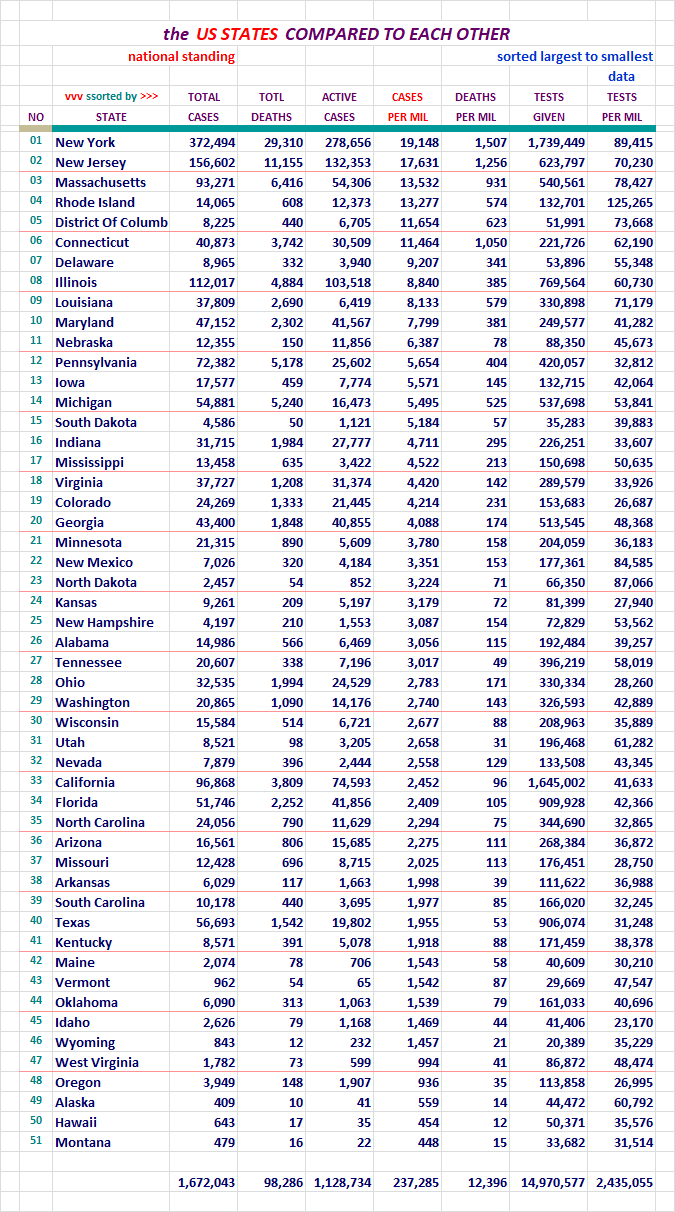
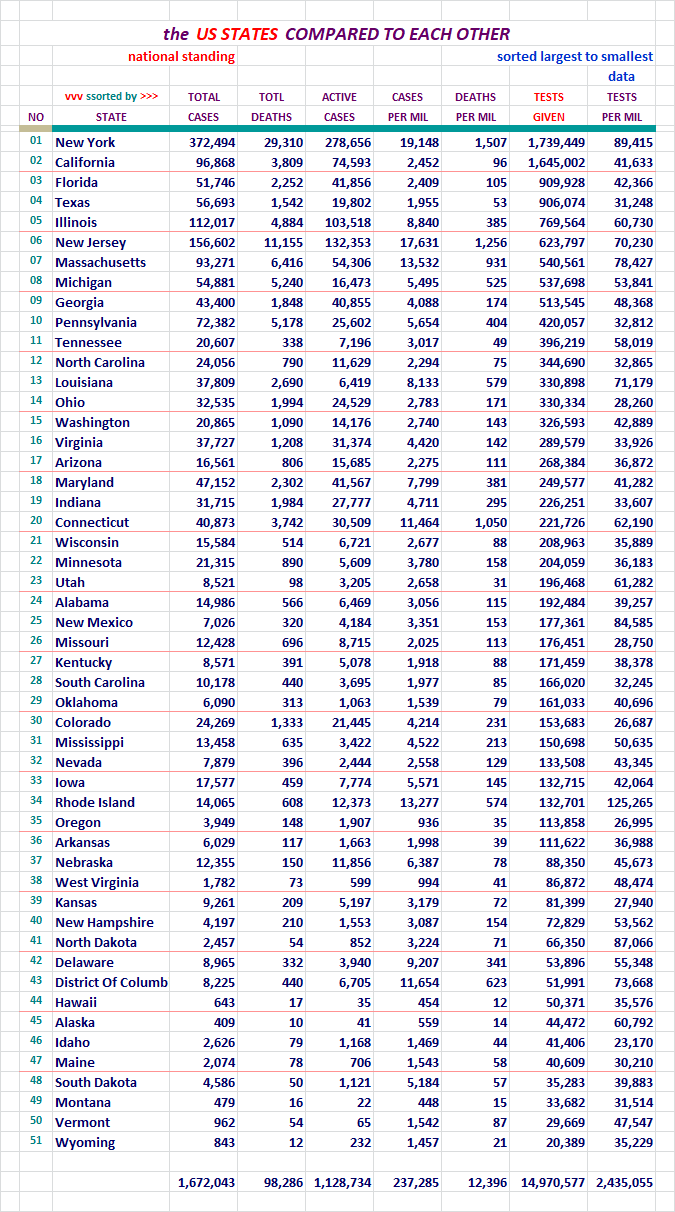
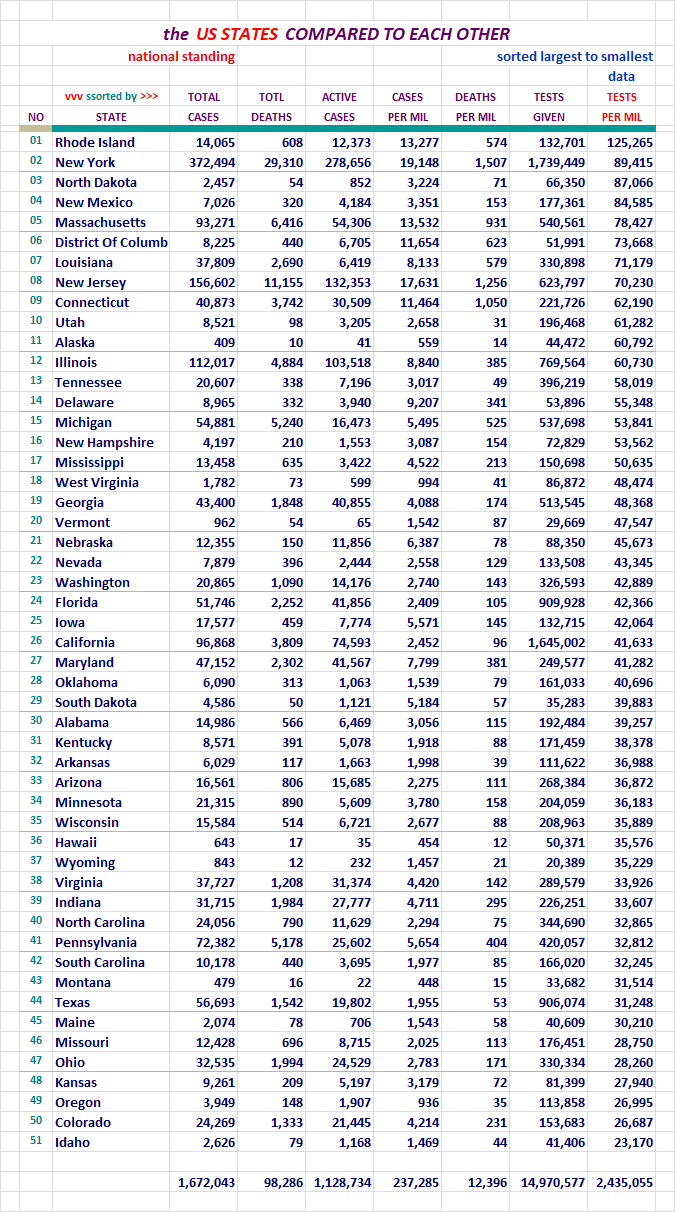
States of the Union and the District of Columbia, Compared to Each Other
Each of these pages is sorted differently. Look at the red header above
the columns to see which column was used for the sort on any given page.

For your review...
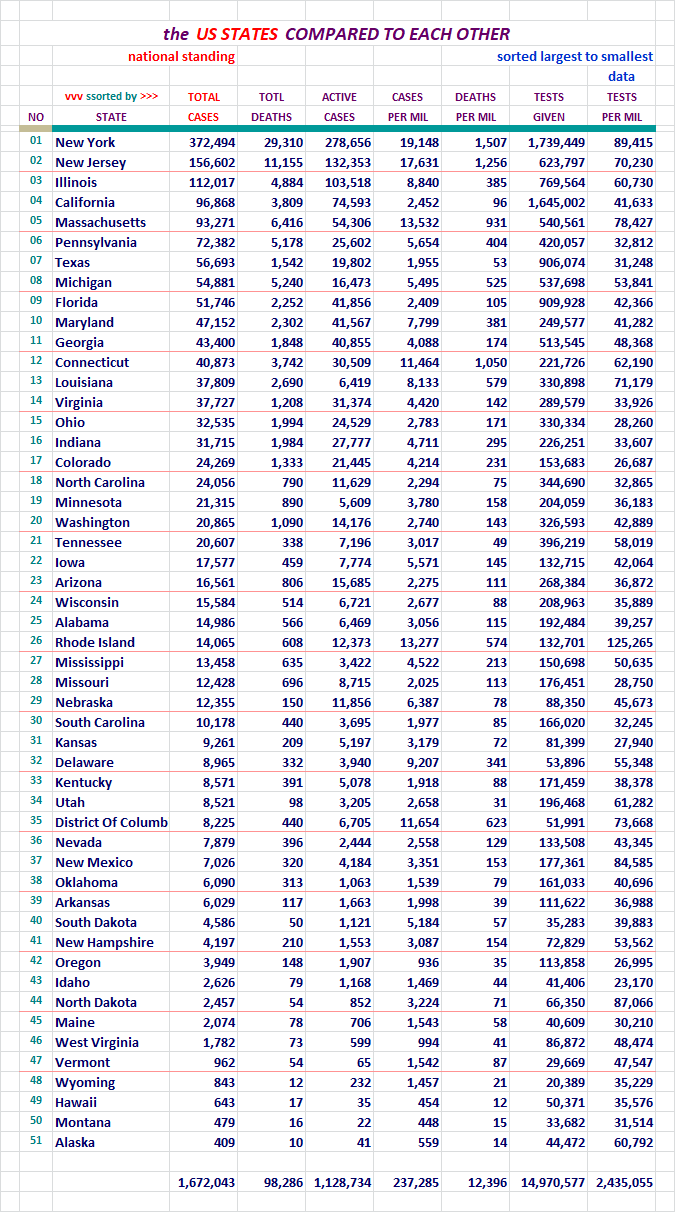
For your review...
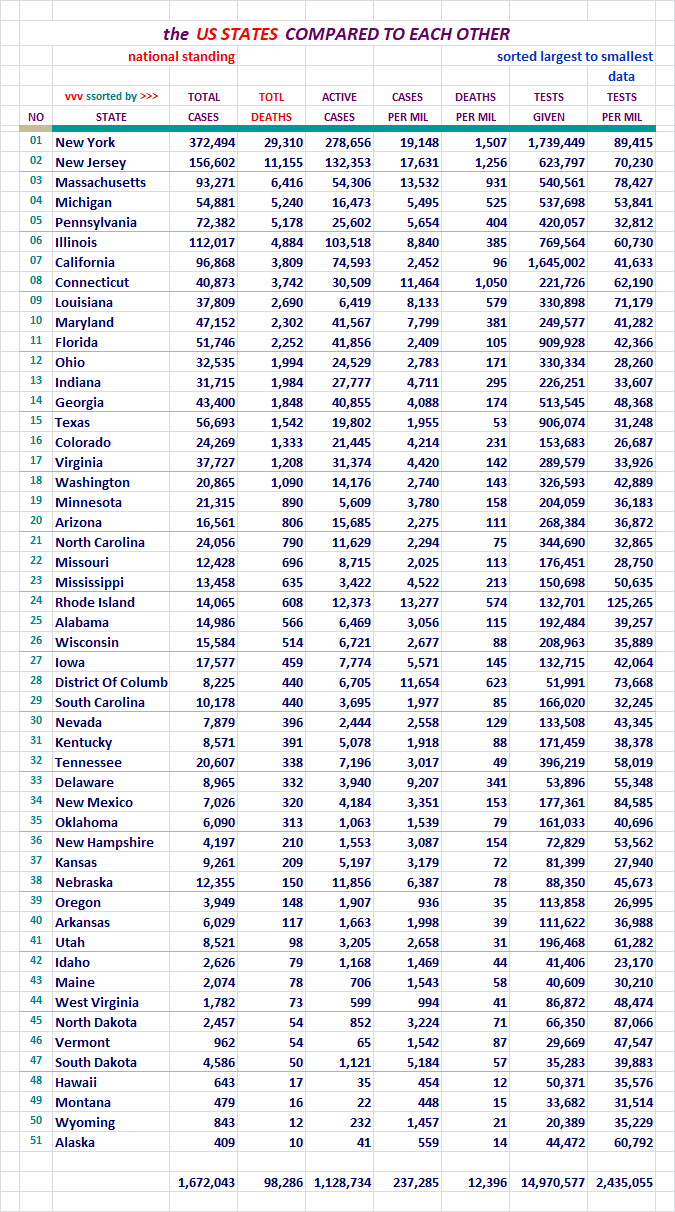
For your review...
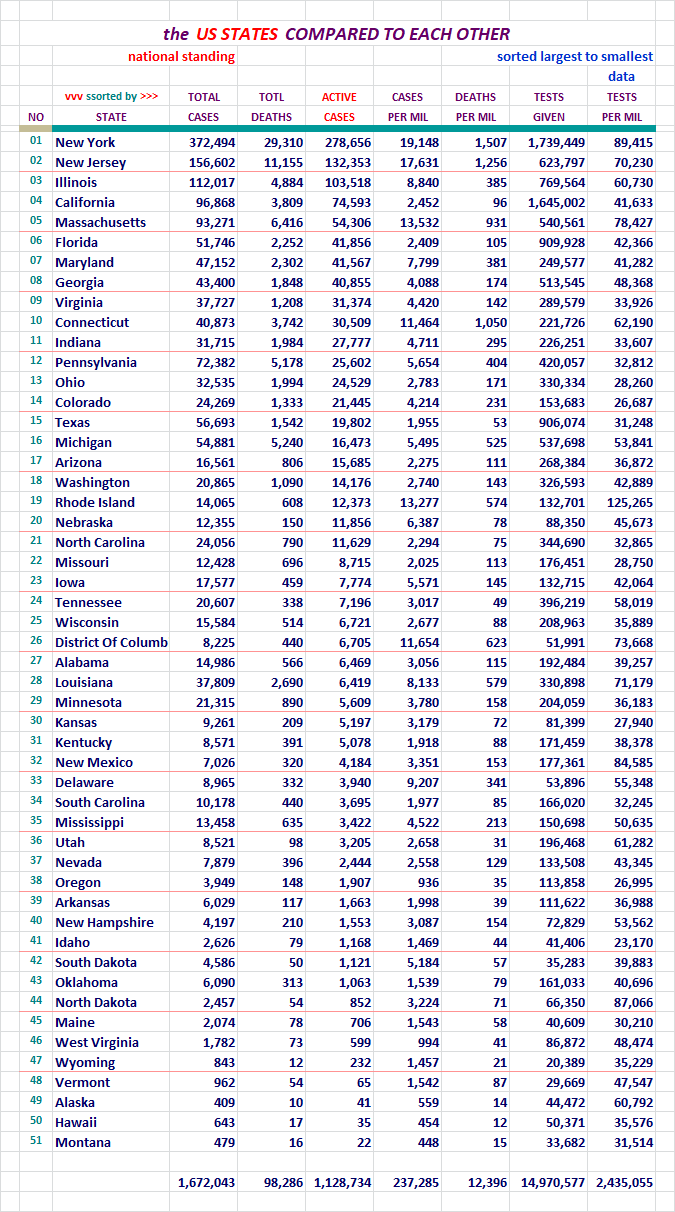
For your review...
For your review...

For your review...
For your review...
For your review...

For your review...
If this area interests you, please use this LINK to the source, and review
the lengthy description and explanation of it's development process.
There are two reports. The presentation above comes from the second one,
and the detailed segmented information below it, may interest you.
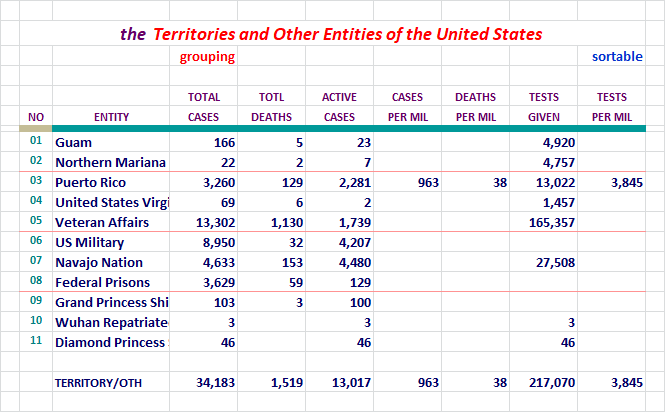
These can now also be found under the states on the Alphabetical list. The
states and these entity's numbers should be combined to match that of the
U. S. figures each day.
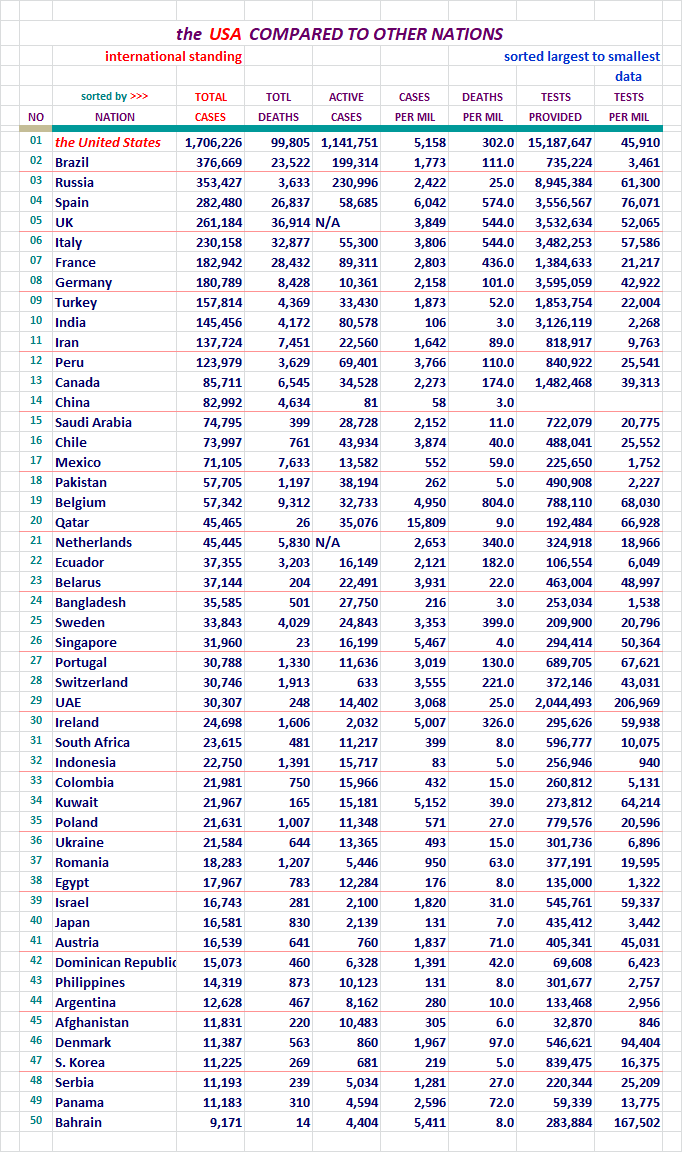
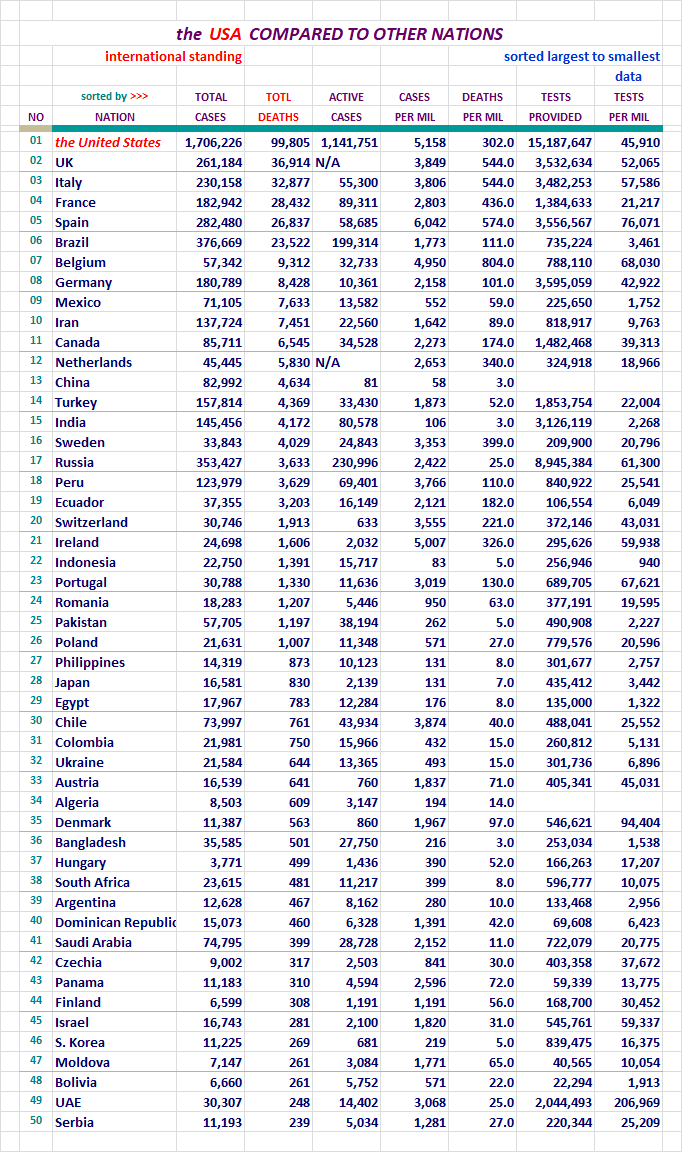
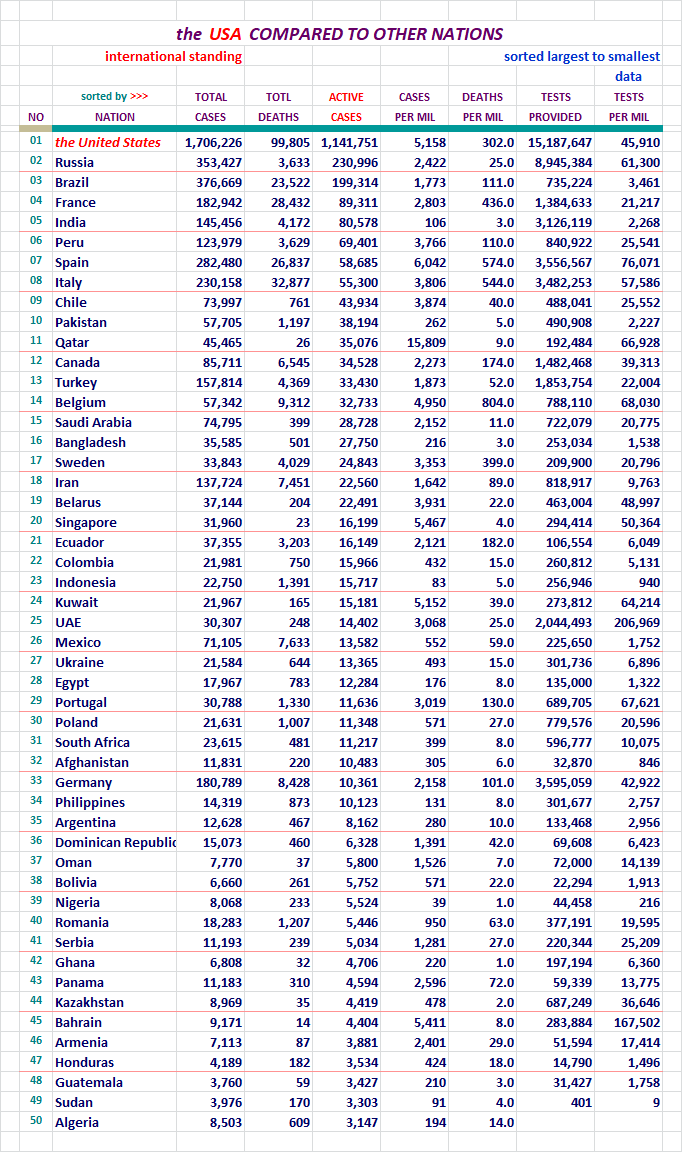
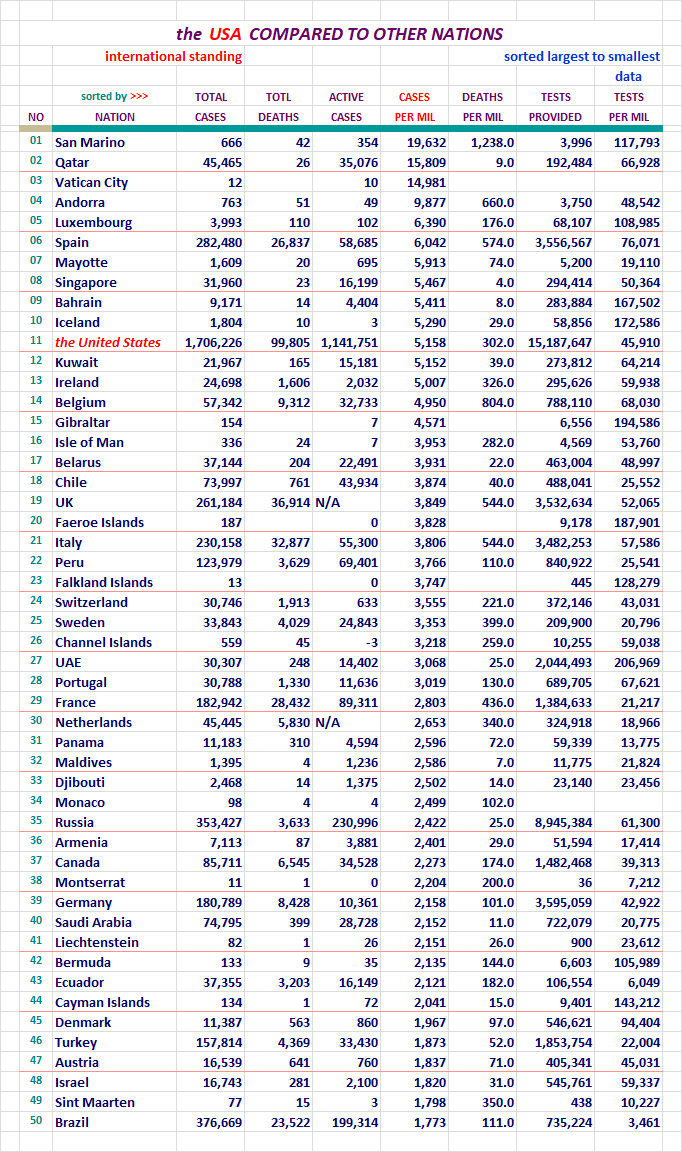
Section: 09
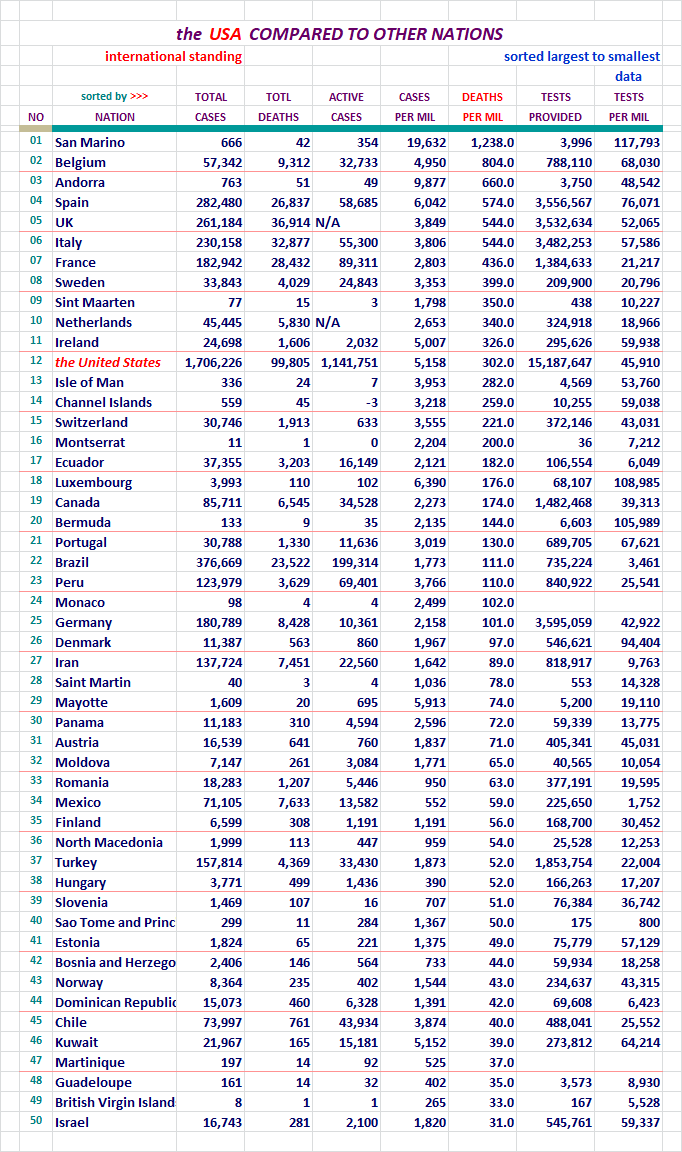
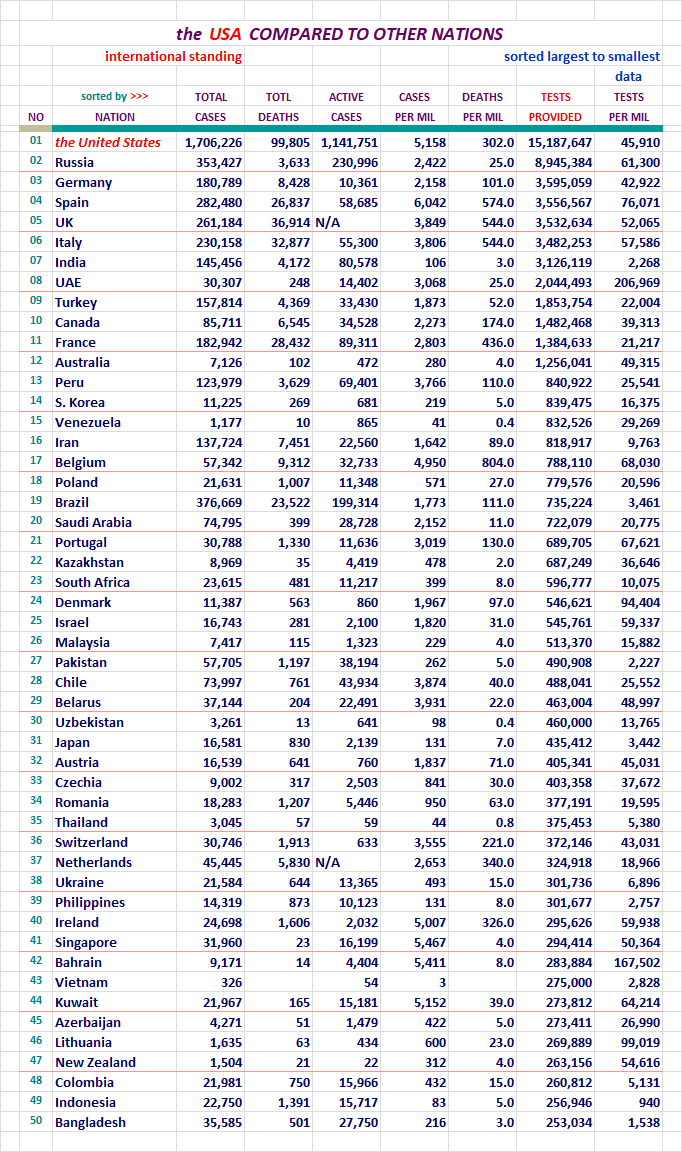
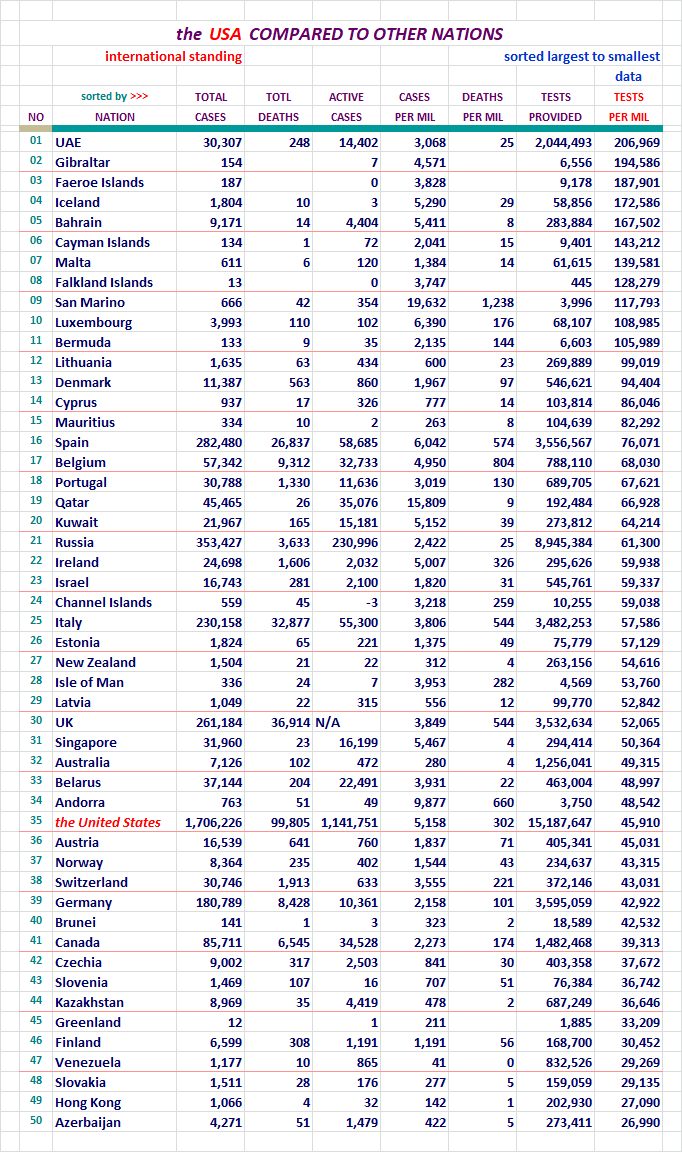
The United States, Where it Ranks With Other Nations?
Each of these pages is sorted differently. Look at the red header above
the columns to see which column was used for the sort on any given page.
The U. S. will be highlighted red here so we can find it easily in the list.
There was 215 nations on this list last night now. I didn't want to post
seven lists with 215 nations on it, so I picked the top 50. Coincidentally,
one report category had the U. S. at 41st, so it wasn't showing up on the
list with the 31 top nations on it. That wasn't the reason why I extended the
list length, but it did work out well.
I work on the nations right next to the states on my spreadsheet. The
states with the District of Columbia come in at a total of 51 lines.
I decided to keep the international reports near that length, and 50
was good enough.
Here we go... for your review.
For your review...
For your review...
For your review...
For your review...
For your review...
For your review...
Well we were 36th on the list at the end of the day. We've come up from as
low as 43, so we've made some progress here.
Section: 10
Here is what it is all about. From January 20th to the present.
This concludes our look back at yesterday's data. Take care...

Section: 11
Data for this Report Sourced From:
LINK WorldoMeters
LINK Johns Hopkins University
The Center for Systems Science and Engineering (CSSE)
LINK United States Center for Disease Control - Provisional Numbers
Listed in the order of current utilization...
LINK You are Invited to Review My COVID-19 Spreadsheet (XLSX)
There is not an XLS version available for distribution at this time.
Section: 12
Other Features:
LINK US Counties200, States & DC51, Territories & Other Entities11, Nations214,
and the CDC Provisional Counts53
Five Excel Spreadsheet datasets you can sort for your own studies...
Section: 13
Links to other resources:
I cannot vouch for these sites. Please use your own judgement.
LINK Adventist Health Coronavirus Resource Hub - Scroll down for useful info
LINK Antibiotic Vitamin, the (Vitamin D)
Good article on Vitamin D's likely role in prevention of infection. Thanks Blam.
LINK CDC Data for Download - Scroll down - Excel required. Includes death stats.
LINK CDC National Center for Health Services
Provisional deaths as determined by review of vital documents. Much lower...
LINK CDC Secondary Data and Statistics - Portal Entry / Look around
LINK Coronavirus (COVID-19) Map
LINK Coronavirus infection risk may be reduced by Vitamin D
by Former CDC Chief Dr. Tom Frieden
LINK Coronavirus Spread Quickly Around the World in Late 2019, Study Shows
the University College London Genetics Institute
LINK COVID-19 Deaths Broken Out by Thirds, 05/07/20 Map of US Counties
Very revealing display of Concentrated Death Zones - thanks hoosiermama
LINK COVID-19 First U.S. Case, Treatment, features Remdesivir
New England Journal of Medicine article
LINK Cytokine Storm, med Actemra, Physician near death saved
LINK Diamond Princess Review at 634 Case Point of Eventual 712
LINK Hydroxychloroquine Article: International Poll
Daily Mail Reports, Most Effective Treatment According to 6,000 Physicians
LINK Hydroxychloroquine Has about 90 Percent Chance of Helping COVID-19 Patients
the Association of American Physicians and Surgeons, reports 91.6% of patients improved clinically
LINK IHME - Institute for Health Matrix and Evaluation
LINK National Institutes of Health - Cornavirus (COVID-19)
LINK Nasal Irrigation is the Key, COVID-19 Related
LINK New York City - interesting breakdown, borough, age, sex
LINK On the Origin of CCP Virus, A Documentary Movie (turn up the sound)
Epoch Times: I highly recommend this very well documented report.
LINK Rt COVID-19
Calculates and displays the Rt Factor for each state. Thanks FreedomPoster.
LINK World Health Organization

A quick peak before work. Good morning and TY.
Good morning...
Thank you too...
Have a good day at work.
Wow...impressive analysis....thanks a million for your diligence
Here is a study, I think you will like, giving which public situations have the most danger of transmission:
Wow! What an effort, thank you!
Looks like we are past the hump, at least for now! Still need to be careful but it is definitely looking much better!
Is there a graph to show the number of recoveries? I may have missed it.
I see the charts but I didn't see a line graph. It would be interesting to see the number of recoveries and number of active cases on the same graph.
Disclaimer: Opinions posted on Free Republic are those of the individual posters and do not necessarily represent the opinion of Free Republic or its management. All materials posted herein are protected by copyright law and the exemption for fair use of copyrighted works.