Posted on 05/28/2020 2:45:57 AM PDT by DoughtyOne
PING LIST - Please contact me as needed...
COVID-19 Update # 71
As of 05/27/2020 23:15 PDST United States CDC - Provisional Numbers
As of 00/00/2020 23:45 PDST Johns Hopkins University - Capture Nations Informaton
As of 00/00/2020 23:45 PDST Johns Hopkins University - Capture Counties Information
As of 00/00/2020 23:46 PDST Johns Hopkins University - Process JHU Data
As of 00/00/2020 23:59 PDST WorldofMeters - Document Core Numbers
As of 00/00/2020 23:59 PDST WorldofMeters - Capture Nations Information
As of 00/00/2020 23:59 PDST WorldofMeters - Capture States Information
As of 00/00/2020 00:00 PDST WorldofMeters - Data Processing begins...
As of 00/00/2020 ??:?? PDST Publish COVID-19 Update - 00/00/00
Thank you for stopping by to check out the COVID-19 Update.
Here you can find...
Section: 01 Commentary, Special Reports, COVID-19 Update Info, & System Notes
Section: 02 the United States Situation
Section: 03 the Global Community Situation Outside China
Section: 04 the Global Community Situation Including China with reservations
Section: 05 the Mortality Report
Section: 06 Miscellaneous Reports of Interest
Section: 07 the United States, Counties (alphabetical / case no descending)
Section: 08 the United States, States Ranking, Provisional Numbers, & Territories
Section: 09 the United States, Ranked with Other Nations
Section: 10 the End of this COVID-19 Update
Section: 11 Data Sources and a Link to My Own Spreadsheet
Section: 12 Linked Spreadsheet: Counties, States, Provisional, Territories, & Nations
Section: 13 Links to Other Resources
Section: 01
Commentary, Special Reports, and COVID-19 Update Information2
Interesting Tid-bits (hopefully)
Yesterday's Summary in a Nutshell
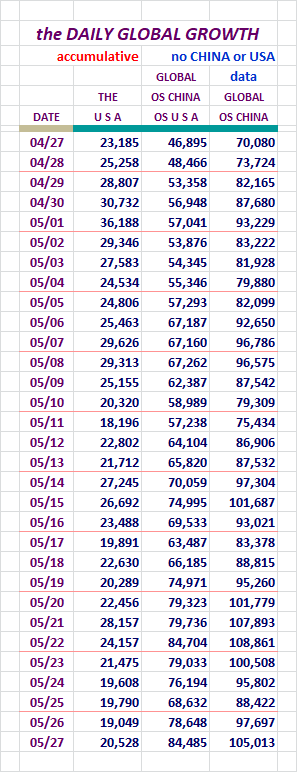
On the Global scene there were 105,015 New Cases Declared yesterday. Yep, it
was a record for a Wednesday.
The New Cases in the United States came in at 20,528. It was up a bit from
the day before by only about 1,500 New Cases.
On the global scene, the Fatalities reported out at over 5,000 again, 5,214
to be exact.
Our Fatalities came in at 1,535, one more than double the 767 from the day
before. We knew this would happen. It's not a terribly high number
realizing how other normal days have been runing over the last week or so.
A New Stat Data and Chart Presentation
There was a request for a new set of data with a chart for the United States.
It will include Declared Cases, Active Cases, Recoveries, Fatalities, and
Resolved Cases. It made sense to be able to look at these side by side
with a new chart. I decided to provide it for the Global Outside China
scene as well.
Starting tonight, these will appear at the bottom of the U. S. section, and the
bottom of the Global Outside China section.
These data workups use ten day averaging to smooth out the rough spots.
Don't be confused because the data at the current date is less than what
the one day figures are. Remember, these go back ten days, add up the totals
and divide by ten. Numbers going up will be moderated by the lower numbers
earlier in the ten day period. The same would/will happen if and when they
decline.
These new sets of data and charts, will bring the total to 60 different
datasets and charts I research data for, develop, and publish each morning.
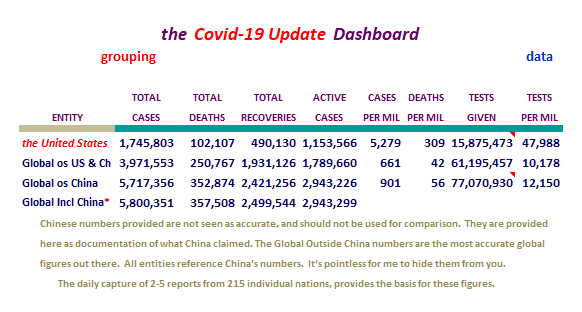
Section: 02
The Following Addresses the Numbers Here in
the United Staetes of America
Here we go...
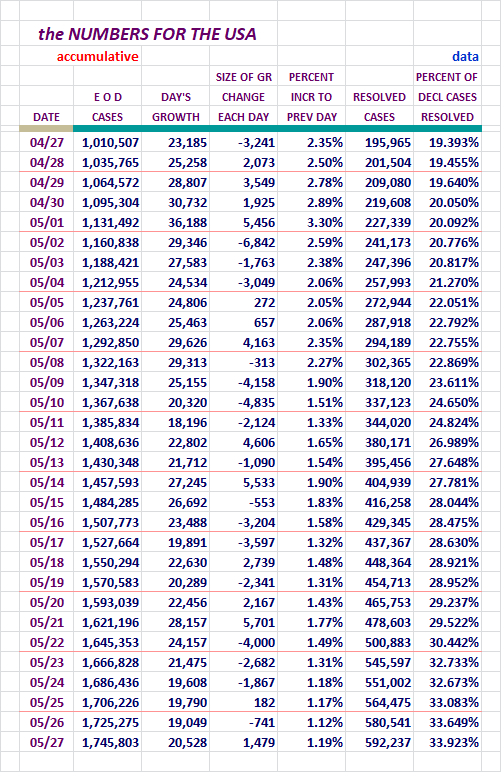
Our New Case numbers continued to remain low at 20,528. The day before had
been 19,049, so this wasn't so bad for a normal reporting day.
Concept of adding in Active Cases and Serious Critical here, courtesy of amorphous
Here are more of our numbers...
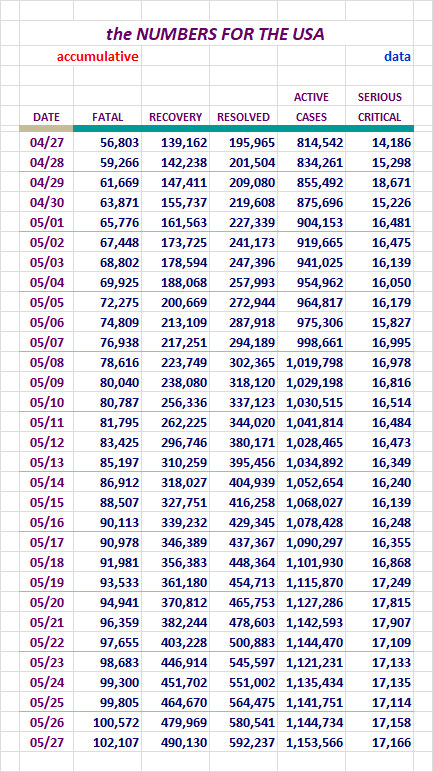
Fatalities doubled, but we are still in a relatively low region at 1,535.
Our Recoveries and Resolved Cases were a little off, but they jump around
quite a bit so this isn't a big deal.
Our Slice of the COVID-19 Pie
The growth of our slice of the pie has been dropping recently.
Here are the numbers I've been tracking, Globally Declared and Active Cases.
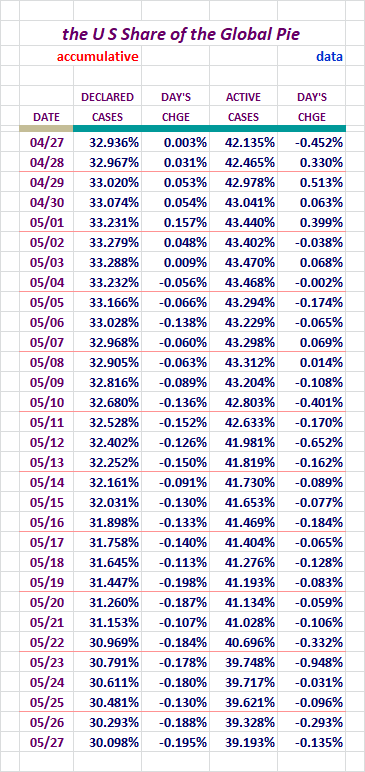
Our slice continues to get smaller. Very nice to see...
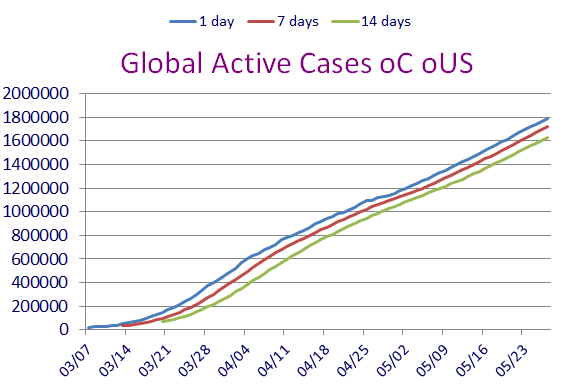
Active Cases in the United States / Chart
Unlike some of the other charts here, we should see a good rise and
fall at some point withone.
Note that this presents the one day and then 7 and 14 day averaging versions.
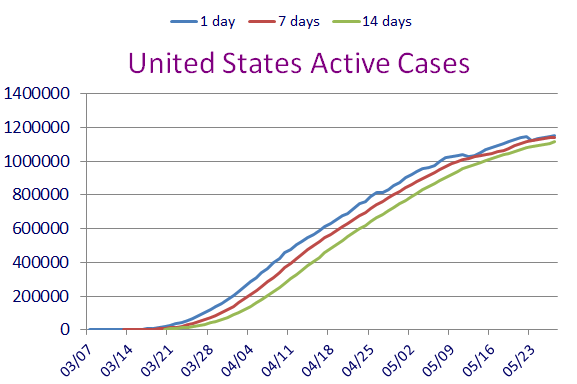
Remember, these are not new Declared Cases. These are remaing Active Cases.
The single day numbers have fallen in behind the seven day line. Due to the
low days we are achieving a flattening out here. I don't know if that will
continue. The long weekend and low reporting was likely responsible for this
chart flattenign out. We'll see.
Testing and New Case Figures
Requested by stocksthatgoup
Some folks have shown an interest in seeing the COVID-19 Test figures compared
to the New Cases being declared. This following Data addresses that.
I went back as far as I could in my records. I plan on keeping a running
30 day display here, with the Chart starting on 04/21 & 04/23 ongoing.
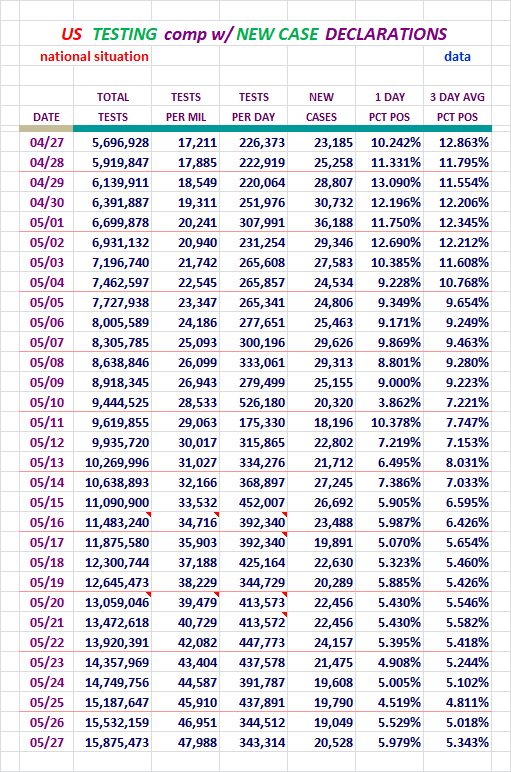
You can see how the Declared Cases to Testing percentage has gone down over
time, but the last two days have revealed an up-tick in the percentages.
Here is a chart to reveal visually what the decline has looked like.
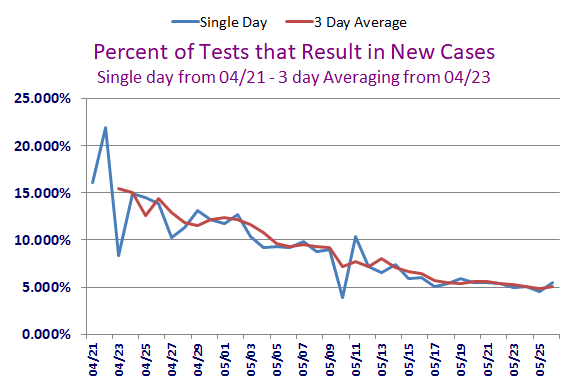
Folks can determine for themselves just how New Cases are affected by the
Testing.
The U. S. Stats / w 10 Day Averaging / Fr: 03/17
Requested by: Texas Eagle
This data and chart presents things in a little different way. In the
chart it is easy to see the relationship of these numbers.
The Chart will use the data all the way back to 03/17, but this data only
goes back one month.
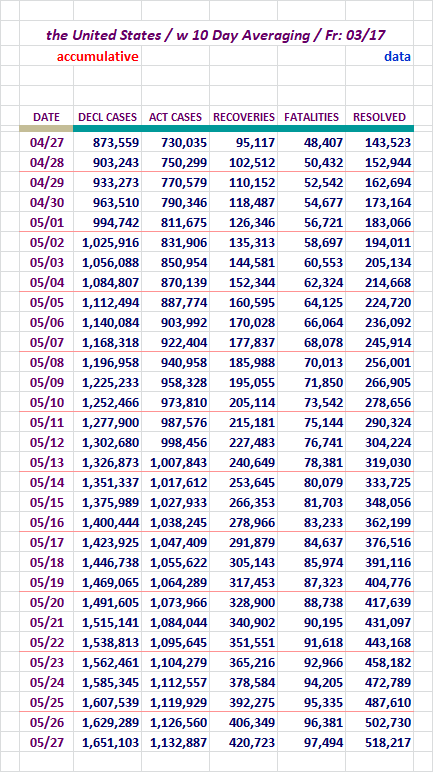
Here is the chart to match.
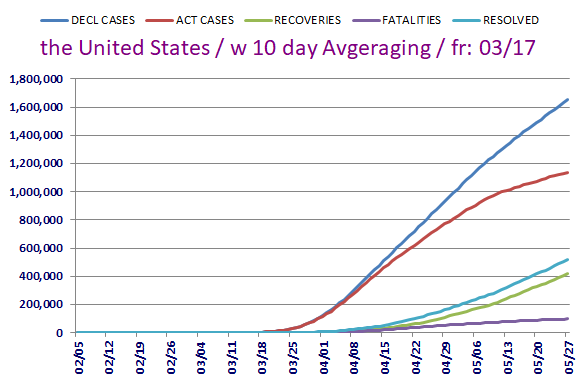
I kind of like it...
Section: 03
The Following Addresses the Global Numbers
without Mainland China
Here is the first set of Data for the Global Outside China
Territories
I'll just let folks look for themselves tonight.
The volume is heavy.
Fatalities, Recoveries, Resolved, Active Cases, and
Serious/Critical Cases - Globally, Excluding M/L China
Concept of adding in Active Cases and
Serious/Critical here, courtesy of amorphous
Here we go...
Again, I don't believe there is anything unusual here today.
How is the Global Community Outside China Doing,
Without U. S. numbers?
Well, a little better yesterday...
Look at that middle number. It's very high. The Global scene outside China
and the U. S., has been hit hard. We have a number of hot spots out there
right now.
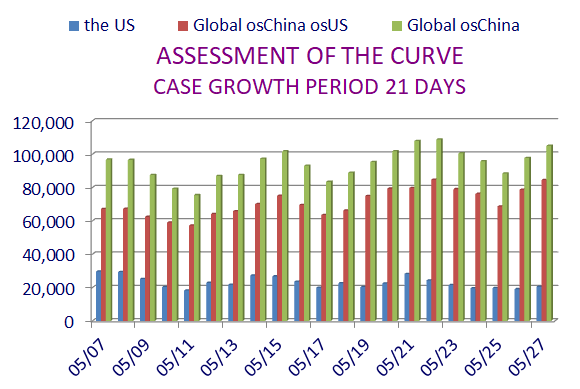
They are hitting that 100,000 line or just coming close to it.
Look at our blue field compared to the Global red field.
Our day was very decent, but Globally outside China, things are still hot.
It's not looking good. Check out the direction of those red lines above.
It's fitting that Excel chose red for them.
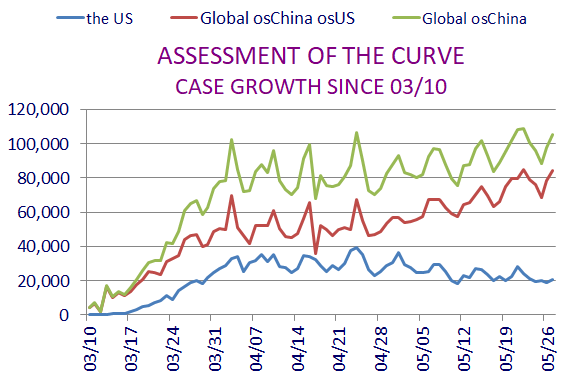
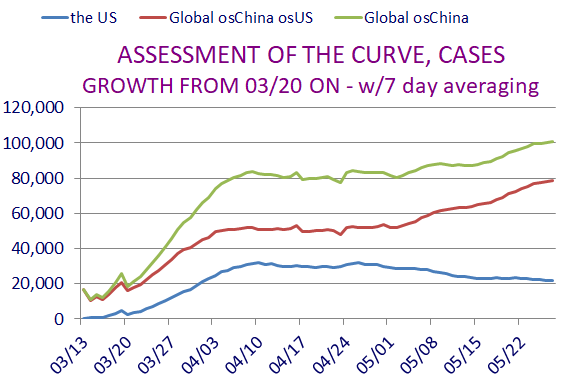
The Active Cases outside China Globally / Chart
As in the U. S. version of this, we should see a good rise and fall at
some point these two.
Note that these present the one day and then 7 and 14 day averaging versions.
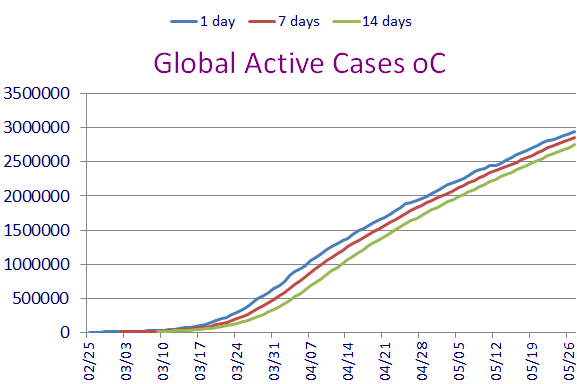
Remember, these are not new declared Cases. These are remaing active cases.
If you look closely at that last one, it shows that just when things looked
ready to flatten out, new nations caught fire with COVID-19, and up went the
count of Cases again.
Special Section on France, Germany, Italy, Spain, and the U. K.
Case growth.
Let's Look at Some Numbers in Five Day Increments:
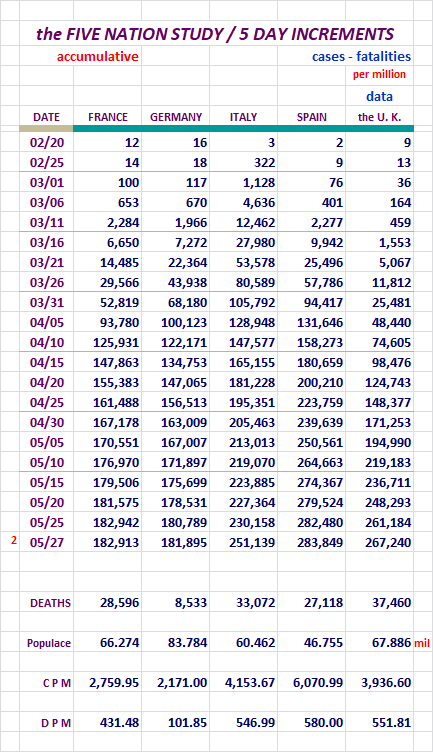
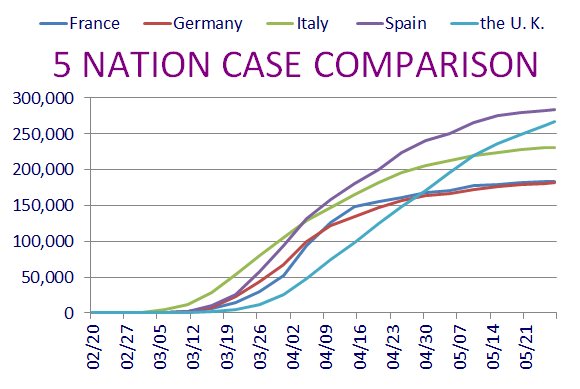
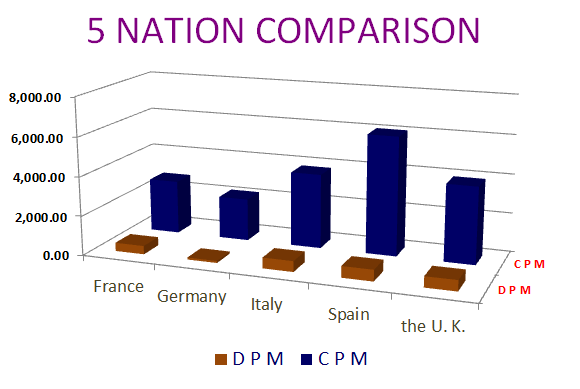
The same comments fit for about each day here.
The chart of Cases, causes the perception that it is in conflict with the
second chart below it. Actually it isn't. It is depicting raw numbers
of New Cases. Down below the chart addresses per million numbers.
They appear to skew, but everything is accurate here.
Sweden and It's Neighbors, Who Has the Best Tactic Against COVID-19?
Sweden is doing its own thing with regard to isolating. I think most people
are aware of it by now.
Here are some numbers to help us look at this issue.
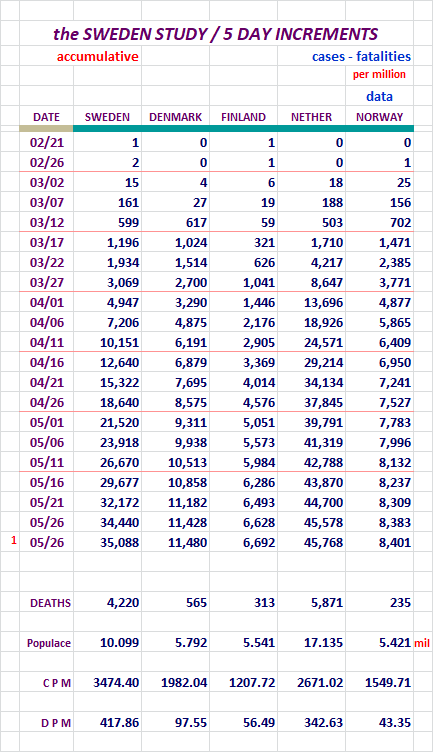
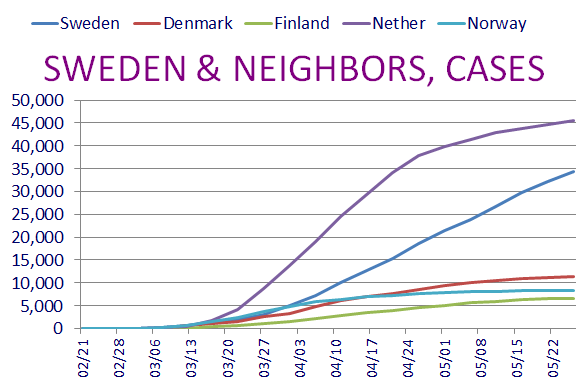
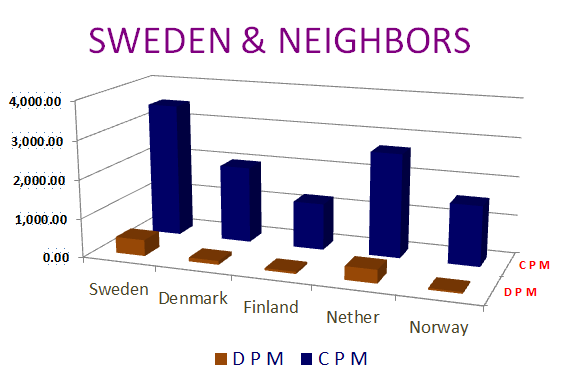
Sweden still remains a hot topic.
Movers and Shakers is a New Feature as of 05/22/2020.
I will present the top fifty nations with the most New Cases and New
Fatilities.
Here we go...
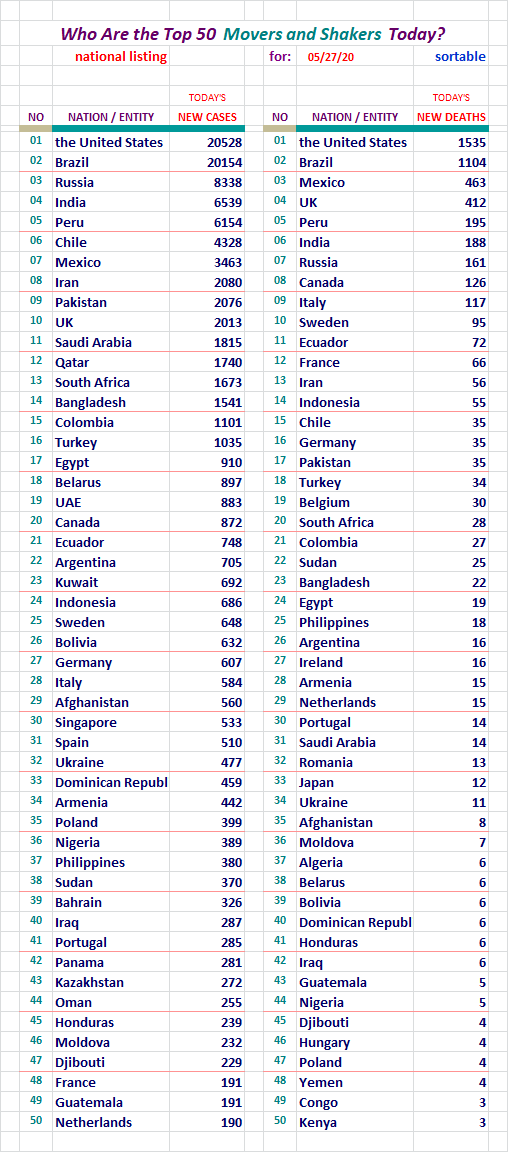
Back to normal reporting, and we're back on top. Brazil is banging on
the door though. If we're lucky, we'll drop out of those top spots and
fail to return.
Global osChina Stats / w 10 Day Averaging / Fr: 03/05
Requested by: Texas Eagle
This data and chart presents things in a little different way. In the
chart it is easy to see the relationship of these numbers.
The Chart will use the data all the way back to 03/05, but this data only
goes back one month.
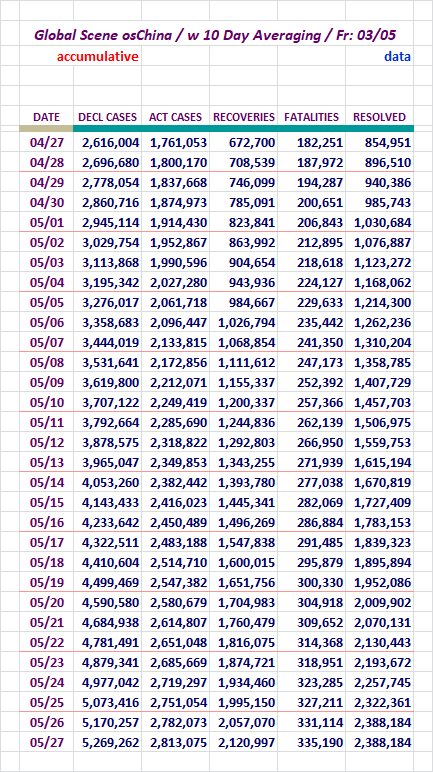
Here is the chart to match.
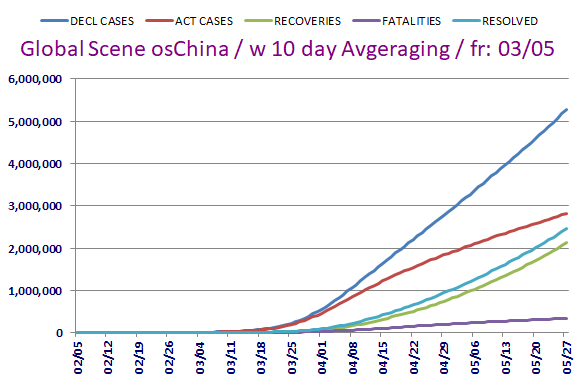
I kind of like it...
Section: 04
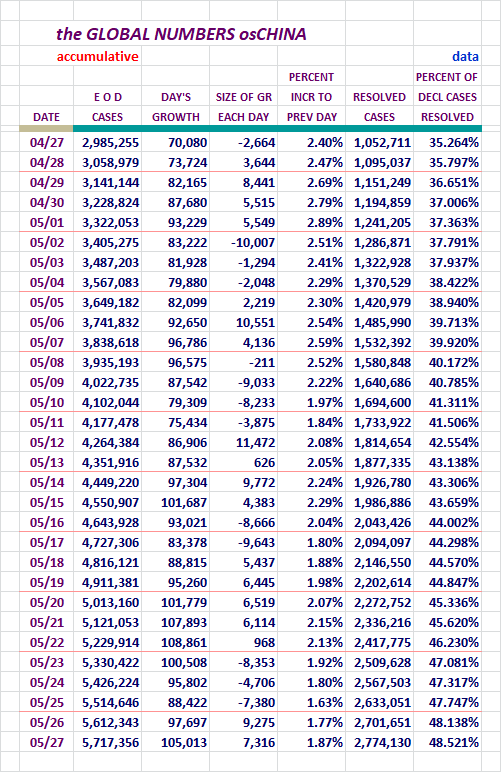
The Following Addresses the Global Numbers
including Mainland China*
Mainland China's numbers are 0.002% of today's total global numbers.
A Look at Declared, Resolved, and Active Cases, Includes M/L China
End of day figures follow:
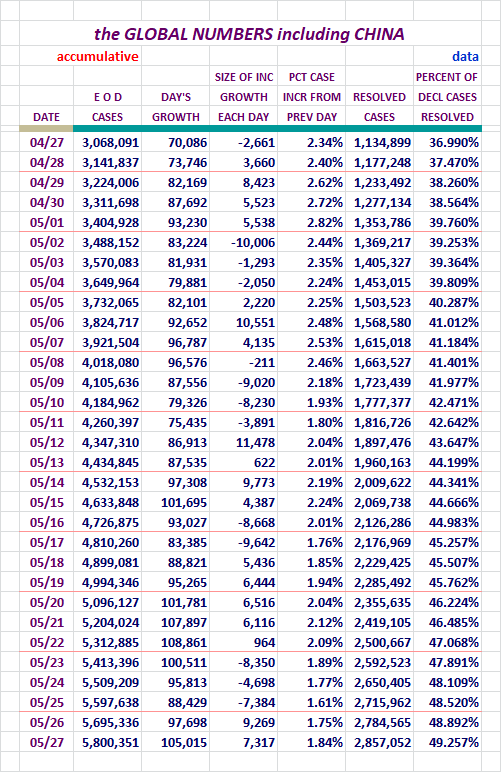
On the right that Declared Cases resolution percentage continues to grow.
Look at the increase from 04/25 to this point. Nice...
We should be at 50% by the 28th to the 30th of May. The way it has been going,
we may actually hit 50% earlier than that. We'll see.
I first presented that prediction about a week ago. It seems I gaged it about
right.
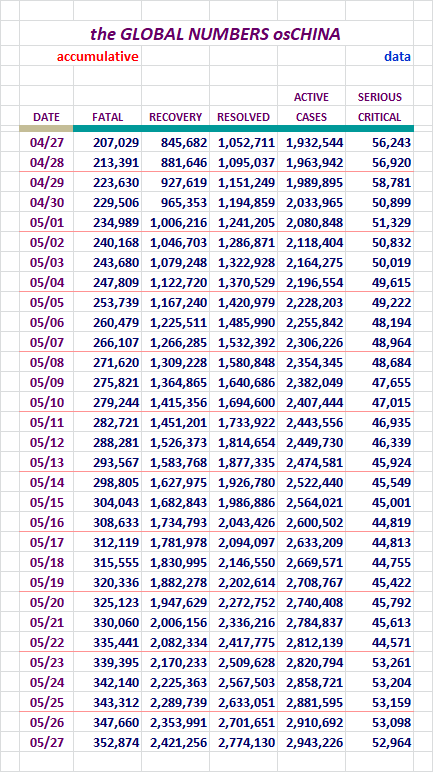
Fatalities, Recoveries, Resolved, Active, and Serious/Critical
Cases Globally, Including M/L China
Concept of adding in Active Cases and
Serious/Critical here, courtesy of amorphous
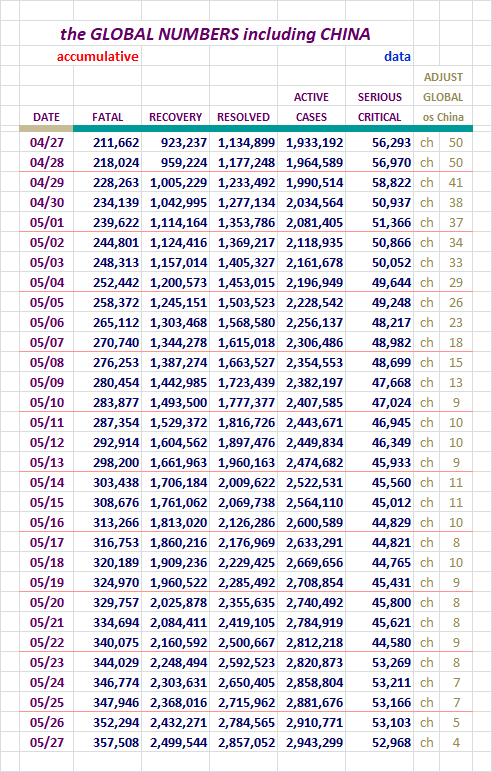
Not much to say here. Big numbers getting bigger!
Section: 05
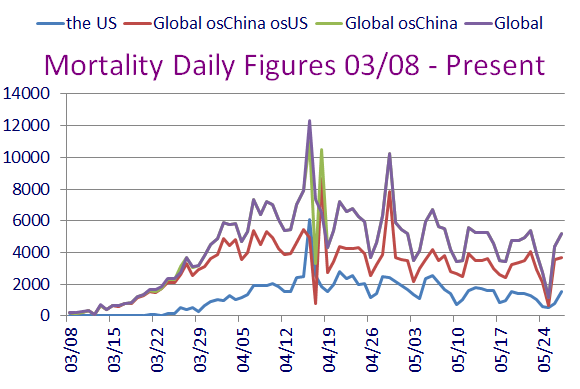
the Mortality Report
Our numbers went up considerably yesterday. They doubled over the day before,
but we knew this was coming after the three day weekend.
Here are the figures for the growing case totals for four entities.
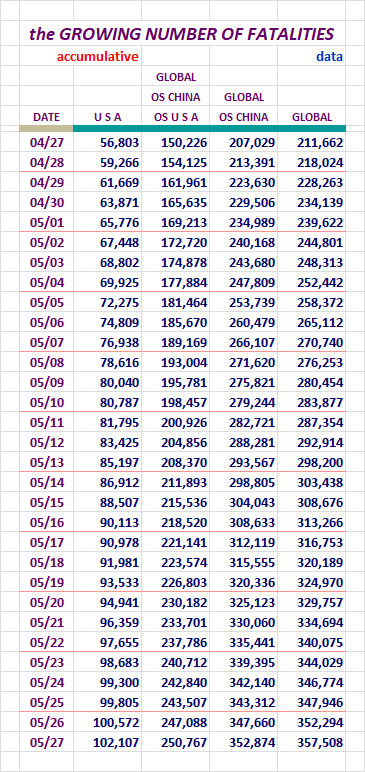
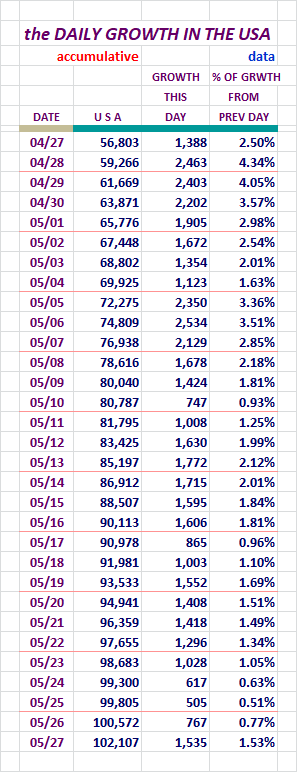
I urge folks to review the CDC's Provisional numbers bellow. I am not touting
this count (100,572), but it's out there so I mention it. We have articles all
over the forum detailing the issues with these numbers, but we have to have
reference points.
With no numbers we'd be flying blind. It's really pretty simple. Well, to
most adults it is.
Here is the chart to go along with those figures.
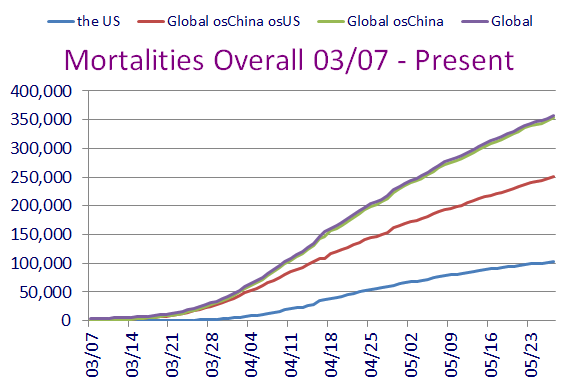
Looks pretty ominous there doesn't it.
Here are figures revealing the daily growth for those four entities.
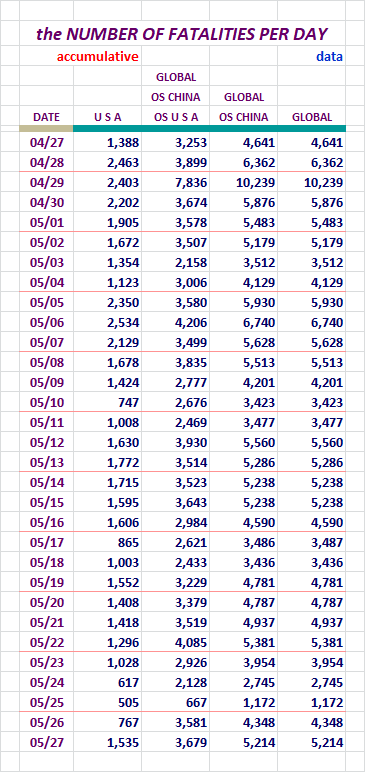
Our numbers of new Fatalities yesterday was double the day before. That
being said, we are still not up in the 1,800-2,000 range like we were
for a while there.
Here are two charts to go with the above data.
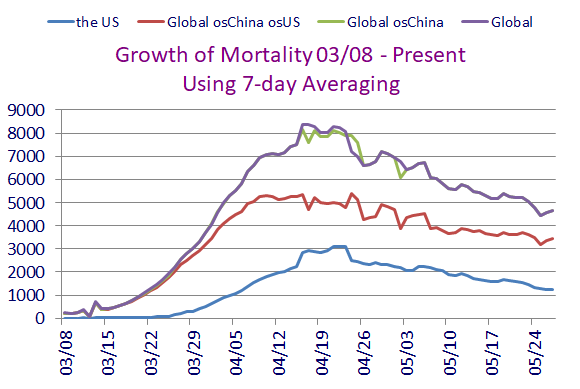
These each seem to be taking a little bounce up, then down. We'll have tIto
watch this one closely.
Here, let's look at data for the U. S. broken out by itself.
Well we bounced up, but I still think of this range as moderate. I'm glad
not to be in the 1,800-2,200 range.
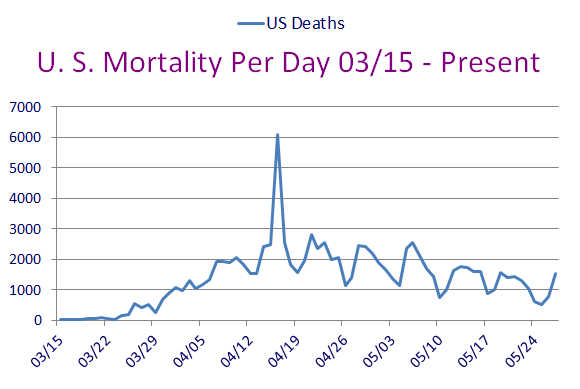
Well, we moved up. Still we're in the 1,500 range rather than the
1,900 to 2,500 range. That's not so bad for now.
Section: 06
Population Saturation
Here are figures revealing how many people in each population base represent one case.
I'm also showing what percent of each population base is infected at this time.
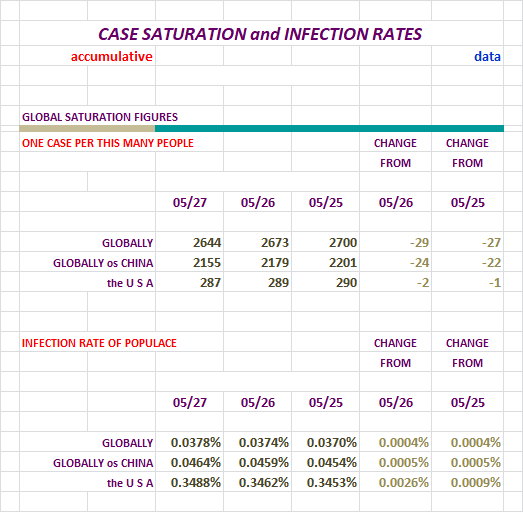
These numbers have slowed down in the direction they are headed. I think we
may see them reverse directions in a few weeks. We'll see.
"We'll see", evidently my favorite catch phrase for the time being.
Nations With Lots of Cases
At the end of the day yesterday, there were:
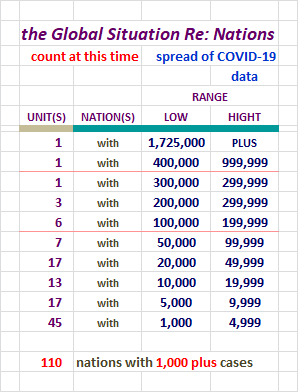
That's a whole lot of nations there. With over 1,000 in each one, we know
that over time they are potential declared cases time-bombs.
Right now in the Global scene, some of these nations are going exponential.
It's sad to see. Sadly, those folks can infect other nations too depening on
how things are handled. Other nations need to stay on top of things,
including our own.
Daily Case Report Evaluation
I'll be keeping tabs on the daily tallies for days of the week for a while. Folks have
noticed some patterns of larger and smaller data entry on certain days, and on Fridays
sometimes the numbers get noticeably larger because of it.
And we now know Thursdays have potential to break out also. Yikes!
Let's check out the numbers and a chart.
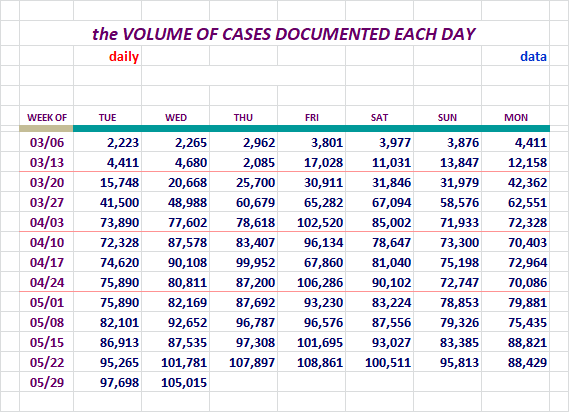
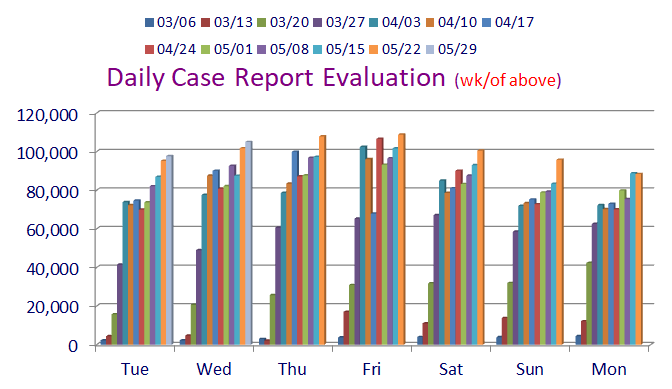
Look at the last column on the right of each grouping, and you'll note that we
are now in our second week of new records for each eay. We did miss one day,
but since a week ago this last Saturday, we have had a record every day but one.
Do I have to say it? Once again, a record for a Wednesday.
As long as those 1,000 plus case nations keep exploding, it is going to be
touch and go Globally.
Not liking this one bit. I'd like to see everyone winding down.
Section: 07
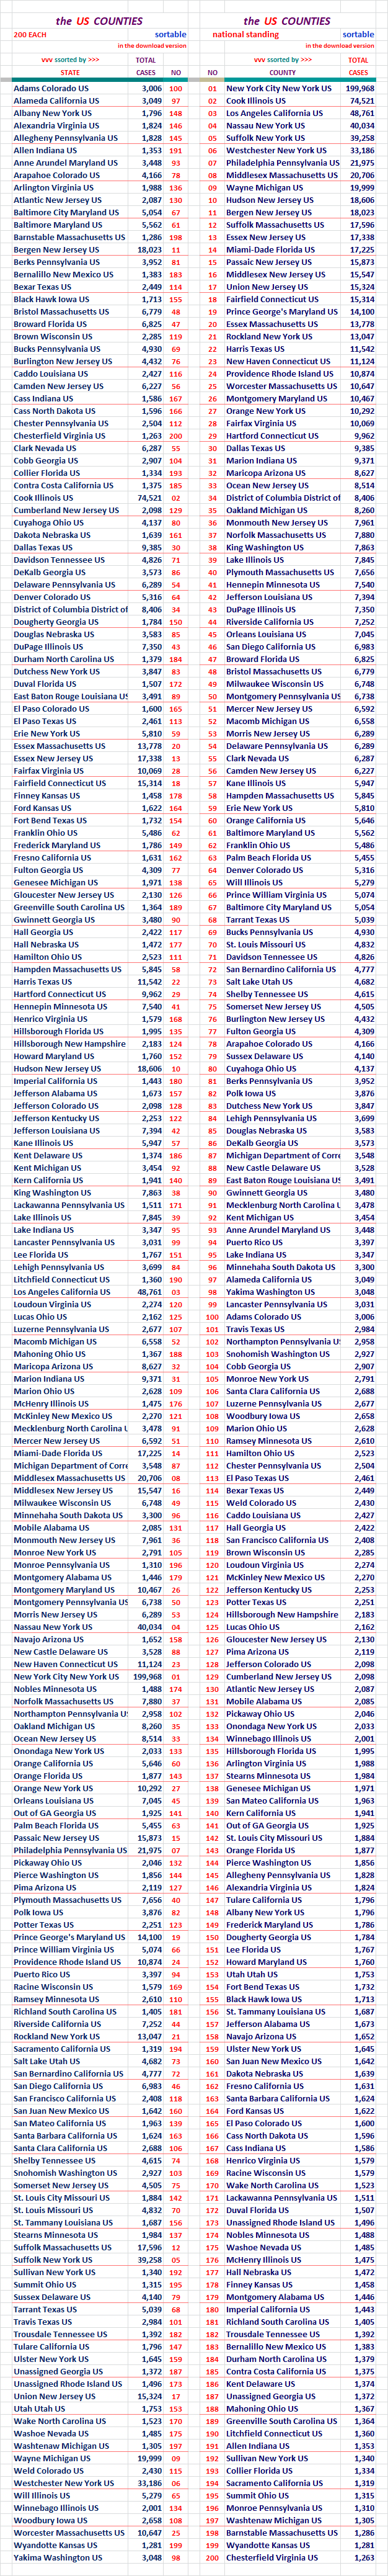
The Top 200 Counties in the U. S., by Number of Cases
This little report lists 200 Counties in the United States in declining Case numbers.
There is also a listing that is alphabetical. This report list only the entities
and the number of Cases in the two different sorts.
It will also be available as a downloadable Excel file in Section 12.
Section: 08
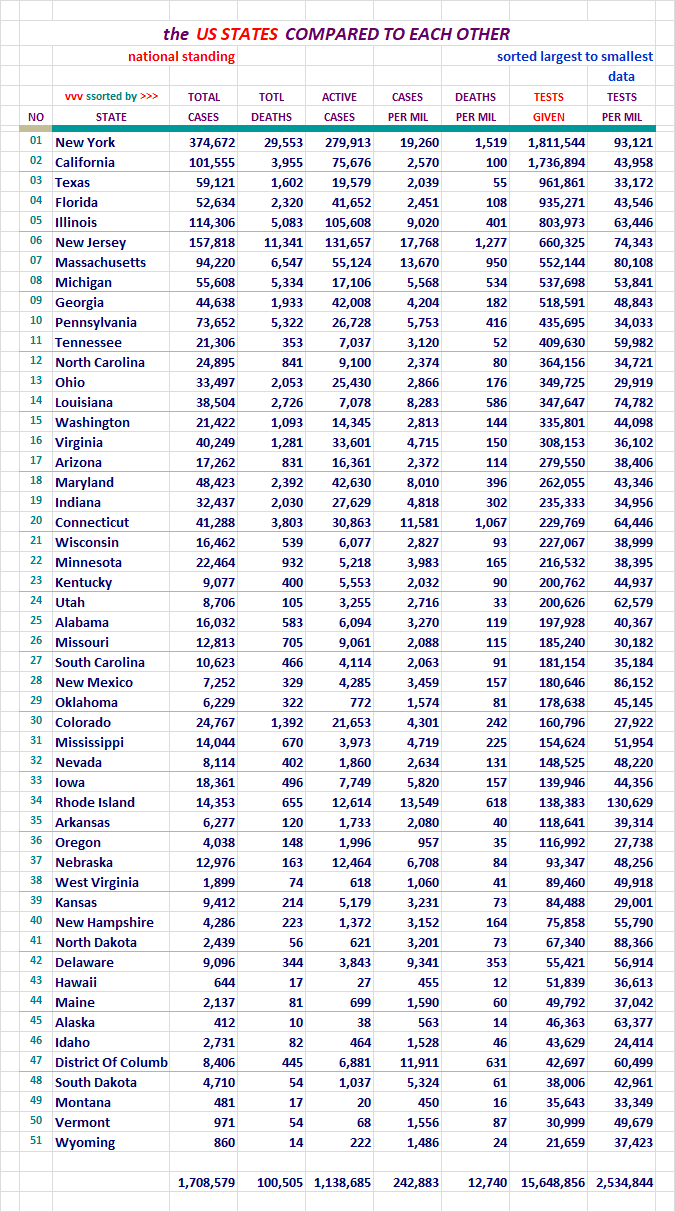
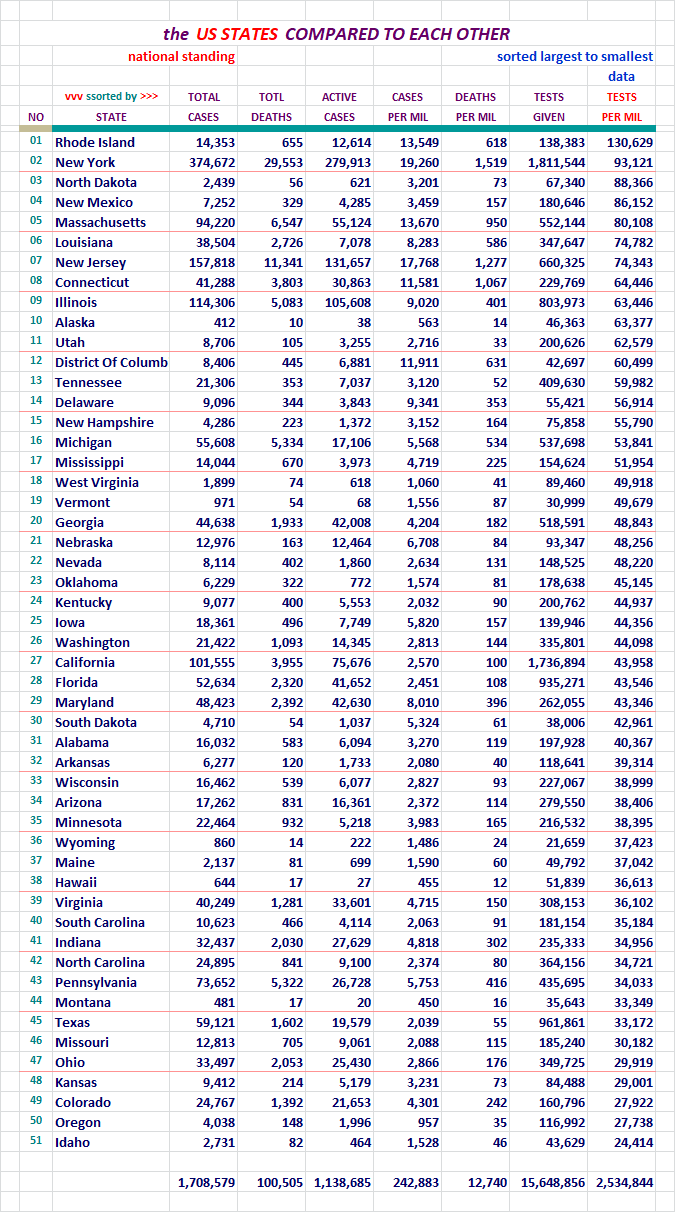
States of the Union and the District of Columbia, Compared to Each Other
Each of these pages is sorted differently. Look at the red header above
the columns to see which column was used for the sort on any given page.
For your review...

For your review...

For your review...
For your review...
For your review...

For your review...
For your review...
For your review...
For your review...
If this area interests you, please use this LINK to the source, and review
the lengthy description and explanation of it's development process.
There are two reports. The presentation above comes from the second one,
and the detailed segmented information below it, may interest you.
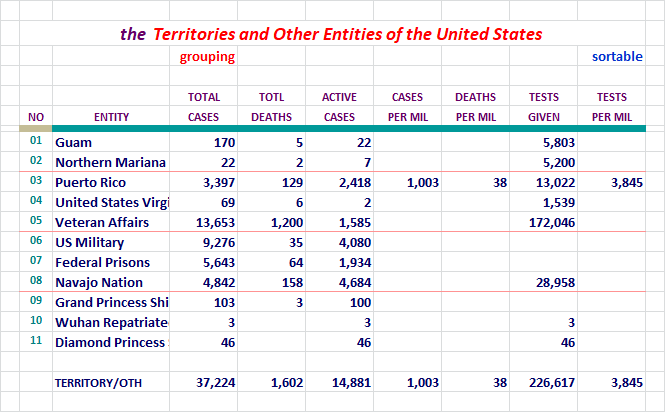
These can now also be found under the states on the Alphabetical list. The
states and these entity's numbers should be combined to match that of the
U. S. figures each day.
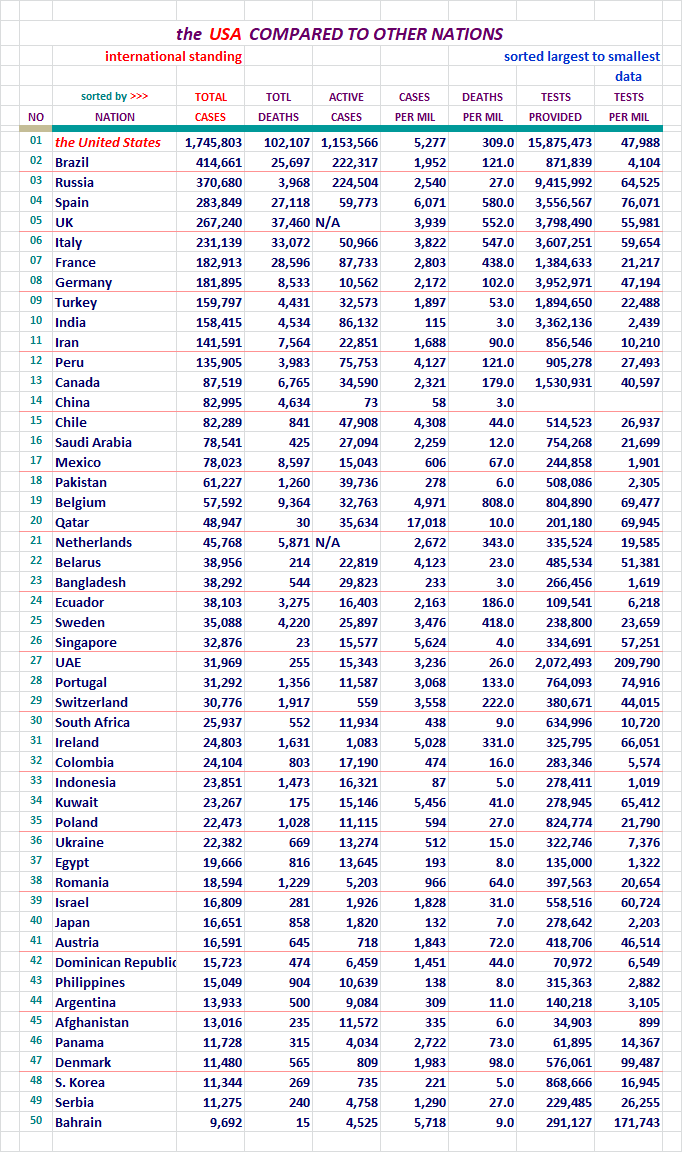
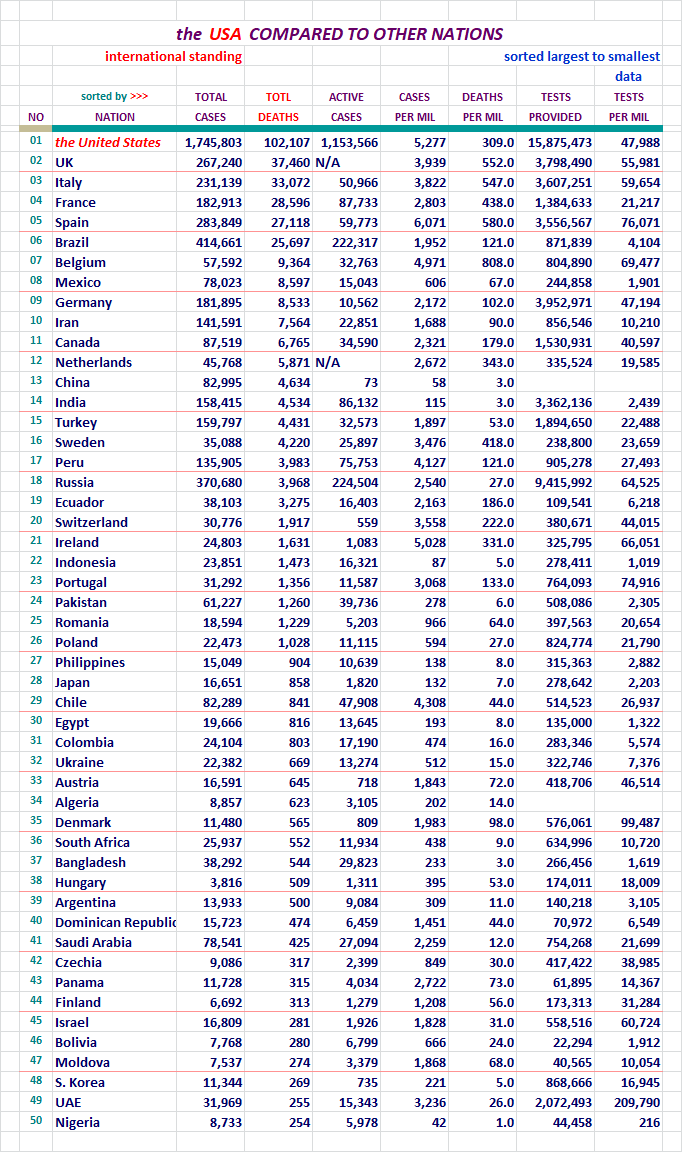
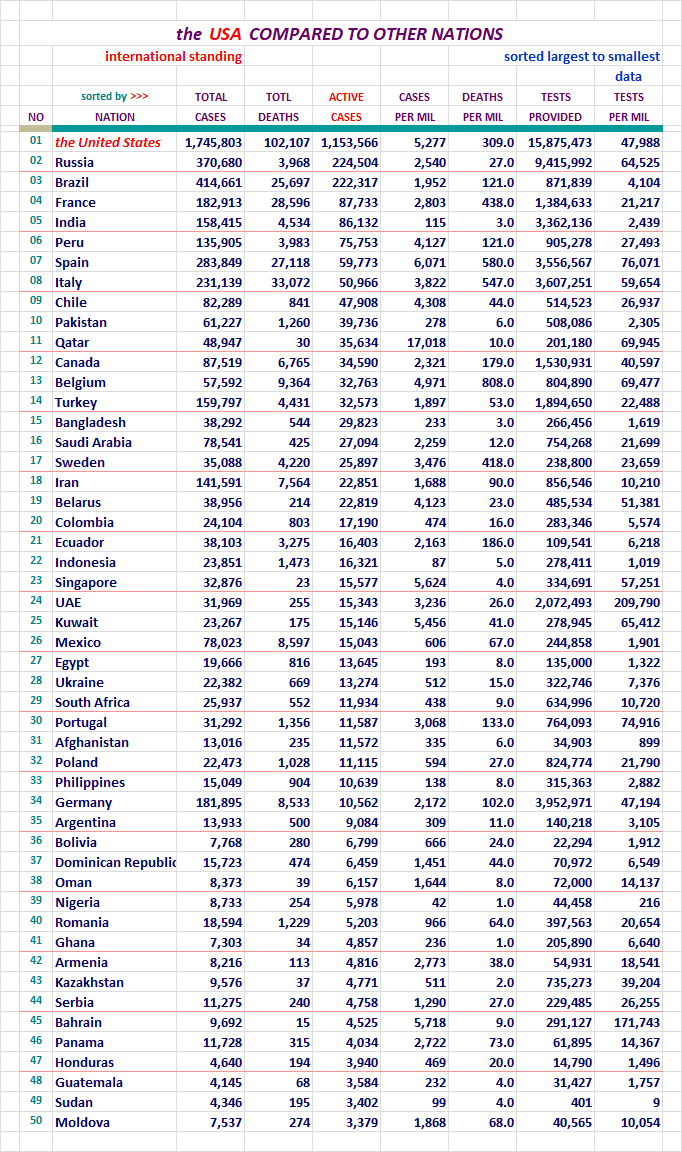
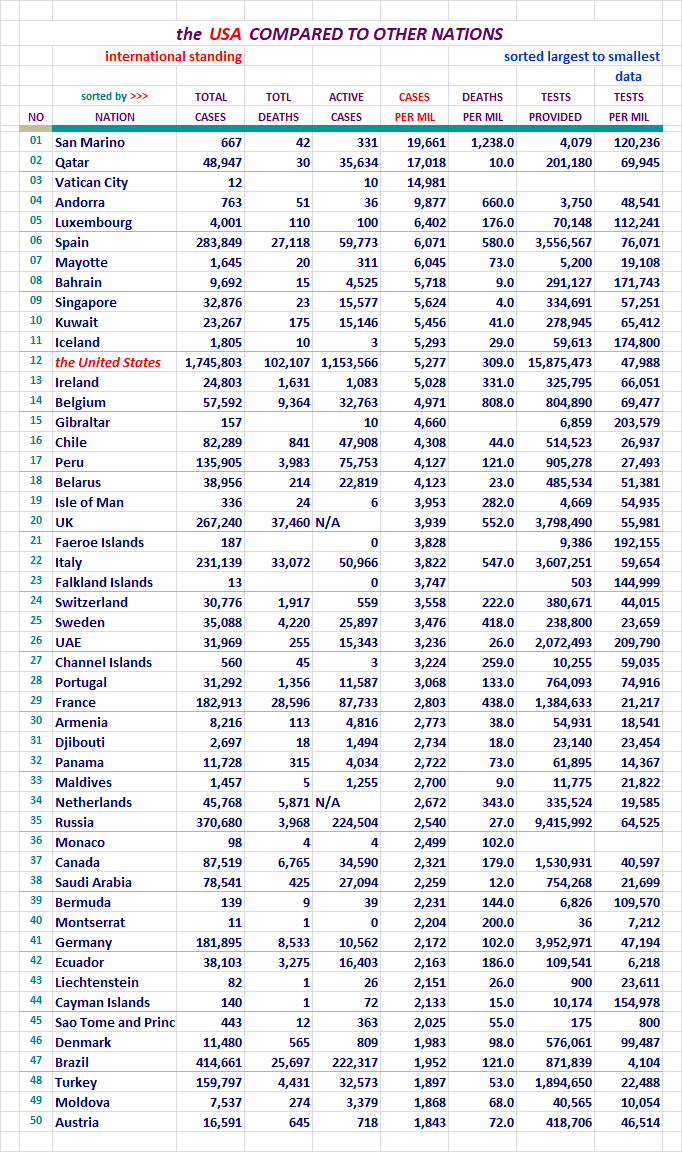
Section: 09
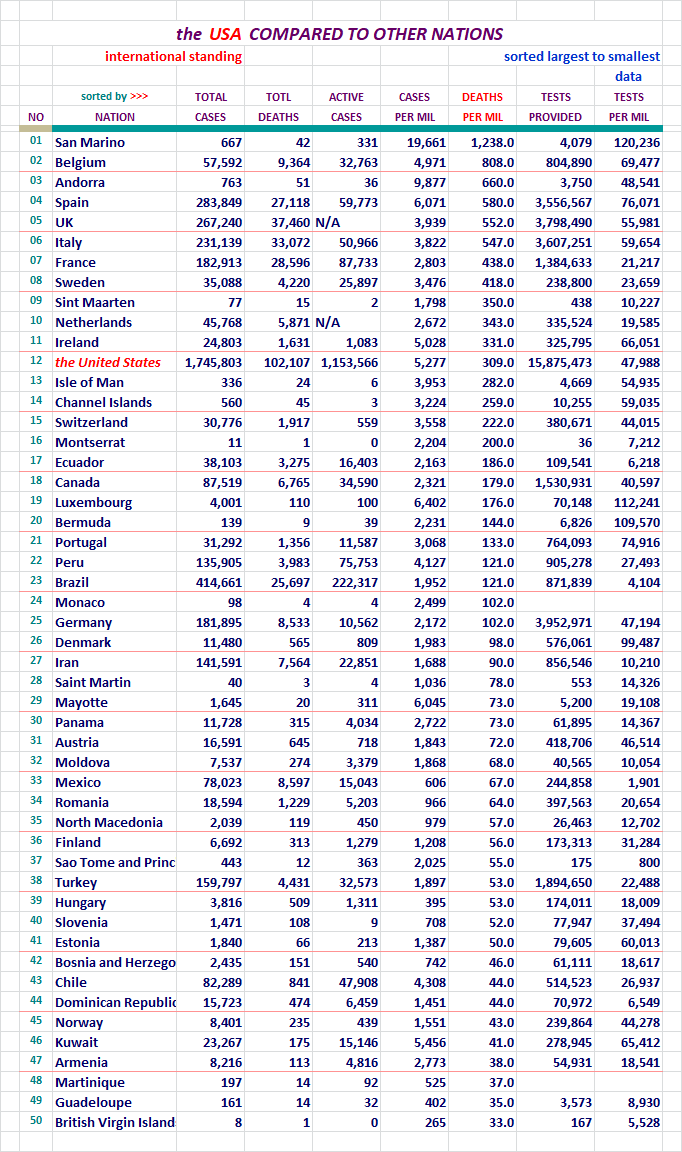
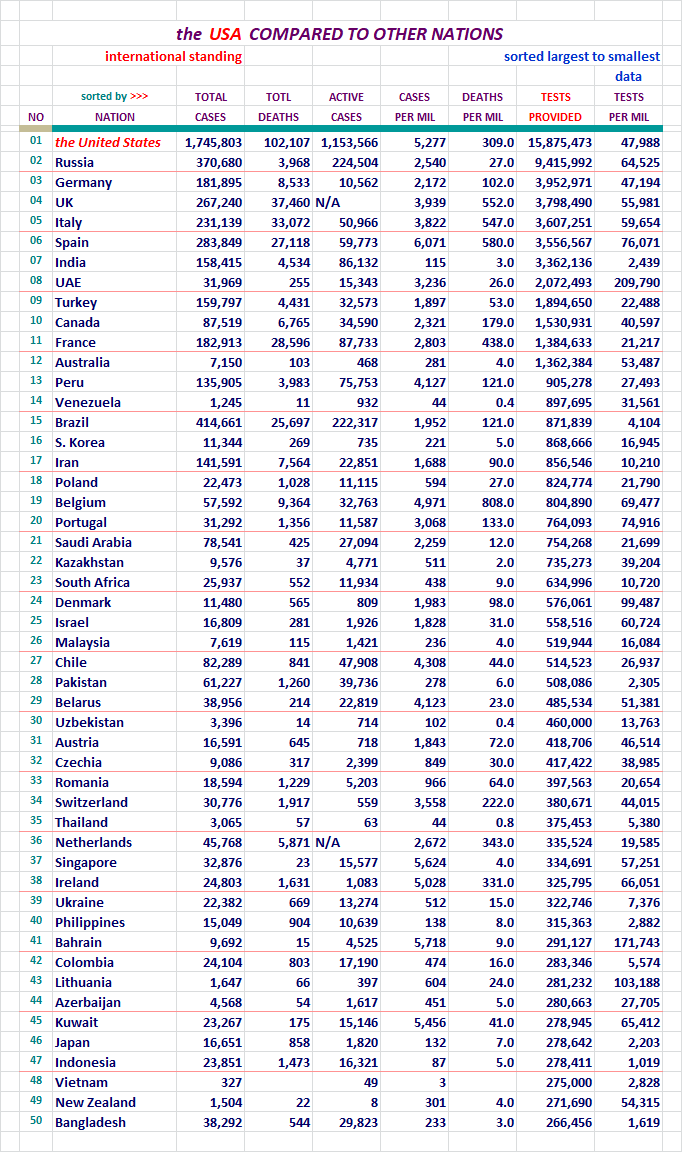
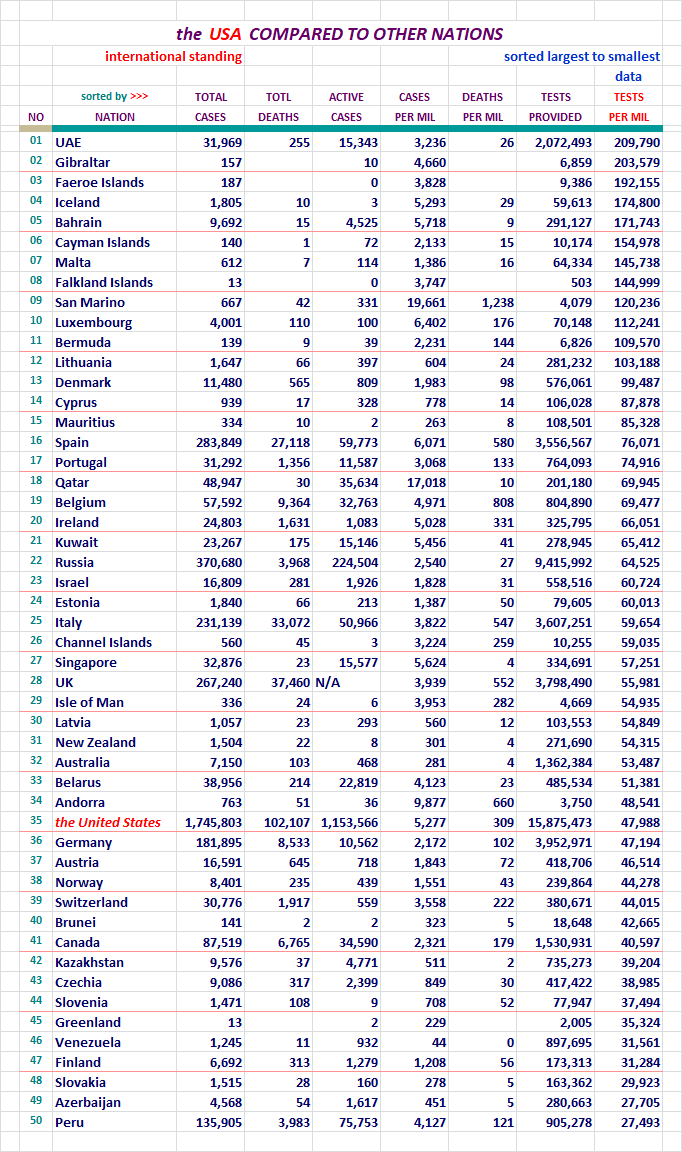
The United States, Where it Ranks With Other Nations?
Each of these pages is sorted differently. Look at the red header above
the columns to see which column was used for the sort on any given page.
The U. S. will be highlighted red here so we can find it easily in the list.
There was 215 nations on this list last night now. I didn't want to post
seven lists with 215 nations on it, so I picked the top 50. Coincidentally,
one report category had the U. S. at 41st, so it wasn't showing up on the
list with the 31 top nations on it. That wasn't the reason why I extended the
list length, but it did work out well.
I work on the nations right next to the states on my spreadsheet. The
states with the District of Columbia come in at a total of 51 lines.
I decided to keep the international reports near that length, and 50
was good enough.
Here we go... for your review.
For your review...
For your review...
For your review...
For your review...
For your review...
For your review...
We remained in the 35th position today. Seems we're testing up a storm
but it doesn't seem to move us up. I know smaller nations can look real
good compared to a large nation, by doing much fewer tets.
Section: 10
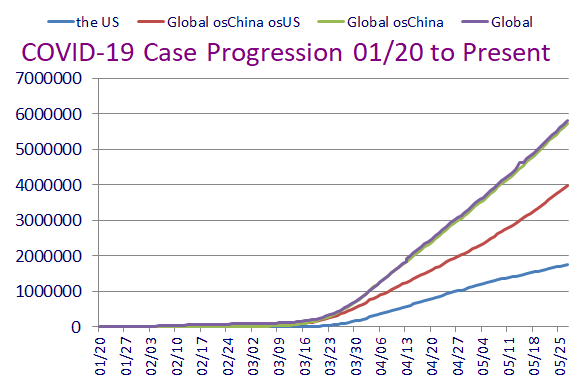
Here is what it is all about. From January 20th to the present.
This concludes our look back at yesterday's data. Take care...

Section: 11
Data for this Report Sourced From:
LINK WorldoMeters
LINK Johns Hopkins University
The Center for Systems Science and Engineering (CSSE)
LINK United States Center for Disease Control - Provisional Numbers
Listed in the order of current utilization...
LINK You are Invited to Review My COVID-19 Spreadsheet (XLSX)
There is not an XLS version available for distribution at this time.
Section: 12
Other Features:
LINK US Counties200, States & DC51, Territories & Other Entities11, Nations214,
and the CDC Provisional Counts53
Five Excel Spreadsheet datasets you can sort for your own studies...
Section: 13
Links to other resources:
I cannot vouch for these sites. Please use your own judgement.
LINK Adventist Health Coronavirus Resource Hub - Scroll down for useful info
LINK Antibiotic Vitamin, the (Vitamin D)
Good article on Vitamin D's likely role in prevention of infection. Thanks Blam.
LINK CDC Data for Download - Scroll down - Excel required. Includes death stats.
LINK CDC National Center for Health Services
Provisional deaths as determined by review of vital documents. Much lower...
LINK CDC Secondary Data and Statistics - Portal Entry / Look around
LINK Coronavirus (COVID-19) Map
LINK Coronavirus infection risk may be reduced by Vitamin D
by Former CDC Chief Dr. Tom Frieden
LINK Coronavirus Spread Quickly Around the World in Late 2019, Study Shows
the University College London Genetics Institute
LINK COVID-19 Deaths Broken Out by Thirds, 05/07/20 Map of US Counties
Very revealing display of Concentrated Death Zones - thanks hoosiermama
LINK COVID-19 First U.S. Case, Treatment, features Remdesivir
New England Journal of Medicine article
LINK Cytokine Storm, med Actemra, Physician near death saved
LINK Diamond Princess Review at 634 Case Point of Eventual 712
LINK Hydroxychloroquine Article: International Poll
Daily Mail Reports, Most Effective Treatment According to 6,000 Physicians
LINK Hydroxychloroquine Has about 90 Percent Chance of Helping COVID-19 Patients
the Association of American Physicians and Surgeons, reports 91.6% of patients improved clinically
LINK IHME - Institute for Health Matrix and Evaluation
LINK National Institutes of Health - Cornavirus (COVID-19)
LINK Nasal Irrigation is the Key, COVID-19 Related
LINK New York City - interesting breakdown, borough, age, sex
LINK On the Origin of CCP Virus, A Documentary Movie (turn up the sound)
Epoch Times: I highly recommend this very well documented report.
LINK Rt COVID-19
Calculates and displays the Rt Factor for each state. Thanks FreedomPoster.
LINK World Health Organization

Your suggestion has been incorporated into the bottom of
two sections. Sections 02 & 03.
I was wondering about the
Closing of Countries and
The Timing of the
Closures and if
That may indicate something.
.
That Most Nations agreed
on “Lockdown” would
Seem to indicate a
Coordinated effort
By a
One World entity.
Would a time line
Or Graph Be available
Or “Doable?”
.
Asking for a FRiend.
That may be a good idea.
I’m pretty maxed out with what I have time to include, when
it comes to adding in more now.
People can download the worksheet I used from the beginning.
There they can see the date I started getting numbers for
nations.
That’s about all I can offer up for now.
Many of those nations were active on 01/27. I’ve added
in many more as reports came in.
Fair enough,
Rush made a
Quip yesterday
That got me thinking.
Thanks.
Disclaimer: Opinions posted on Free Republic are those of the individual posters and do not necessarily represent the opinion of Free Republic or its management. All materials posted herein are protected by copyright law and the exemption for fair use of copyrighted works.