"Simply stated, Cuyahoga County has lost enough Democrats and independents since 2008 that, when projected across the state of Ohio, Obama’s big 2008 gains are all gone. Given how drastically voter registration has changed in Cuyahoga County since 2008, it is likely that Romney can carry the state of Ohio, which is quite contrary to what popular media polls are saying.”
That’s the analysis of Clinton Cooper at Election Insights [1], an Ohio firm that uses geographic information systems (GIS) and election data to illustrate the political landscape of the electorate.
While most pundits and media outlets are focused on the latest polls, flitting from registered voters to probable voters to undecided voters to disaffected voters to Karl Rove’s trusty whiteboard, Cooper claims the polls are inaccurate and that there’s a more scientific method for determining both voter turnout and the probable outcome of the election. In an exclusive interview with PJ Media, he said that his “simple model estimation shows that with certainty, current polling estimations in Ohio are based on outdated or ill-informed assumptions resulting in wrong conclusions.”
Cooper has been involved in local and regional government and politics for the last 10 years, serving in a policy advisory role for several government agencies and consulting firms in Ohio. He has a master’s degree in city and regional planning from The Ohio State University and 10 years of progressive experience in geographic information systems and statistical modeling. His company, based in northeast Ohio, blends geographic information systems with predictive statistical modeling to help candidates develop and implement winning campaign strategies.
After hearing a report that Ohio voter registration rolls have shrunk by 490,000 [2], Cooper wanted to see if media reports that Obama is enjoying a wide lead in the state would stand up to a statistical analysis based upon actual voter registrations and historical voting patterns.
He decided to analyze Cuyahoga County, which includes Cleveland and is the state’s most populous county. He says it’s representative of the state because “it has a large enough number of registered voters and you can statistically determine how many total votes each candidate will get in Ohio based on how many votes are cast for each party in Cuyahoga County.” In fact, from 1980 to 2008 an average of 17% of the total Democrat votes cast in Ohio presidential elections were cast in Cuyahoga County. In recent years, this has declined (to around 15.6% in 2008). During the same time period, an average of 9.3% of the total Ohio Republican ballots were cast in Cuyahoga County. That number declined to 7.5% in 2008. Since 1980, the average voter turnout for Cuyahoga County is 64.57%. Obviously, this is a fairly significant sample size.
Cooper found that Cuyahoga County has 208,207 fewer total registered voters in 2012 compared to 2008. The county has lost 48,872 Democrat-registered voters and 194,199 independent-registered voters. The difference — and this is significant to Cooper’s prediction — is made up by a surprising gain of 34,864 Republican voters since the 2008 election.
While undoubtedly the Great Ohio Republican Sweep of 2010 [3] contributed to the increased Republican voter registration in Cuyahoga County, Mitt Romney’s campaign strategy during the Ohio primary this year can also be credited with some of the gains. ABC News reported [4] earlier this year:
The campaign has been fielding teams to focus on growing Romney’s support in the central part of the state around Columbus; the northeast, including Cleveland and its suburbs; the northwest region around Toledo; Cincinnati and Dayton in the southwest; and Ohio’s sixth congressional district that hugs the border with Pennsylvania and West Virginia.
There was a clear focus on Cuyahoga County and other urban areas of the state and Romney’s efforts paid off. If you watched the Fox News coverage on Super Tuesday, you waited until late into the night for Ohio’s urban counties to report their returns. And you suffered through Karl Rove torturing our beloved “Cuyahoga” all night, calling it “ky-OH-guh” (it’s ky-uh-HO-guh, Karl). Though Rick Santorum led most of the night, Romney gobbled up all but one of the urban counties [5] (he lost Lucas County by a couple hundred votes) and won the state. Though it was a discouraging moment for Ohio conservatives and some declared it was proof that Romney is a liberal, this strategy may turn out to be what helps Romney win in November.
Clinton Cooper says that the key to predicting a candidate’s vote share is to determine not just the Republican and Democrat votes, but also the share of the independent vote the candidates will receive. A statistical analysis can estimate voter percentages based on historical voter turnout. He explained:
The first step in this analysis is to take the number of registered voters by party, then proportion the total votes received for each candidate by the turnout percentage on Election Day.
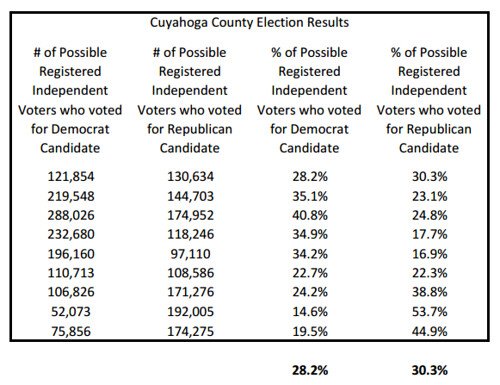
He calculated that 35.1% of total registered independents in Cuyahoga County (approximately 219,548) voted for Obama. He determined that 144,703 independents (23.1%) voted for McCain in 2008. According to Cooper:
This same procedure can be performed for each election since 1980 showing that on average, 28.2% of the registered independents historically vote Democrat and 30.3% historically vote Republican. The 2012 vote totals for Romney and Obama can be predicted using this historical 64.57% average turnout for elections since 1980. The projection is that Obama will receive 345,693 votes to Romney’s 212,178 in Cuyahoga County.
 [6][
[6][
Cooper then crunched the numbers (see the spreadsheet at his website [7]) based on historical voting registration and election results in Cuyahoga County and concluded:
Based on this, the prediction can be made that in 2012, Obama will receive 2,215,978 votes and Romney would win 2,829,037 votes if 7.5% of the total votes cast for Republicans were cast in Cuyahoga County. Romney would win 56.1% of Ohio’s vote to Obama’s 43.9%, with a turnout percentage of 64.67%. This analysis includes the assumption that total turnout will be much lower than past Ohio elections, confirming reports that overall enthusiasm is down for this presidential election compared to 2008.
For those keeping score at home, that’s a 12.2% advantage for Romney statewide.
Acknowledging that not everyone will agree with his assumptions of lower voter turnout this year and a Republican split at 2008 levels, he also calculated the numbers based on 2008 voter turnout [8]. Romney still wins Ohio based on 2008 numbers:
Even if the same turnout as in 2008 is used and the same vote split of independents for Obama and Romney in 2012 as it was for Obama and McCain in 2008, then Romney would win 50.36% of the vote to Obama’s 49.64%.
Cooper cautions that this is a simple model. It is based on historical voter trends, using voter registration and past election results as the primary means of predicting the winner. The model that he uses to advise campaigns is much more sophisticated, analyzing 25 to 30 variables. But he says that the trajectory indicates serious problems for President Obama in Ohio:
The analysis does not guarantee that Romney will win Ohio by 12%, but with certainty, the data does support that the changes in voter registration in Cuyahoga County have made it extremely difficult for Obama to win Ohio.
In another indication that things may not be going Obama’s way, the Washington Examiner reported on Thursday [9] that requests for absentee ballots have been showing gains in Romney’s direction:
While in 2008, 33 percent of the 1,158,301 absentee ballots went to Democrats and just 19 percent to registered Republicans, a 14-point gap, this year 29 percent are being requested by Democrats and 24 percent by Republicans, a five-point gap.
And in a sign that the enthusiasm of 2008 voters is depressed, just 638,997 absentee ballots have been requested, according to American Majority Action [10], which culled the statistics together from Ohio college professors who are tracking the state’s absentee ballots used for early voting. The group provided Secrets with the details.
Even more dramatic, while the GOP has cut the Democratic advantage in early voting throughout the state, the changes favoring the Republicans in certain counties has been huge. In Franklin County, home to Columbus, for example, a 2008 Democratic advantage of 5 percent is now a 5 percent GOP advantage. In Cuyahoga County, home to Democratic Cleveland, the GOP has shaved six points off the Democrat’s 2008 advantage. And in Hamilton County, home to Cincinnati, Republicans have expanded their 2008 advantage to 13 percent.
This absentee trend and Cooper’s analysis should cast serious doubt upon the gloomy picture the pollsters have painted of the Romney campaign efforts in Ohio in recent weeks.
President Obama may be in for a very unpleasant November surprise.