Interesting.
I know correlation is not causality, and the article itself hints at that, but it is still interesting data. Many things could be driving the results though ...ranging from solid morals coupled with the married pair having the same set of good values (a key indicator for a good marriage), all the way to something most people don’t like to discuss, which is choice. The more choice a person has the more likely he or she (but mostly for men since a woman who’s not good looking can still have many men) will have multiple partners ...unless, of course, one adds the aforementioned good moral values. It would be great to see an analysis that also controls for looks/confidence ...I think we can all recall colleagues in high school and college who were virgins, but not out of moral standards/choice.
Being on the extreme right side of the graph, that explains my 3 failed marriages and 2 long term live-in situations... although I’m going on 11 years with the latest long term live-in.
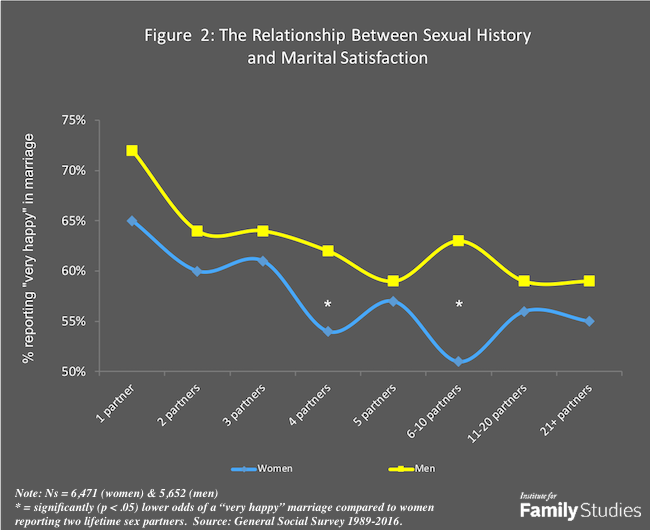
What IS it about the 6-10 group that causes such a dip??
Show me a chart with 6,7,8,9,10 ect so I can see the actual slope trend.