Posted on 04/07/2020 2:35:20 AM PDT by DoughtyOne
PING LIST
Some of you have asked to be placed on the COVID-19 Update Ping List.
Those who ask are placed on the list before the next Update is posted.
If a person has expressed an appreciation for the data I'm presenting, I have
added that person to the Ping List.
Some folks don't like to be on ping lists, and I'd like to remind you that I
don't mind if you would rather I remove your name from the list
Others, ask away, you're only an easy request away from being on the list
COVID-19 Update
As of 04/06/2020 22:23 PDST (taken at 23:59)
Good morning everyone.
Thank you for stopping by to check out this Update.
Links to other resources: Near the bottom of this post.
Commentary2: Interesting Tid-bits (hopefully)
The Issue of New Cases Leveling Out or Dropping
Lets talk about this for a moment.
Up front, we have to mention there are two bodies of people we need to address
on this topic. There is the global community of which we are a part, and then
there is the U. S.
Looking back on how this disease traveled around the world, it's important to
take into consideration that the global community (ouside China) and (also)
outside the United States, contracted the disease before the U. S. became widely
infected
That global community announced it's 2,700th case on 02/25. The United States
documented it's 2,700th case on 03/14. This means it could be stated that the
United States is about 18 days behind the global progression.
That kind of logic can get us in trouble if you'll remember how the numbers
looked for Spain, Italy, Germany, and France, presented below. They all started
out with numbers close to each other on 02/20, but as time passed some of their
case numbers went considerably higher than the case numbers for some of the
others.
What I'm trying to express, is that we trail the global community, but we can't
be certain by how much. So if they are flattening out, would that hit us right
away? I would think probably not, but you just can't be sure.
Lets look at some numbers.
Here: (case growth)
-
         Global    Global (EC)
      Excluding          Minus             the
          China      the U. S.           U. S.
03/29    58,481         38,955          19,826
03/30    62,463         40,868          21,595
03/31    73,836         48,832          25,004
04/01    77,502         50,405          27,097
04/02    78,548         49,710          28,838
04/03   102,458         69,559          32,899
04/04    84,954         51,111          33,843
04/05    71,866         46,465          25,401
04/06    72,272         41,534          30,738
From looking at those, it does appear to me that the global community is seeing
In the United States we saw 25,401 new case reported the day before yesterday.
That was a nice drop off from the two days befdore. Then yesterday the numbers
rose back up to 30,738.
The United States will trail the global community at large, because the global
community contracted the problem before we did. I wouldn't put too much
stock in how many days prior to us they reached certain milestones though.
We've gotten fairly earnest about social distancing and sheltering in place.
Those things may help us cut the time it takes us to see the postive direction
here, we seem to be seeing for them now.
Stay tuned...
Has Sweden Gotten it Right, or is it Simply Becoming a Time Bomb
Sweeden adopted a plan that institued social distancing and continuing to work,
through the virus. They do take special measures with compromised people, the
elderly and others with known problems. This kept their economy largely in tact.
Those who can are encouraged to work remotely.
Other nations around Sweeeden aren't sure they like that. Let me rephrase that.
The last I heard they didn't like it.
Let's see if we can gain some meaning from Sweeden compared to it's neighbors.
DATE      SWEEDEN      DENMARK      FINLAND      NORWAY
-
02/21           1            0            1           0
02/26           2            0            1           1
03/02          15            4            6          25
03/07  --     161  --       27  --       19  --     156
03/12         599          617           59         702
03/17       1,196        1,024          321       1,471
03/22       1,934        1,514          626       2,385
03/27  --   3,069  --    2,700  --    1,041  --   3,771
04/01       4,947        3,290        1,446       4,877
04/06       7,206        4,875        2,176       5,865
-
Deaths        477          187           27          77
This has particularly interested me, because this is more the direction I would
Now, can that be sustainable, bearing the weight of the deaths? I'm not the only
jury member on that case. All in all, this is basically how we handle the flu
every single year. Tens of thousands die, and we keep right on trucking along.
There will be a lot to hash out when COVID-19 has fully come and gone.
I'll keep an eye on this dynamic, and add to the above numbers daily.
The Following Addresses the Numbers Here in
the United States of America
Yesterday's Growth Rate Rose Back Up
Declared Cases in the United States
             EOD    DAY'S  INCR'SD
DATE       CASES    GRWTH   GROWTH
-
03/20     19,624    5,374      539
03/21     26,747    7,123    1,749
03/22     35,206    8,459    1,336
03/23     46,442   11,236    2,777
03/24     54,893    8,789   -2,427
03/25     60,197   13,966    5,177
03/26     85,991   16,794    2,828
03/27    104,839   18,848    2,054
03/28    124,665   19,826      978
03/29    143,025   18,360   -1,466
03/30    164,620   21,595    3,235
03/31    189,624   25,004    3,409
04/01    216,721   27,097    2,093
04/02    245,559   28,838    1,741
04/03    278,458   32,899    4,061
04/04    312,237   33,779      899
04/05    337,638   25,401   -8,378
04/06    368,376   30,738    5,337
You'll note the growth figure dropped by 8,378 cases the day before yesterday
Fatalities, Recoveries, Resolved, & Serious/Critical Cases
in the United States
                                               ACTIVE     SERIOUS
DATE       FATAL       RECOV      RESOLV        CASES    CRITICAL
-
03/20        252         152         404       19,220
03/21        329         176         505       26,242
03/22        396         178         574       34,632
03/23        428         178         606       45,836
03/24        581         354         935       54,296
03/25        753         619       1,372       67,825
03/26      1,301       1,868       3,169       82,822
03/27      1,704       2,622       4,326      100,513
03/28      2,229       3,231       5,460      119,205
03/29      2,488       4,562       7,050      135,975
03/30      3,170       5,507       8,677      155,943
03/31      4,055       7,251      11,306      178,318
04/01      5,112       8,878      13,990      202,731       5,005
04/02      6,095      10,403      16,498      229,061       5,421
04/03      7,403      12,283      19,686      258,772       5,787
04/04      8,454      14,825      23,279      288,958       5,870
04/05      9,620      17,977      27,597      310,041       8,702
04/06     10,943      19,810      30,753      337,623       8,983
It's hard to ignore the fatalities adding up. At the same time we have a lot of
Our Slice of the COVID-19 Pie Continues to Grow
Once again, lets take a moment to address the U. S. portion of the
global declared cases.
The U. S. has roughly 4.252% of the global populace. There are two
figures I'm tracking with regard to this, the Declared Cases and the
Active Cases.
Here is what the movement for those two categories looks like.
       DECLARED     DAY'S     ACTIVE     DAY'S
DATE      CASES      CHGE      CASES      CHGE
-
03/20    7.125%    1.297%    10.934%    1.552%
03/21    8.704%    1.579%    13.000%    2.066%
03/22   10.377%    1.673%    15.343%    2.343%
03/23   12.170%    1.793%    17.411%    2.068%
03/24   13.053%    0.883%    18.369%    0.958%
03/25   14.657%    1.604%    20.190%    1.821%
03/26   16.140%    1.483%    21.454%    1.264%
03/27   17.530%    1.390%    22.920%    1.466%.
03/28   18.742%    1.212%    24.126%    1.206%
03/29   19.762%    1.020%    25.289%    1.163%
03/30   20.936%    1.174%    26.777%    1.488%
03/31   22.045%    1.109%    27.885%    1.108%
04/01   23.110%    1.065%    29.120%    1.235%
04/02   24.160%    1.050%    30.482%    1.362%
04/03   24.886%    0.726%    31.057%    0.575%
04/04   25.935%    1.049%    32.400%    1.343%
04/05   26.464%    0.529%    32.866%    0.466%
04/06   27.324%    0.860%    34.153%    1.287%
These percentages are still troublesome. If the global body of the populace does
The Following Addresses the Global Numbers
without Mainland China
Global Cases Increased to Record Levels Today, Outside M/L China
Yes, back to still more numbers...
               EOD      DAY'S   INCR'SD
DATE         CASES     GROWTH    GROWTH - compared to day before
-
03/20      194,148     30,824     5,185
03/21      225,932     31,784       963
03/22      257,820     31,888       104
03/23      297,172     39,352     7,464
03/24      341,530     41,462     2,110
03/25      390,378     48,848     7,386
03/26      451,006     60,628    11,780
03/27      516,124     65,118     4,490
03/28      583,107     66,983     1,865
03/29      641,588     58,481    -8,502
03/30      704,051     62,463     3,982
03/31      777,887     73,836    11,373
04/01      855,389     77,502     3,666
04/02      933,937     78,548     1,046
04/03    1,036,395    102,458    23,910
04/04    1,121,349     84,954   -17,054
04/05    1,193.215     71,866    13,088
04/06    1,265,487     72,272       386
It's not quite as obvious here, that the global growth in declared cases seems
Fatalities, Recoveries, Resolved, Active, and Serious/Crical Cases
Globally, Excluding M/L China
                                               ACTIVE     SERIOUS
DATE       FATAL       RECOV      RESOLV        CASES    CRITICAL
-
03/20      8,110      16,393      24,503      169,645
03/21      9,740      19,995      29,735      196,197
03/22     11,305      25,485      36,790      221,030
03/23     13,060      28,470      41,530      258,538
03/24     15,347      35,256      50,603      290,927
03/25     17,643      40,467      58,210      332,168
03/26     20,785      48,084      68,869      382,137
03/27     24,466      56,801      81,267      434,857
03/28     27,522      64,777      92,299      490,808
03/29     30,714      76,342     107,056      534,532
03/30     34,515      89,989     124,504      579,547
03/31     39,052     102,121     141,163      636,724
04/01     43,949     118,092     162,041      693,348
04/02     49,838     135,204     185,042      748,895
04/03     55,611     150,014     205,625      839,770
04/04     61,466     170,309     231,775      889,574      41,993
04/05     66,183     185,921     252,104      941,111      45,633
04/06     71,485     208,635     280,120      985,367      47,201
Big numbers... they speak for themselves.
Special Section on France, Germany, Italy, and Spain
Case growth.
Lets Look at Some Numbers in Five Day Increments:
DATE       FRANCE      GERMANY        ITALY       SPAIN
-
02/20          12           16            3           2
02/25          14           18          322           9
03/01         100          117        1,128          76
03/06  --     653  --      670  --    4,636  --     401
03/11       2,284        1,966       12,462       2,277
03/16       6,650        7,272       27,980       9,942
03/21      14,485       22,364       53,578      25,496
03/26  --  29,566  --   43,938  --   80,589  --  57,786
03/31      52,819       68,180      105,792      94,417
04/05      93,780      100,123      128,948     131,646
04/06      98,984      103,375      132,547     136,675 > 1 day not five
I'll continue to monitor these nations and document the numbers here.
The Following Addresses the Global Numbers
including Mainland China*
Mainland China numbers make up 00.32% of today's cases globally
Nations With Lots of Cases
At the end of the day on 04/04/2020, there are:
 1 nation(s) with 300,000 plus (take a bow...)
 3 nation(s) with 100,000 to 199,999
 4 nation(s) with  50,000 to  99,999
 3 natiom(s) with  20,000 to  49,999
 6 nation(s) with  10,000 to  19,999
 6 nation(s) with   5,000 to   9,999
38 nation(s) with   1,000 to   4,999
There are currently 61 nations with a 1,000 count or above...
A Look at Declared, Resolved, and Active Cases, Includes M/L China
End of day figures follow:
           DECLAR     DAY'S  RESOLVED    DAY'S   PCT DEC    ACTIVE
DATE        CASES    GROWTH     CASES   GROWTH  CS RESOL     CASES
-
03/20 -   275,434 -  30,911 -  99,655 -  3,590 - 36.181% - 175,779
03/21     307,280    31,846   105,425    5,770   34.309%   201,855
03/22     339,259    31,979   113,540    8,115   33.467%   225,719
03/23 -   381,621 -  42,362 - 118,369 -  4,829 - 31.017% - 263,252
03/24     423,121    41,500   127,538    9,169   30.142%   295,583
03/25     472,109    48,998   136,178    8,640   28.845%   335,931
03/26 -   532,788 -  60.679 - 146,749 - 10,571 - 27.544% - 386,039
03/27     598,070    65,282   159,533   12,784   26.675%   438,537
03/28     665,164    67,094   171,077   11,544   25.720%   494,087
03/29 -   723,740 -  58,576 - 186,060 - 14,983 - 25.708% - 537,680
03/30     786,291    62,551   203,926   17,848   25.933%   582,383
03/31     860,181    73,890   220,713   16,085   25.659%   639,468
04/01 -   937,783 -  77,602 - 241,591 - 20,878 - 25.762% - 696,192
04/02   1,016,401    78,618   264,935   23,344   26.066%   751,466
04/03   1,118,921   102,520   285,706   20,771   25.534%   833,215
04/04 - 1,203,923 -  85,002 - 312,068 - 26,362 - 25.931% - 891,855
04/05   1,275,856    71,933   332,513   20,445   26.062%   943,343
04/06   1,348,184    72,328   359,618   27,105   26.674%   988,566
We have established that for the time being, the global community has seen a
Look at the percentage of resolved cases. It has finally broken out of the
mid to upper 25.500% range. Here's to hoping we'll see that figure grow over
coming days.
Fatalities, Recoveries, Resolved, Active, and Serious/Crical Cases
Globally, Including M/L China
                                               ACTIVE     SERIOUS
DATE       FATAL       RECOV      RESOLV        CASES    CRITICAL
-
03/20     11,399      88,256      99,655      175,779
03/21     13,049      92,376     105,425      201,855
03/22     14,706      98,834     113,540      225,719
03/23     16,563     101,806     118,369      263,252
03/24     18,919     108,619     127,358      295,583
03/25     21,308     114,870     136,178      335,931
03/26     24,077     122,672     146,749      386,039
03/27     27,761     131,772     159,533      438,537
03/28     30,852     140,225     171,077      494,087
03/29     34,018     152,042     186,060      537,680
03/30     37,820     166,088     203,908      582,383
03/31     42,354     178,359     220,713      639,468
04/01     47,261     194,330     241,591      696,192
04/02     53,160     211,775     264,935      751,466
04/03     58,937     226,769     285,706      833,215
04/04     64,795     247,273     312,068      891,855      42,288  ch 295
04/05     69,514     262,999     332,513      943,343      45,898  ch 265
04/06     74,816     284,802     359,618      988,566      47,412  ch 211
It's sad to see so many deaths, but if we look at the casualties around the
Watched pot and all that applies here. Be patient.
Population Saturation
Here are figures revealing how many people in each population
base represent one case. I'm also showing what percent of each
population base is infected at this time.
ENTITY              PER 1 CASE  DY BEF YES  DY BEF THT    CHG YEST  CHG DY BEF
-
Globally      :          7,860       8,237       8,712        -377        -475
Outside China :          7,885       8,256       8,735        -371        -439
The U. S. A.  :            979       1,066       1,143         -87         -77
-
ENTITY         INFECTION LEVEL  DY BEF YES  DY BEF THT    CHG YEST  CHG DY BEF
-
Globally      :       00.0120%    00.0114%    00.0107%    00.0006%    00.0007%
Outside China :       00.0154%    00.0147%    00.0139%    00.0007%    00.0008%
The U. S. A.  :       00.1022%    00.0938%    00.0875%    00.0084%    00.0063%
Compared to the other entities, the U. S. figures still don't look good. Each
This concludes our look back at yesterday's data. Take care...
Data for this Report Sourced From:
LINK Johns Hopkins University
The Center for Systems Science and Engineering (CSSE)
LINK WorldoMeters
LINK You are Invited to Review My COVID-19 Spreadsheet (XLSX)
There is not an XLS version available for distribution at this time.
Other Features:
LINK US States DC51, Territories5+, and Counties200
Excel Spreadsheet with Alphabetical and Numerically descending Cases
Links to other resources:
I cannot vouch for these sites. Please use your own discression.
LINK Adventist Health Coronavirus Resource Hub - Scroll down for useful info
LINK CDC Secondary Data and Statistics - Portal Entry / Look around
LINK Coronavirus (COVID-19) Map
LINK COVID-19 First U.S. Case, Treatment, features Remdesivir
New England Journal of Medicine article
LINK Diamond Princess Review at 634 Case Point of Eventual 712
LINK earlyAlert
LINK Hydroxychloroquine Article: International Poll
Daily Mail Reports, Most Effective Treatment According to 6,000 Physicians
LINK IHME - Institute for Health Matrix and Evaluation
LINK National Institutes of Health - Cornavirus (COVID-19)
LINK New York City - interesting breakdown, burough, age, sex
LINK World Health Organization
This is a quote from a youtube channel called donze52
It is based in McCook, Nebraska
I found it of interest.
“Jim Jackle
Jim Jackle
6 days ago
Here is how I cured this covid crap. There aren’t many tests in Oklahoma, but I’m 99.9% sure I had this, because the symptoms are identical to what people reported in Europe. I had a low grade fever and runny nose for 2 weeks. I just thought I had a bad cold and nothing else.
After 2 weeks the fever broke, and I felt back to normal, but then the next day all hell broke loose and this virus attacked my lungs like nothing I’ve ever seen. I was gasping for air and felt like I was drowning on the fluid it was causing. It was going balls to the wall apesht crazy in my airways. The attack happened so fast that I barely had time to think, but I ran in and got my hair dryer, and started breathing in the hot air to slow the virus replication.
This virus was replicating like a Mother F’er, but that hot air slowed it down where I wasn’t suffocating.
After I kicked its ass with my hair dryer and slowed the replication and the fluid it was causing, I put a space heater in my car and stayed in there for 2 days.
I used the car, because it was a small space that could easily be heated above 95 degrees. After 48 hours in the car/oven, all of the virus was killed out of my airways and I was cured. Fortunately I had been studying information about this virus and knew how to kick its ass with heat.
Lab tests were done on this virus in India that showed the virus was killed out at an air temperature above 95 degrees for 48 hours.
Another test done in Europe showed this virus replicated the fastest at an air temperature of 47.6 degrees.
Interestingly my attack happened in an air temp of 50 degrees. Had I not studied this virus and knew about how it behaved, I would have stayed in that 50 degree air and this thing would have kept replicating and killed me.
This dam thing reminds me of a bioweapon, because it attacked and replicated at a speed like no other virus I have seen. If you look at the earth, this virus is rampaging in a narrow band around the world where temps are between 41-51 degrees.
If you go below that band where temps are warmer, they have a few cases, but it’s nothing like it is in places like Northern Italy, Spain and NY where temps are hovering in the 40’s to low 50’s.
Anyway, the objective is to kill this virus and so far the doctors don’t have a pill to kill it, so you have to use a different weapon. If you think about it, mother nature uses hot air to kill viruses. Every year the air warms and the hot air enters people’s nasal passages and destroys the viruses, which ends our flu and cold season. It doesn’t matter if the sun warms the air, a hair dryer warms the air, or a space heater warms the air, it’s gonna have the same virus killing effect.
- - - - - - - - - - - - - - - - - - - - - - - - - - - - -
The above may be a joke. It may not. However, if it possibly could work, it may be even more important to get this out than the zelenko HCQ protocol. In case the HCQ supply vanishes, and tonic water (quinine) is pulled from the store shelves.
I too noticed that upswing from Sunday to yesterday. Was that driven mainly by New York reporting?
Please keep me on the list.
:)
Thanks for your update.
On Wednesday April 1 I began tracking the number of ‘serious, critical’ cases being reported in the USA.
These are the people who may likely die in the next few days.
If the ‘serious, critical’ number goes up, we will likely see more deaths. On the other hand if the various drugs being tested are effective in treating the virus, the ‘serious, critical’ number should go down.
Here are the numbers:
Apr 1 Wed 5005
Apr 2 Thu 5421
Apr 3 Fri 5787
Apr 4 Sat 8206
Apr 5 Sun 8702
Apr 6 Mon 8879
1, 03/01/20, 86, -
2, 03/02/20, 105, 22.1%
3, 03/03/20, 127, 21.0%
4, 03/04/20, 159, 25.2%
5, 03/05/20, 233, 46.5%
6, 03/06/20, 338, 45.1%
7, 03/07/20, 433, 28.1%
8, 03/08/20, 554, 27.9%
9, 03/09/20, 754, 36.1%
10, 03/10/20, 1037, 37.5%
11, 03/11/20, 1312, 26.5%
12, 03/12/20, 1663, 26.8%
13, 03/13/20, 2174, 30.7%
14, 03/14/20, 2952, 35.8%
15, 03/15/20, 3774, 27.8%
16, 03/16/20, 4661, 23.5%
17, 03/17/20, 6496, 39.4%
18, 03/18/20, 9415, 44.9%
19, 03/19/20, 14250, 51.4%
20, 03/20/20, 19624, 37.7%
21, 03/21/20, 26747, 36.3%
22, 03/22/20, 35206, 31.6%
23, 03/23/20, 46442, 31.9%
24, 03/24/20, 55231, 18.9%
25, 03/25/20, 69197, 25.3%
26, 03/26/20, 85991, 24.3%
27, 03/27/20, 104839, 21.9%
28, 03/28/20, 124665, 18.9%
29, 03/29/20, 143025, 14.7%
30, 03/30/20, 164620, 15.1%
31, 03/31/20, 189624, 15.2%
32, 04/01/20, 216721, 14.3%
33, 04/02/20, 245559, 13.3%
34, 04/03/20, 278458, 13.4%
35, 04/04/20, 312237, 12.1%
36, 04/05/20, 337638, 8.1%
37, 04/06/20, 368376, 9.1%
Ping
Great work, thanks!
Ping list please.
Bless you for your work as ICU nurse.
Thank you for doing these analyses.
I have only looked at worldwide numbers, because of the fact that until the virus is wiped out everywhere, we will remain in danger of a reemergence here.
We are entering spring. Ordinary cold viruses become less active in the spring and summer; will this killer cold virus behave like its benign cousins? If it exhibits the same kind of seasonality, I expect to see cases drop off in the northern hemisphere, while they are picking up in the southern hemisphere. We’ll know if this is happening within a few weeks. The scenario of a virus sweeping through the southern hemisphere is very concerning, given the poor healthcare systems that exist, especially in Africa and to a large extent in South America.
I won’t post my graphs today, but I will note that the number of new cases is not increasing rapidly over the last few days, but it may only be because of the delay in testing that happens over the weekend. Another item I noticed is that the percent of active cases has dropped slightly and steadily since April 4, driven by both deaths and recoveries. The death rate has creeped up to 5.59%.
One last comment: influenza is something that most people do not pay much attention to, unless it kills someone in their immediate family. However, a lot of research dollars are invested in studying influenza. We have a massive vaccination program in place to try to decrease deaths and illnesses. Our pandemic program was instituted primarily to watch out for novel influenza viruses. A few years ago, when one of the hats I wore was Influenza Expert for my institution, there was a cluster of influenza deaths in Maryland. So many people came to my office to ask if a new pandemic was emerging, and I was able to reassure them that it was not a new pandemic. Covid-19, however... from the days of the first reports of an illness in China, I recognized that this virus has every characteristic of a pandemic capable pathogen. And here we are.
Thanks for the great information. That’s very interesting about Sweden, I didn’t know that. I also would have thought that would be the better approach but after looking at the numbers you posted, perhaps not.
Sweden certainly has a lot more cases than her neighbors, so I had to look up the population of the three countries. Sweden has a little less than double those of her neighbors. The other three have a little more than 5 million, while Sweden has about nine million. So it looks like the number of cases aren’t a whole lot different percentage-wise, except for Finland who has half the amount.
But what I find interesting is Sweden’s fatality rate of those with the virus is about 6.6%. Denmark fatality rate is about half that, while Finland and Norway have a fatality rate hovering around 1%.
So rather than look at what Sweden is doing I really wonder what Finland is doing. They have half of the number of cases based on her population than her neighbors. And the fatality rate of those cases is around 1%.
If I’m reading it all correctly.
I respect your opinion, but I have a slightly different view. I can not see where Sunday was an anomaly. See the chart below with the last four Sundays highlighted. I DO NOT see anomalies in the three prior Sundays on the chart. Last Sunday AND Monday both are notably lower than the previous Thursday and Friday. That pattern does not appear in the prior three weekends. If you see it differently from that chart, please point out exactly how the Sundays are different. I just don't see it.
Regarding temperatures, I tend to believe you are correct. I live in the south and our temps have been running in the 70's and 80's for the last 10 to 14 days. Our cases have not leveled off, albeit we started from a small number and are a relatively small state (4.6M). Then, I look at NY & NJ and that seems to be where the new daily cases have dropped most significantly. Those two states have represented between 45% and 50% of our growth in new cases over about the last three weeks for the entire country. Yet, they make up slightly over 5% of our population. I'm not sure the temps have climbed there as they have here, but there numbers (new cases) sure seem to be declining.
Finally, I saw DoughtyOne's comments about counting the number days. Like you, I greatly respect and appreciate his work, but I am in the camp that days DO count. The western European countries that I track (plus S. Korea) all have peaks in the number of new cases. In my mind new cases are the primary determinant of the curve. Now, their peaks are all different, but none have gone beyond 29 days except Italy, and they peaked at day 30. Saturday 4/5 was our day 29. Now, many of the countries had two peaks and the number I used above counts the second peak, if there was one. Our first peak was Saturday 4/5 (we could have another).
Your thoughts and comments are welcome.
click on image to enlarge
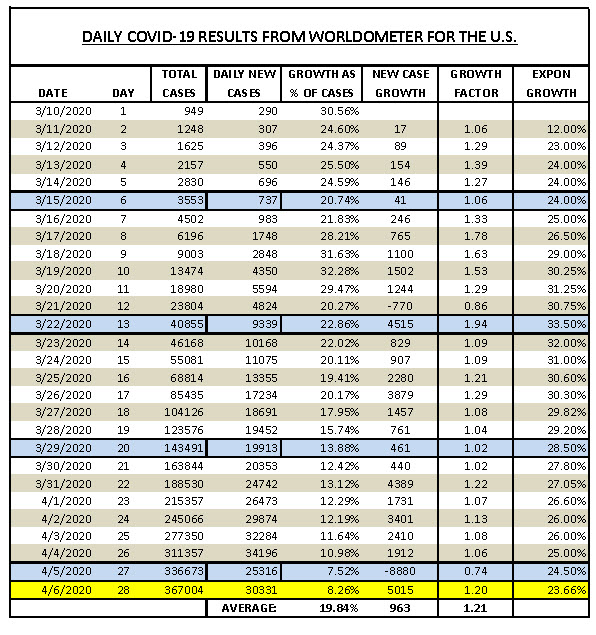
Data from Worldometer
one major anomoly seems to be Germany with 104K cases (which seem correct for the country of their size) but only having 1842 fatalities.
I wonder what they are doing better - or are they just luckier with the spread
Country,
Other Total
Cases New
Cases Total
Deaths New
Deaths Total
Recovered Active
Cases Serious,
Critical Tot Cases/
1M pop Deaths/
1M pop Total
Tests Tests/
1M pop
World 1,365,330 +19,326 76,504 +1,850 293,910 994,916 47,666 175 9.8
USA 369,522 +2,518 11,013 +142 19,874 338,635 9,015 1,116 33 1,942,470 5,868
Spain 140,510 +3,835 13,798 +457 43,208 83,504 7,069 3,005 295 355,000 7,593
Italy 132,547 16,523 22,837 93,187 3,898 2,192 273 721,732 11,937
Germany 104,199 +824 1,842 +32 36,081 66,276 4,895 1,244 22 918,460 10,962
France 98,010 8,911 17,250 71,849 7,072 1,502 137 224,254 3,436
China 81,740 +32 3,331 77,167 1,242 211 57 2
Iran 62,589 +2,089 3,872 +133 27,039 31,678 3,987 745 46 211,136 2,514
UK 51,608 5,373 135 46,100 1,559 760 79 252,958 3,726
Turkey 30,217 649 1,326 28,242 1,415 358 8 202,845 2,405
Switzerland 22,242 +585 811 +46 8,056 13,375 391 2,570 94 167,429 19,346
Belgium 22,194 +1,380 2,035 +403 4,157 16,002 1,260 1,915 176 80,512 6,947
Netherlands 19,580 +777 2,101 +234 250 17,229 1,424 1,143 123 86,589 5,053
“one major anomoly seems to be Germany with 104K cases (which seem correct for the country of their size) but only having 1842 fatalities.”
Yes, I agree. While the death rate is important, my primary concern at the moment is the new cases. Our death rate has been steadily climbing as a percent of total cases. As of yesterday, I am showing it stood at 2.9%. It may go higher. The key is to stop the growth of the virus. In the end, that will take care of the deaths. I hope these last two days may be a positive “sign.” Not much more to hope for :-).
Also France seems to be leveling off ... but UK is still on the uptrend.
“”””Ordinary cold viruses become less active in the spring and summer; will this killer cold virus behave like its benign cousins?””””
IIRC the H1N1 virus in 2009 began in April and lasted through September in the USA.
Anyway, below is my graph which shows the daily change in cases. The fact that daily fluctuations are seen in total and active cases, but not in deaths or recovered cases, is what leads me to believe that there are daily fluctuations in testing.
Notice that on the right side of the graph, that the diagnosis of new cases appears to be decreasing. It would be great if real, but I don't want to get hopes up. Hence, the caveat about weekend testing.
Disclaimer: Opinions posted on Free Republic are those of the individual posters and do not necessarily represent the opinion of Free Republic or its management. All materials posted herein are protected by copyright law and the exemption for fair use of copyrighted works.