His now classic graph of Napoleons March to Russia is a tour de force of the sheer amount of data displayed in a single graph. The first edition was accompanied by a poster of that graph.
His now classic graph of Napoleons March to Russia is a tour de force of the sheer amount of data displayed in a single graph. The first edition was accompanied by a poster of that graph.
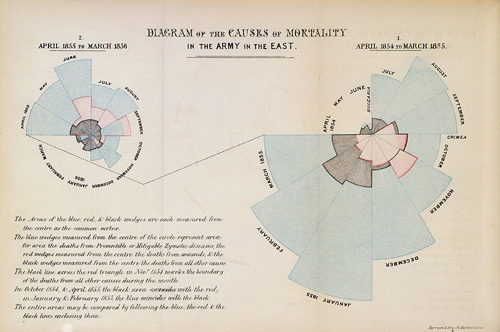
Let to significant changes in military medical care
save for later