Free Republic
Browse · Search
General/Chat
Topics · Post Article

To: exDemMom

Can you take a screenshot of your graph and then upload at postimage, to post here?

Thanks.


8 posted on 03/27/2020 9:39:09 AM PDT by Jane Long (Praise God, from whom ALL blessings flow.)
[ Post Reply | Private Reply | To 6 | View Replies ]


To: Jane Long; All
Hi, thanks for that site.

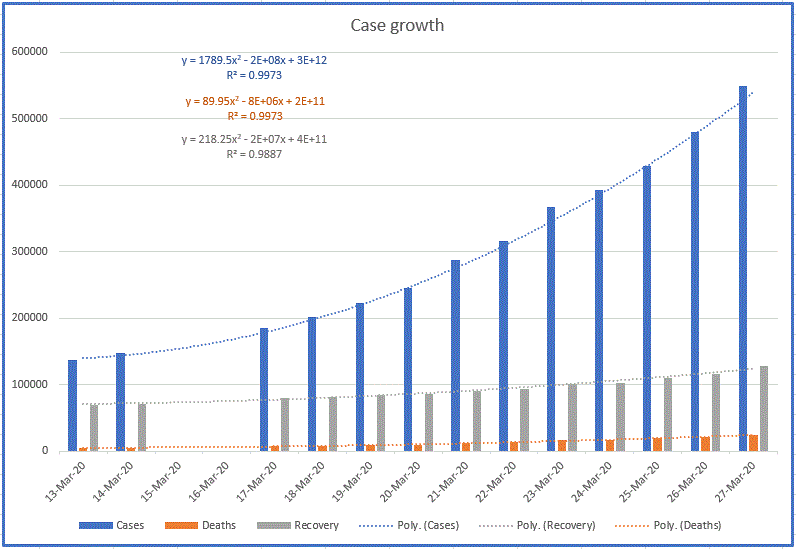
Covid-19-Case-Growth

The equations are generated through the polynomial curve-fit trendline function of Excel. Even though the growth is exponential, a polynomial also shows the curve to within a few thousands of the actual value.

The R squared is a measure of how closely the curve fits the data.

What I see here is that the number of cases is rising faster than deaths or recoveries. Since deaths occur from 2 to 8 weeks after the infection, I expect the rise of deaths will lag behind the rise of new cases. The same applies to recoveries.

I only started keeping a record since Mar. 12. Prior to that, I was only checking the death rate, which held steady at about 2.5% for a while. Now I wish I had that data to compare.

I get my data from Johns Hopkins. Refresh the website for the latest data.
296 posted on 03/27/2020 2:30:41 PM PDT by exDemMom (Current visual of the hole the US continues to dig itself into: http://www.usdebtclock.org)
[ Post Reply | Private Reply | To 8 | View Replies ]

Free Republic
Browse · Search
General/Chat
Topics · Post Article


FreeRepublic, LLC, PO BOX 9771, FRESNO, CA 93794
FreeRepublic.com is powered by software copyright 2000-2008 John Robinson