Skip to comments.
NASA Study Finds World Warmth Edging Ancient Levels
NASA GISS ^
| September 26, 2006
| NASA GISS
Posted on 09/26/2006 7:30:57 AM PDT by cogitator
click here to read article
Navigation: use the links below to view more comments.
first previous 1-20, 21-40, 41-60, 61-80, 81-94 next last
To: Justa
"0.2 C in 30 years is 1/3 of the total global temperature increase (approximately) from 1900-2000."And 30 years is about 1/3 of the time between 1900 and 2000. Your point?
Point one: I make mistakes. Point two: The trend is 0.2 C per decade, so 0.2 C in 10 years is 1/3 of the total global temperature increase in the 20th century. Or, to put it another way, 0.6 C in the past 30 years is approximately the same increase in global temperature observed in the 20th century.
To: cogitator
0.2 C in 30 years is 1/3 of the total global temperature increase (approximately) from 1900-2000.....and that makes perfect sense. If the global temperature rose 0.6 C in 100 years, then it would rise 0.2 C in 33 1/3 years. So it's increased that much in 30 years instead of 33 1/3 years, I don't see that as significant.
42
posted on
09/26/2006 11:32:28 AM PDT
by
Tokra
(I think I'll retire to Bedlam.)
To: cogitator
I don't see quite the same thing in the temperature portion of the chart. The initial slope of the last interglacial is smoother than the initial slope of the current one. The two previous ones were similar in initial slope but did not seem to last as long as the last one. Three interglacials ago has the same spikes on the rising slope as this one did.
As for this one, it seems like the initial phase has lasted longer than the last one as it has not flattened out- it's still changing, while last time by now it had stabilized.
I'll look for the paper, it sounds interesting.
If I were to take a WAG it does look like this interglacial will be longer than the last based on what it's done so far, but there's no way to predict (and probably no way to carry a prediction forward by 20,000 years!)
Thanks for good info, cogitator.
43
posted on
09/26/2006 11:41:43 AM PDT
by
DBrow
To: cogitator
Please read the link that I provided.
I have read your link and have found it to be not substantively different from many others like it that I have previously read. The significant sentence from that article is contained within its first paragraph:
…the proportion of this warming that is due to human influence is still open to question.
All of the conclusions in the link you referenced (like every other similar article) are based upon a mathematical model. Anybody who is reasonably facile with mathematics can tell you that a model is only useful in its predictive power if it can be retroactively applied to past conditions and produce “predictions” that, in fact, “mirror” the observations of that past time frame.
The chief problem with the predictive power of the model you referenced (and all others) central to the claim of so-called global warming is that there is no way to get a valid “prediction” of past events. As climate change, based upon inferences from the geological record, is a phenomenon that transpires over hundreds, if not thousands, of years, the very first problem concerning model predictions is that there are no accurate, comprehensive records of all of the climatic conditions for that length of time. It is only possible to infer gross changes from indirect evidence such as ice core drillings, etc. There are no records of solar activity or volcanic activity, etc.
We do not even have comprehensively accurate records of solar variations, one of the primary contributors to climate, more than half a century old. For that matter, we do not have any statistically valid, data observation compilations of the amount and compositions of gases put into the earth’s atmosphere by volcanic activity, let alone the total amount of such activity, more than a century ago. We do know from very limited observations that a single volcano can potentially “belch” more greenhouse gases and other, erstwhile, pollutant gases into the atmosphere in a single eruption than any possible industrial contribution. We also know that there at dozens of volcanoes erupting in various degrees at various locations all over the earth at any one moment. Unless, and until, a mathematical model can accurately account for such natural contributions to the atmosphere, it is worthless. Of course, those contributions have to comprehensively, accurately and precisely measured first, something that is still not being done.
We have no data on the so-called, “ozone hole” over Antarctica prior to the satellite age nor do we have unquestioned explanations as to that phenomenon’s recently observed variations, let alone its driving mechanism. Consequently, there are no accurate input data for a comprehensive climate model that goes far enough back to be useful in an accurate model.
There is a second problem with the global warming theory based upon models. There, similar to solar activity, volcanic activity, ozone hole variation, etc., is no detailed, accurate record of conditions of any climatological conditions that came about as a result of any “model input data” changes. (Accurate weather recordings only extend less than a century and a half into the past).
(metaphor alert for the next paragraph!!!)
Even disregarding all the above problems with so-called, global warming models, there is, yet, one that is “the elephant in the living room.” Simple statistical analysis of the variations that are postulated to have occurred in the past based upon observations of ice core drillings and ocean core samples, etc., reveal that the currently observed changes are not outside the expected range of natural variation. Therefore, those “learned” individuals who “run around with their hair on fire” screaming about global warming, haven’t a non-controversial “leg to stand on.”
To: cogitator
"This evidence implies that we are getting close to dangerous levels of human-made pollution," said Hansen. This evidence indicates somebody's got an agenda.
45
posted on
09/26/2006 12:27:36 PM PDT
by
Oberon
(What does it take to make government shrink?)
To: Tokra
The trend is currently +0.2 C per decade: 2.0 C in 100 years.
To: DBrow
The initial slope of the last interglacial is smoother than the initial slope of the current one. The two previous ones were similar in initial slope but did not seem to last as long as the last one. Three interglacials ago has the same spikes on the rising slope as this one did.The previous interglacials could be more described "up-up-up-peak-down-flat-down-down" into the next glacial period. The current interglacial would be described "up-up-up-bounce(Younger Dryas)-flat" and flat is where we are now. The flat section is considerably longer than for the previous interglacials.
I admit that I don't know exactly how the end of a glacial period and the beginning of an interglacial period is defined (except for the Holocene). I don't think that end of the glacial period is defined as the point when global temeperatures start to increase; it's probably defined by the recession of the continental ice sheets.
Thanks for good info, cogitator.
Glad it was informative.
To: Parley Baer
They've only recently begun farming in a few bits of Greenland, which they couldn't do right after WWII. Which means we've finally gotten back to where we were during the Medieval Warm Period.
All we have to do to cool things off is what they did back then to start the Little Ice Age - ban SUV's and limit industrial hydrocarbons. :-))
To: cogitator
"The temperature of the global water column (from 0-3,000 meters) has been measured at numerous points around the world. A compilation of this data (by Levitus) indicated a clear warming of the water column, with most of the warming at the surface and just a little penetrating to depth, as would be expected. Heat from volcanic sources is negligible as a contribution to warming or the water vapor "budget"."
"measured at numerous points around the world".
From what I have seen the data is too anecdotal and not consistently systematic, nor systematically collected at a sufficient number of locations and depths on a onsistent and ongoing basis for a long enough period of time.
"Heat from volcanic sources is negligible as a contribution to warming or the water vapor 'budget'"
No reliable studies have ever (1)identified all the under-the-ocean heat sources from tectonic and volcanic activity or (2)systematically measured their heat output, making your statement, and statemenst like it, a guess, because the data to make that statement is nothing other than data no one has, and thus it is dismissed as "negligible", where the failure to acknowledge the lack of relevant data on this issue is what is negligent.
49
posted on
09/26/2006 1:28:40 PM PDT
by
Wuli
To: Lucky Dog
You evince a lot of ideas. It's not useful to argue with your ideas -- it would take too much time. Rather, I'll show where you are grossly wrong, and maybe this will convince you to reexamine your other ideas and perhaps improve your understanding.
Anybody who is reasonably facile with mathematics can tell you that a model is only useful in its predictive power if it can be retroactively applied to past conditions and produce “predictions” that, in fact, “mirror” the observations of that past time frame.
Such as like this:
http://www.grida.no/climate/ipcc_tar/wg1/450.htm#fig127

Caption: Global mean surface temperature anomalies relative to the 1880 to 1920 mean from the instrumental record compared with ensembles of four simulations with a coupled ocean-atmosphere climate model (from Stott et al., 2000b; Tett et al., 2000) forced (a) with solar and volcanic forcing only, (b) with anthropogenic forcing including well mixed greenhouse gases, changes in stratospheric and tropospheric ozone and the direct and indirect effects of sulphate aerosols, and (c) with all forcings, both natural and anthropogenic. The thick line shows the instrumental data while the thin lines show the individual model simulations in the ensemble of four members. Note that the data are annual mean values. The model data are only sampled at the locations where there are observations. The changes in sulphate aerosol are calculated interactively, and changes in tropospheric ozone were calculated offline using a chemical transport model. Changes in cloud brightness (the first indirect effect of sulphate aerosols) were calculated by an offline simulation (Jones et al., 1999) and included in the model. The changes in stratospheric ozone were based on observations. The volcanic forcing was based on the data of Sato et al. (1993) and the solar forcing on Lean et al. (1995), updated to 1997. The net anthropogenic forcing at 1990 was 1.0 Wm-2 including a net cooling of 1.0 Wm-2 due to sulphate aerosols. The net natural forcing for 1990 relative to 1860 was 0.5 Wm-2 , and for 1992 was a net cooling of 2.0 Wm-2 due to Mt. Pinatubo. Other models forced with anthropogenic forcing give similar results to those shown in b (see Chapter 8, Section 8.6.1, Figure 8.15; Hasselmann et al., 1995; Mitchell et al., 1995b; Haywood et al., 1997; Boer et al., 2000a; Knutson et al., 2000).
For that matter, we do not have any statistically valid, data observation compilations of the amount and compositions of gases put into the earth’s atmosphere by volcanic activity, let alone the total amount of such activity, more than a century ago. We do know from very limited observations that a single volcano can potentially “belch” more greenhouse gases and other, erstwhile, pollutant gases into the atmosphere in a single eruption than any possible industrial contribution.
Totally wrong. While volcanoes are a significant contributor of SO2 (particularly big eruptions), SO2 is not a greenhouse gas and actually would cause a cooling effect. Volcanoes are not a signficant source of CO2 or any other greenhouse gas compared to current anthropogenic production.
Gases: Man versus the Volcanoes
Volcanic Gases and their Effects
We have no data on the so-called, “ozone hole” over Antarctica prior to the satellite age nor do we have unquestioned explanations as to that phenomenon’s recently observed variations, let alone its driving mechanism.
Incorrect again. The ozone hole was discovered by ground-based measurements of ozone (Dobson unit decline) made by the British Antarctic Survey; in fact, when the ozone monitoring sensors on satellites first detected the hole, it was thought that the measurements were erroneous and the ground-based measurements had to be consulted to confirm what the satellites were observing.
Ozone Hole
The Antarctic Ozone Hole
Simple statistical analysis of the variations that are postulated to have occurred in the past based upon observations of ice core drillings and ocean core samples, etc., reveal that the currently observed changes are not outside the expected range of natural variation.
That's a specious ["have a false look of truth or genuiness"] argument. Even if the observed changes are not out of the full range of natural variation, their relevant aspect is the climate context in which the observed changes are occurring. If natural causes cannot be identified for the observed changes, then at least part of what is happening is not natural variation. Therefore, it is relevant to try to determine if the non-natural causes have the potential to push the climate system beyond the range of natural variation -- and this indeed is the concern of the climate science community.
To: wbill
It seems to me that would be fairly easy to measure: found at a certain new latitude, no longer found at another old one, ergo whole species has moved.
To: Wuli
From what I have seen the data is too anecdotal and not consistently systematic, nor systematically collected at a sufficient number of locations and depths on a consistent and ongoing basis for a long enough period of time. WORLD OCEAN HAS WARMED SIGNIFICANTLY OVER PAST 40 YEARS
Quote: "The scientists determined their findings by using data—5.1 million temperature profiles—from sources around the world, to quantify the variability of the heat content (mean temperature) of the world ocean from the surface through 3000 meter depth for the period 1948 to 1996. Three major ocean basins were examined; Atlantic, Indian and Pacific."
No reliable studies have ever (1)identified all the under-the-ocean heat sources from tectonic and volcanic activity or (2)systematically measured their heat output, making your statement, and statemenst like it, a guess, because the data to make that statement is nothing other than data no one has, and thus it is dismissed as "negligible", where the failure to acknowledge the lack of relevant data on this issue is what is negligent.
The global heat flow in the Earth averages out to 0.075 Watts per square meter.
Global Heat Flow
Incoming solar radiation is approximately 342 Watts per square meter. (This value is found from numerous sources.)
You decide what's negligible and what isn't, based on this information.
To: cogitator
>>
And that approach won't work. What is needed is increased efficiency with existing energy technology and new energy sources (as well as upgrades to existing and proven technologies, like nuclear power).
<<
The free market will factor in efficiency based on cost. But this is totally apart from the issue of climate change. Notice that "climate change" is distinct from "global warming".
It is foolish in the utmost to assume that human activity is responsible for climate change and then attempt to mitigate the climate. Why? Simply because at this point it remains to be proved that humans are responsible for climate change.
In truth, the climate is always changing. Or to put it another way, the climate never stops changing. We have examples of this change under our feet, and before our very eyes almost all the time. Even if we spend our lives in the concrete and steel canyons of Manhattan, the very limestone in the concrete our feet are standing on testifies to climate change.
I am sure you have seen photos of the Anastasi Indian cliff dwellings in northern Arizona. Here we have an entire civilization that was driven into a mass migration by climate change so that by 1300 AD, they had totally left the area.
History records that Erik the Red along with 450 followers, colonized Greenland in the summer of 986 AD. At that time the island was warm enough to permit raising row crops and cattle. By 1350 many of the farms were abandoned because the climate had changed to being much colder and wetter.
The weather was trending (climate change) to a period that we call the Little Ice Age. This period had three distinct minima, about 1650, about 1770, and 1850. It was so cold that the River Thames started freezing over in the winter. The first Thames freeze was in 1607; the last in 1814.
(This period of colder climate can be seen today in the paintings that are still published or can be seen in antique books. The winter scenes were popularized by the firm, "Currier & Ives", items of that style are popular on eBay. When you see a quaint winter scene, you are seeing the weather during the Little Ice Age.)
It is signal to me that not a single climatologist, who today cares so much for our climate, cares to test his models and theories on the climate change that enabled Erik the Red to settle Greenland, or the climate change that froze the River Thames.
No! That climate change is not so urgent that is pays for AlGore to burn hundreds of thousands of pounds of jet fuel flitting around the globe to show his movie. That climate change doesn't get grants approved, and that climate change will not allow socialists to increase the size of government along with permeating the regulatory system into every area of our daily lives to such an extent that we will have to ask government for permission to use energy.
The questions remain unanswered even as we are given the bum's rush to approving a vast destruction in our national and personal liberties:
1) To what extent is the climate really changing;
2) To what extent is human activity responsible for any change that is harmful;
3) To what extent, and at what cost, can humanity mitigate their behavior to reduce or eliminate any harmful climate change.
Unless and until these questions are addressed, in an open and honest scientific and policy debate, I refuse to accept the basic premise that climate change is the same as "global warming".
To: Old Professer
The late John Daly ran a web site that is still maintained today. One of his most interesting presentations is to show the temperature data from nearly cities.
If "global warming" is really global, its effects should be seen "globally", that is in just about all sets of daily temperature readings.
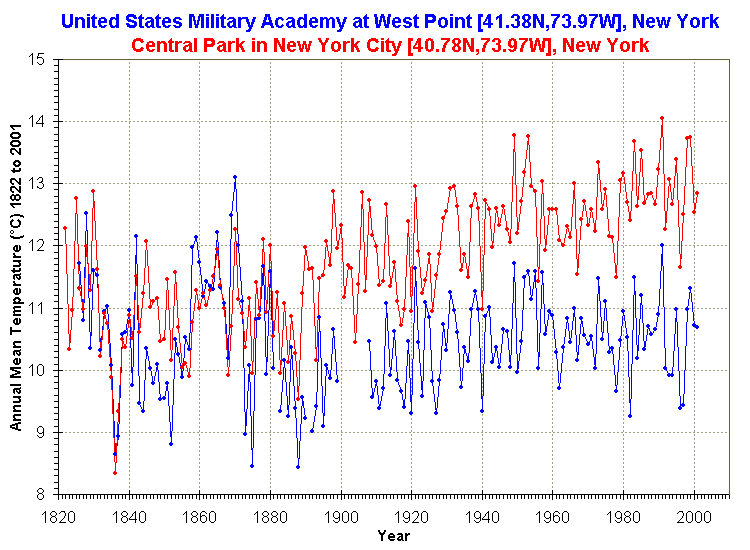
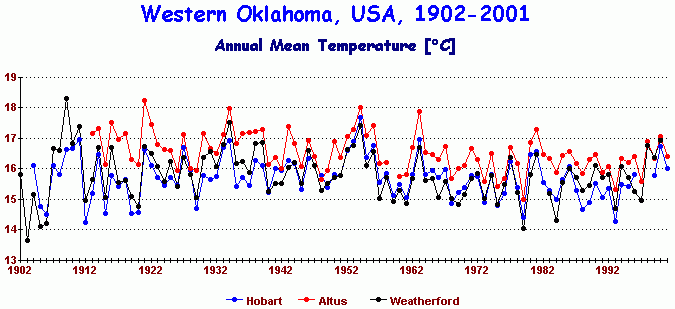
When you match up cities that are close, you get some revealing graphs. For example, here is the graph of West Point, NY compared to Central Park. The latter is about as urban as you can get:
http://www.john-daly.com/stations/WestPoint-NY.gif
Here we have three cities in western Oklahoma:
http://www.john-daly.com/stations/oklahoma.gif
Global Warming, if it is global, will be globally observable. If it is not, then we have something else. But, nobody seems to be interested in this. If so, then some other agenda is in play, plain and simple.
I invite Freepers to poke around on the site. There is a lot of data there:
http://www.john-daly.com/
To: cogitator
It's not useful to argue with your ideas -- it would take too much time. Rather, I'll show where you are grossly wrong, and maybe this will convince you to reexamine your other ideas and perhaps improve your understanding.
Sorry you feel that way. It would seem to me that the ideas are, in fact, what is the source of the disagreement. As to your assertion concerning my incorrectness, please allow me to offer some counters that may convince your to reexamine your other ideas and perhaps improve your understanding..
Such as like this: [link to global mean temperature model]
Perhaps you missed part of my comment earlier. Therefore, allow me to restate it here:
As climate change, based upon inferences from the geological record, is a phenomenon that transpires over hundreds, if not thousands, of years, [emphasis added] the very first problem concerning model predictions is that there are no accurate, comprehensive records of all of the climatic conditions for that length of time.
The model to which you linked was for less than a century and half of data. Indeed, the readings for the first 40 to 50 years of that time could be potentially challenged on the basis of accuracy and precision compared to the later portion. However, regardless of that point, the time frame shown for the model is insufficient to have any relevance to climatic changes which occur over much longer time frames. Therefore, my point remains statistically valid.
However, let’s look beyond just the statistical validity issue to the actual model inputs as specified by the caption material you quoted. To wit:
(a) with solar and volcanic forcing only… anthropogenic forcing including well mixed greenhouse gases, changes in stratospheric and tropospheric ozone and the direct and indirect effects of sulphate aerosols… The model data are only sampled at the locations where there are observations…
An immediate question arises: Exactly how did the modelers obtain data on solar and volcanic activity as well as stratospheric and tropospheric ozone levels in the 1880’s, or, for that matter, at any time prior to the 1920’s? While there were balloon flights, I don’t recall reading of any regular flights to the stratosphere for data collection in that time frame. Additionally, I don’t recall reading of atmospheric sulfate aerosol data collection efforts from that time.
While volcanoes are a significant contributor of SO2 (particularly big eruptions), SO2 is not a greenhouse gas and actually would cause a cooling effect.
Well, let’s examine the information to which you linked:
The most abundant gas typically released into the atmosphere from volcanic systems is water vapor (H20), followed by carbon dioxide (C02) and sulfur dioxide (S02). Volcanoes also release smaller amounts of others gases, including hydrogen sulfide (H2S), hydrogen (H2), carbon monoxide (CO), hydrogen chloride (HCL), hydrogen fluoride (HF), and helium (He).
According to information from global warming sites, water vapor, carbon dioxide, and carbon monoxide are all greenhouse gases. However, it is necessary to go further and discuss measurements for quantities of these gases:
Gerlach (1991) estimated [emphasis added] a total global release of 3-4 x 10E12 mol/yr from volcanoes.
Please recall that in my earlier post:
For that matter, we do not have any statistically valid, data observation compilations [emphasis added] of the amount and compositions of gases put into the earth’s atmosphere by volcanic activity, let alone the total amount [emphasis added] of such activity, more than a century ago.
My point still stands: There are no data, i.e., measurements, of worldwide, volcanic contribution to the gaseous composition of the atmosphere. Most certainly, there were not even estimates prior to the last few decades. Therefore, no mathematical model can be said to be accurate in forecasting past climatic conditions since there is a dearth of past input data.
However, let’s press on with examination of another statement:
While volcanoes are a significant contributor of SO2 (particularly big eruptions), SO2 is not a greenhouse gas and actually would cause a cooling effect.
Volcanoes and other natural processes release approximately 24 Tg of sulfur to the atmosphere each year. Thus, volcanoes are responsible for 43% of the total natural S flux each year. Man's activities add about 79 Tg sulfur to the atmosphere each year. In an average year, volcanoes release only 13% of the sulfur added to the atmosphere compared to anthropogenic sources. Andres and Kasgnoc (1997) noted that the bulk of the anthropogenic flux is located in the northern hemisphere while volcanic fluxes occur in much more focused belts around the world.
Obviously, the above information must be an “estimate” as no one is reported to have measured the output of all volcanoes. Nonetheless, from a discussion point, it would seem that if the above estimate were true, when combined with your earlier statement that “anthropogenic” activities are responsible for global cooling as much, or more, than global warming.
We have no data on the so-called, “ozone hole” over Antarctica prior to the satellite age nor do we have unquestioned explanations as to that phenomenon’s recently observed variations, let alone its driving mechanism.
Incorrect again. The ozone hole was discovered by ground-based measurements of ozone (Dobson unit decline) made by the British Antarctic Survey; in fact,…
British scientists began their measurements of Antarctic ozone in 1957.
Please note that Sputnik was launched in 1957 which is commonly referred to as the beginning of the satellite age. Therefore, my statement is not Incorrect again.
As an added item of interest in this area, it should be noted that the use of Chloro-Fluoro-Carbons (CFC’s) as a refrigerant was not very wide spread less than a decade prior to this measurement. Refrigerators as consumer items were not universally common items in the US until the late 40’s and early 50’s and even later in other parts of the world. Automobile air conditioning was not widespread until the early, or even late, 60’s and household air conditioning was even later becoming a broadly based phenomenon in the US. An argument could be made that household air conditioning is still not wide spread outside of the US. Industrial use of refrigerants outside of the food preparation industry was, and remains, limited except for internal environmental control. Despite these facts, the hole in the ozone is attributed to CFC’s.
… when the ozone monitoring sensors on satellites first detected the hole, it was thought that the measurements were erroneous and the ground-based measurements had to be consulted to confirm what the satellites were observing.
This may be true but was irrelevant to my statement.
Simple statistical analysis of the variations that are postulated to have occurred in the past based upon observations of ice core drillings and ocean core samples, etc., reveal that the currently observed changes are not outside the expected range of natural variation.
That's a specious ["have a false look of truth or genuineness"] argument.
Let me assure you, my statistical argument is not specious. Perhaps you should research something know as Type I and Type II errors and the related Alpha and Beta risk.
If natural causes cannot be identified for the observed changes, then at least part of what is happening is not natural variation.
Perhaps you could provide the natural cause for the previous peaks that match or exceed the currently observed temperatures in the inferred temperature graphs from ice core drillings? By your stated logic, if you cannot identify those natural causes, then at least part of those changes is not natural variation. Obviously, neither you nor anyone else can identify those causes. Therefore, you statement concerning the inability to identify current change causes does not preclude that the sources of the current causes may be the same sources that caused the previous changes.
Therefore, it is relevant to try to determine if the non-natural causes have the potential to push the climate system beyond the range of natural variation -- and this indeed is the concern of the climate science community.
At last, a statement we can agree upon! However, I expect that we part company on the difference between pronouncements of concern versus pronouncements of absolute certainty as to causes and what might, or might not, be appropriate remedies.
To: theBuckwheat; cogitator
If "global warming" is really global, its effects should be seen "globally", that is in just about all sets of daily temperature readings.This seems to me fundamentally to misunderstand what is meant by 'global', which is a mean of all available temperature data world-wide. Just because that mean appears to have an upward trend it doesn't follow that there won't continue to be, as there always have been, huge regional, local and temporal variations around that mean (which at the small scale you can call 'weather' if you like); or that particular local and regional trends can't point in the opposite direction from the global trend, perhaps for long periods. Such is the case for any large system of complex variables, climatic or otherwise. So far as I know no climate scientist, on any side of the argument, has argued otherwise, since to do so would (I think) be mathematically illiterate.
To: Winniesboy
>>
Just because that mean appears to have an upward trend it doesn't follow that there won't continue to be, as there always have been, huge regional, local and temporal variations around that mean..
<<
Yes, I agree. There can be large localized variances. But if you would go to the What the Stations Say page of John Daly's web site:
http://www.john-daly.com/stations/stations.htm
Pick any city pair. Proposing that there will be some localized diversions from the larger trend is reasonable. But here we have a large number of city pairs where no common trend is visible.
It kind of calls the proposed "larger trend" into question if it has too many exceptions, doesn't it? Not to contradict what that question implies, we only need to go back 10,000 years to find the end of the last glacial retreat in North America. Obviously we trended upwards in global temperature since a mere 10,000 years ago.
(see graphic at:
http://en.wikipedia.org/wiki/Ice_age)
The upward trend clearly reversed during the Little Ice Age, when the River Themes froze over in the winter, but no longer does.
This all demonstrates that the climate is always changing. Whether or not humanity is responsible for that change, or what proportion of that change is very much still an open question. And a look at the graphic I cited above demands that we find out what humanity did in previous periods of a warm climate to bring on the next ice age. This time, we must do all we can to avoid making the same mistakes our ancestors did.
To: firebrand
It seems to me that would be fairly easy to measure: found at a certain new latitude, no longer found at another old one, ergo whole species has moved.True, but 20 miles over the course of 50 years (4 miles per decade over 5 decades) is a trivial distance. Unless this was a misprint, it seemed to me like a senseless point to make.
For instance (to take an extreme) if Polar Bears showed up in New York City - this, to me, would be a good indicator of global cooling. But - to cite as global warming evidence that an animal speciesto 50 years to change location over a distance that a reasonably able human can walk in less than a day, strikes me as grasping at straws.
58
posted on
09/27/2006 5:53:16 AM PDT
by
wbill
To: Lucky Dog
As climate change, based upon inferences from the geological record, is a phenomenon that transpires over hundreds, if not thousands, of years, [emphasis added] the very first problem concerning model predictions is that there are no accurate, comprehensive records of all of the climatic conditions for that length of time. This statement is also incorrect. Paleoclimates have been modeled for the glacial/interglacial period (the Pleistocene), the Cenozoic, and over all of Earth's history. As the time-scale of examination changes, the processes which affect the climate on a given time-scale change (ask FReeper friend palmer about this). It should be fairly obvious that the processes which control climate on time-scales of thousands to millions of years are different than those which affect climate on time-scales of decades to centuries. (Actually, all of the processes are still working, but as the temporal resolution of the record becomes coarser, the effect of short time-scale processes becomes more difficult to discern.)
An immediate question arises: Exactly how did the modelers obtain data on solar and volcanic activity as well as stratospheric and tropospheric ozone levels in the 1880’s, or, for that matter, at any time prior to the 1920’s?
That information is in the caption.
My point still stands: There are no data, i.e., measurements, of worldwide, volcanic contribution to the gaseous composition of the atmosphere.
Your point is specious. There is sufficient data to determine the amount of CO2 contributed by volcanoes. If the estimate was way off, the Keeling CO2 curve (measured on Mauna Loa) would not conform to the well-determined CO2 production budget.
Obviously, the above information must be an “estimate” as no one is reported to have measured the output of all volcanoes. Nonetheless, from a discussion point, it would seem that if the above estimate were true, when combined with your earlier statement that “anthropogenic” activities are responsible for global cooling as much, or more, than global warming.
Very interesting observation! In fact, anthropogenic SO2 contributions to the atmosphere have been reduced a lot since the 1950s-60s. This factor is considered to be a partial explanation for the cooler temperatures observed through the 1970s. And there have been several articles indicating that cleaner air (wrt SO2) may be a reason for the acceleration of the warming signal.
Please note that Sputnik was launched in 1957 which is commonly referred to as the beginning of the satellite age. Therefore, my statement is not Incorrect again.
Excellent hairsplit. Usually the reference to satellites in regard to ozone refers to when ozone measurements from satellite-borne sensors began.
As an added item of interest in this area, it should be noted that the use of Chloro-Fluoro-Carbons (CFC’s) as a refrigerant was not very wide spread less than a decade prior to this measurement. Refrigerators as consumer items were not universally common items in the US until the late 40’s and early 50’s and even later in other parts of the world. Automobile air conditioning was not widespread until the early, or even late, 60’s and household air conditioning was even later becoming a broadly based phenomenon in the US. An argument could be made that household air conditioning is still not wide spread outside of the US. Industrial use of refrigerants outside of the food preparation industry was, and remains, limited except for internal environmental control. Despite these facts, the hole in the ozone is attributed to CFC’s.
Correction: the hole in the ozone is absolutely and unequivocally due to CFCs and their breakdown byproducts. The chapter I linked to is part of a larger discussion of atmospheric ozone. I am fairly sure that it indicates CFC production began in the 1930s (your statement above is still accurate). It took time for the CFCs to reach the stratosphere in sufficient concentrations for the ozone-destroying reactions to affect stratospheric ozone concentration.
Perhaps you could provide the natural cause for the previous peaks that match or exceed the currently observed temperatures in the inferred temperature graphs from ice core drillings? By your stated logic, if you cannot identify those natural causes, then at least part of those changes is not natural variation.
You misunderstood my statement. The relevant aspect is the climate context in which the changes are occurring. The Eemian temperature record is different than that of the Holocene; the Eemian temperature record ascends to an early Eemian peak and then drops off fairly rapidly. The Holocene temperature record has been far more stable (less variable) for a longer period of time. Now that a temperature increase is being observed, the cause of the increase must be partitioned into natural or anthropogenic forcing. In the current climate state, natural factors are insufficient to explain the increasing trend, even though the current temperatures may be slightly less than the maximum Eemian peak temperatures.
Now, indulging in pure speculation; I've always felt that the shape of the Eemain temperature curve, and that of the previous interglacials, indicated a climate system "overshoot" -- i.e., the temperatures shot upward, and the peak was an unstable state which had to be resolved toward a cooler, more stable, "equilibrium" state. I've never seen that idea discussed, and it might be fun to bring it up with some real climate modelers some day.
However, I expect that we part company on the difference between pronouncements of concern versus pronouncements of absolute certainty as to causes and what might, or might not, be appropriate remedies.
The "mainstream" climate science community has over the past few years become increasingly convinced of the main reasons for the observed climate signals. Scientists don't like to phrase their understanding as "absolute certainty" -- they'd probably prefer "strong probability". Anyway, most of them indicate that the probability is strong enough that it is time to start planning effective responses.
To: Lucky Dog
Follow-up. I did a little searching, and found some very interesting graphs relating Eemian temperatures to Holocene temperatures here:
Living in the Eemian
Now, other searching indicated that there is some evidence that Eemian sea levels were a few meters higher than now, and this is part of the concern, that since the peak Eemian temperatures were only 1-2 C higher than now, then reaching those temperatures due to anthropogenically-forced warming could cause a similar sea level rise.
Navigation: use the links below to view more comments.
first previous 1-20, 21-40, 41-60, 61-80, 81-94 next last
Disclaimer:
Opinions posted on Free Republic are those of the individual
posters and do not necessarily represent the opinion of Free Republic or its
management. All materials posted herein are protected by copyright law and the
exemption for fair use of copyrighted works.
FreeRepublic.com is powered by software copyright 2000-2008 John Robinson