To: cogitator
The key thing I want you to note is how much bigger the drop in North America ca. 1950 was, compared to other continents. Why? Hmmm.... Why? There's more accurate records kept in the United States so he has more points for him to cherry pick from
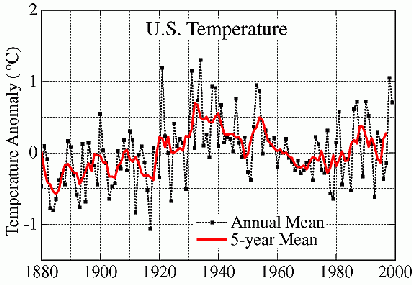
Which he obviously did, since that North American Temperature chart looks nothing like the ones I've seen. In North America the 1930's were just as warm as the 1990's

Sorry but right there shows his computer model to be faulty
Sorry but there's no consistent pattern there to suggest sulfate aerosols or any other pollutant had anything to do with the cooling
Wishful thinking, not in accord with scientific understanding. An interview with Dr. Simon Tett "All attempts at detecting and attributing climate change signals need a reliable observed data set and simulations with mechanisms that drive climate change included.
Another cherry picked computer program
Sorry but I fail to see how this

Correlates with these


Since the beginning of the century sulfate aerosols kept going up & up and yet the temperature rose & cooled over the century regardless.
It also shows your liberal contradictory logic, you think the 0.2-0.5 W/M² shown in the graph caused all this cooling, yet a 4 to 10x increase of 2.0 W/M² solar irradience has no effect
Assertion. Show quantified estimates, please. India's smoke does not have an appreciable sulfate component, for example.
bbzzzztt! Wrong again
From the link where the actual picture is http://visibleearth.nasa.gov/view_rec.php?vev1id=10980
The skies over Northern India are filled with a thick soup of aerosol particles all along the southern edge of the Himalayan Mountains, and streaming southward over Bangladesh and the Bay of Bengal. Notice that the air over the Tibetan Plateau to the north of the Himalayas is very clear, whereas the view of the land surface south of the mountains is obstructed by the brownish haze. Most of this air pollution comes from human activities. The aerosol over this region is notoriously rich in sulfates, nitrates, organic and black carbon, and fly ash.
243 posted on
04/11/2007 11:23:50 PM PDT by
qam1
(There's been a huge party. All plates and the bottles are empty, all that's left is the bill to pay)
To: qam1
Which he obviously did, since that North American Temperature chart looks nothing like the ones I've seen.Clearly you've got to stop getting your primary data and images from the late John Daly's Web site.
Since the beginning of the century sulfate aerosols kept going up & up and yet the temperature rose & cooled over the century regardless.
Fabulous graph. You can even see the blip in the 1950s with rapid (and sulfur-intensive) industrial activity!
Let's go back and see what Dr. Tett said, exactly (I even underlined this part): "After 1970 our model with greenhouse gases alone begins to depart significantly from the observations. However, when we included sulphate aerosols, which have a cooling effect, the model agreed with the data from the 1930s and onwards."
I interpret as him saying that the effect of sulphate aerosols didn't throw the models off the "real" track until the 1970s, but adding their effect makes the models better back to the 1930s. Consistent with your fabulous graph.
It also shows your liberal contradictory logic, you think the 0.2-0.5 W/M² shown in the graph caused all this cooling, yet a 4 to 10x increase of 2.0 W/M² solar irradience has no effect.
Don't call me a liberal just because I'm knowledgeable about climate change. Where do you get the solar irradiance increase value? And it should be clear the sulfate aerosols exert a cooling effect -- I don't think "caused all this cooling" is an accurate characterization.
bbzzzztt! Wrong again
Not quite wrong, inaccurate. I should have quantified. Your quote was qualitative and concerned the general compositon of the Asian aerosol. My statement was about emissions from India: "India's smoke does not have an appreciable sulfate component, for example."
The Asian Brown Cloud (PDF)
Excerpt:
"SO2 emissions (which are converted to sulfate aerosols) are 5 Tg/yr of sulfur for India, 28 Tg/yr for China and 25 Tg/yr for North America. Emission sources of other aerosol components such as organics, black carbon, fly ash and dust are very poorly characterized. For black carbon, available estimates suggest that the Asian region may contribute about 30 to 50% of the total world emissions."
India's total emissions have a much lower sulfur content than higher-industry emissions from China and North America, because the Indian emissions are predominantly from cooking fires, not coal burning. My statement that India's smoke does not have an appreciable sulfate content was inaccurate. India's emissions have a much lower sulfate content than emissions from more industrialized countries. Thanks for requiring this clarification.
To: qam1
Great graphics.
By the way, the only “last century or so” temperature records I actually believe are the US Temp you posted here. The others are way too fraught with collection and correction difficulties. There is probably a reasonably decent Ocean Temp record somewhere, but I’m not sure I’m familiar with it.
Your charts suggest they really don’t understand aerosols, clouds, or solar influences yet to make these models worth running.
Garbage in, garbage out: very, very fast.
248 posted on
04/12/2007 3:54:50 PM PDT by
AFPhys
((.Praying for President Bush, our troops, their families, and all my American neighbors..))
FreeRepublic.com is powered by software copyright 2000-2008 John Robinson


