Posted on 05/07/2011 7:57:44 AM PDT by DeaconBenjamin
On the surface, this was the third consecutive solid jobs report, not as measured by the typical recovery, but the best back-to-back reports we have seen for years. The Payroll Survey Establishment Data showed employment up by 244,000.
At that pace of hiring, the unemployment number would ordinarily drop, but not fast.
Instead, the unemployment rate ticked up. The reason is beneath the surface, employment fell by 190,000 according to the Household Survey.
According to the Household Survey, the number of unemployed rose by 205,000. Another 131,000 dropped out of the labor force or the unemployment rate would have been even higher.
Which survey to believe?
It is hard to say on one month's data. However, during a recovery the household survey is supposed to lead. Moreover, the household survey is more consistent with three recent reports.
Weekly Unemployment Claims Soar to 474,000; Bogus Excuses Offered
Oil Consumption Demand Destruction vs. Speculative Futures Positions
Non-Manufacturing ISM Plunges Below Prediction of All 73 Economists, New Orders Collapse, Prices Firm; Did Rosenberg Capitulate at the Top?
Unless the Household Survey is an outlier, the implications are not good
Last month I said "It is very questionable if this pace of jobs keeps up."
Well, it kept up if the Payroll Survey is correct, it sure didn't if the Household Survey is to be believed.
Recall that the unemployment rate varies in accordance with the Household Survey not the reported headline jobs number, and not in accordance with the weekly claims data.
Digging deeper into the Household Survey, we see some more interesting data. In the last year, the civilian population rose by 1,817,000. Yet the labor force dropped by 1,099,000. Those not in the labor force rose by 2,916,000.
In January alone, a whopping 319,000 people dropped out of the workforce. In February another 87,000 people dropped out of the labor force. In March 11,000 people dropped out of the labor force. In April, 131,000 dropped out of the labor force. The 4-month total for 2011 is 548,000 people dropped out of the labor force.
Many of those millions who dropped out of the workforce would start looking if they thought jobs were available. Indeed, in a 2-year old recovery, the labor force should be rising sharply as those who stopped looking for jobs, once again started looking. Instead, an additional 548,000 people dropped out of the labor force in the first four months of the year.
Were it not for people dropping out of the labor force, the unemployment rate would be well over 11%.
As I said, the report looks good on the surface, it does not look good if you poke around in the details.
April 2011 Jobs Report
Please consider the Bureau of Labor Statistics (BLS) April 2011 Employment Report.
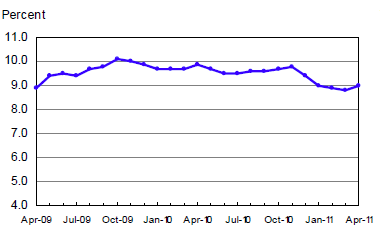
Nonfarm payroll employment rose by 244,000 in April, and the unemployment rate edged up to 9.0 percent, the U.S. Bureau of Labor Statistics reported today. Job gains occurred in several service providing industries, manufacturing, and mining.
Unemployment Rate - Seasonally Adjusted Nonfarm Employment - Payroll Survey - Monthly Look - Seasonally Adjusted
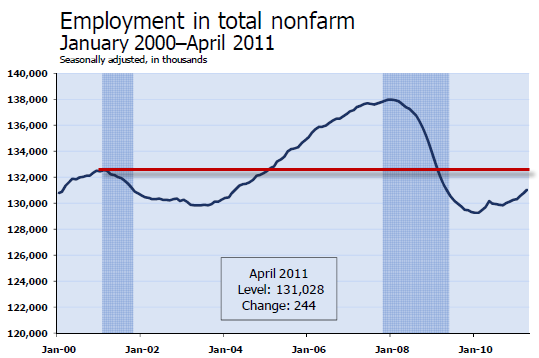
Nonfarm Employment - Payroll Survey - Annual Look - Seasonally Adjusted
Notice that employment is lower than it was 10 years ago.
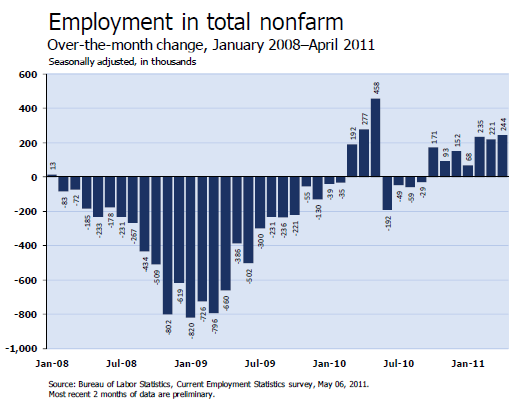
Nonfarm Employment - Payroll Survey - This Month - Seasonally Adjusted

Employment in the private sector rose by 268,000 in April. Since reaching a low point in employment in February 2010, the private sector has added 2.1 million jobs—an average of 149,000 per month.
Statistically, 127,000 jobs a month is enough to keep the unemployment rate flat.
Index of Aggregate Weekly Hours
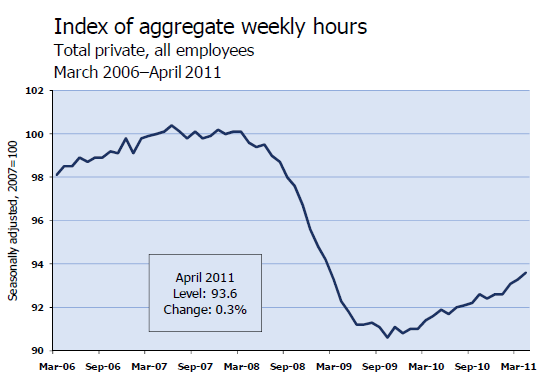
In April, the average workweek for all employees on private nonfarm payrolls was unchanged at 34.3 hours. The average workweek for production and nonsupervisory employees on private nonfarm payrolls was also unchanged at 33.6 hours.
The index of aggregate weekly hours for all employees rose by 0.3 percent over the month. Since reaching a low point in October 2009, the index has increased by 3.3 percent.
Average Hourly Earnings vs. CPI
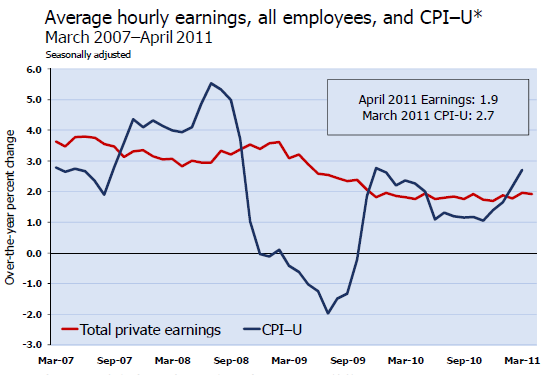
Average hourly earnings of all employees in the private sector increased by 3 cents in April to $22.95. Hourly earnings are up 1.9 percent over the year.
Between March 2010 and March 2011, the consumer price index for all urban consumers (CPI-U) increased by 2.7 percent.
Not only are wages rising slower than the CPI, there is also a concern as to how those wage gains are distributed.
BLS Birth-Death Model Black Box
The big news in the BLS Birth/Death Model is the BLS has moved to quarterly rather than annual adjustments.
Effective with the release of January 2011 data on February 4, 2011, the establishment survey will begin estimating net business birth/death adjustment factors on a quarterly basis, replacing the current practice of estimating the factors annually. This will allow the establishment survey to incorporate information from the Quarterly Census of Employment and Wages into the birth/death adjustment factors as soon as it becomes available and thereby improve the factors.
For more details please see Introduction of Quarterly Birth/Death Model Updates in the Establishment Survey
In recent years Birth/Death methodology has been so screwed up and there have been so many revisions that it has been painful to watch.
It is possible that the BLS model is now back in sync with the real world. Moreover, quarterly rather than annual adjustments can only help the process.
The Birth-Death numbers are not seasonally adjusted while the reported headline number is. In the black box the BLS combines the two coming out with a total.
The Birth Death number influences the overall totals, but the math is not as simple as it appears. Moreover, the effect is nowhere near as big as it might logically appear at first glance.
Do not add or subtract the Birth-Death numbers from the reported headline totals. It does not work that way.
Birth/Death assumptions are supposedly made according to estimates of where the BLS thinks we are in the economic cycle. Theory is one thing. Practice is clearly another as noted by numerous recent revisions.
Birth-Death Number Revisions
Inquiring minds note enormous backward revisions in Birth-Death reporting.
Birth Death Model (as reported in January)
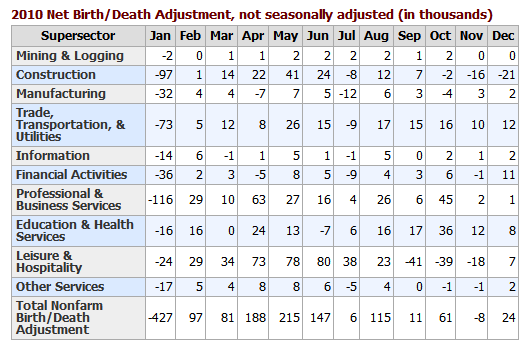
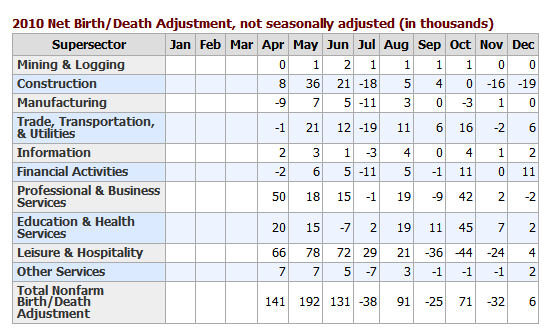
Birth Death Model Revisions 2010 (as reported February)
Is this new model going to reflect reality going forward?
That's hard to say, but things were so screwed up before that it is unlikely to be any worse. One encouraging sign is several negative numbers in the recent chart. January would have been negative too, had they shown it. Historically there were only 2 negative number every year, January and July. That anomaly broke November of 2010.
Birth Death Model April 2011

Do NOT subtract 175,000 from the headline number. That is statistically invalid.
Household Data
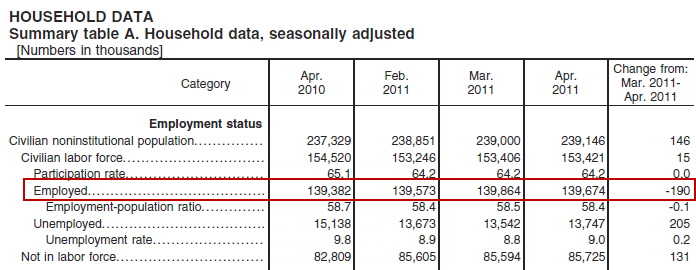
In the last year, the civilian population rose by 1,817,000. Yet the labor force dropped by 1,099,000. Those not in the labor force rose by 2,916,000.
Were it not for people dropping out of the labor force, the unemployment rate would be well over 11%.
Table A-8 Part Time Status
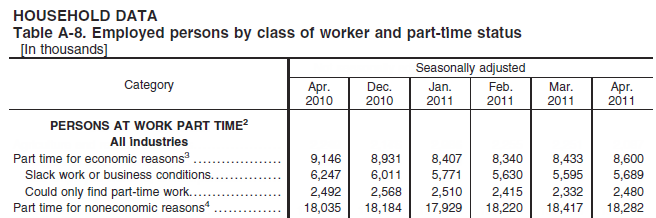
There are now 8,600,000 workers whose hours may rise before those companies start hiring more workers.
Note the number rose by 167,000 in the last month
Table A-15
Table A-15 is where one can find a better approximation of what the unemployment rate really is.

Distorted Statistics
Given the total distortions of reality with respect to not counting people who allegedly dropped out of the work force, it is hard to discuss the numbers.
The official unemployment rate is 9.9%. However, if you start counting all the people that want a job but gave up, all the people with part-time jobs that want a full-time job, all the people who dropped off the unemployment rolls because their unemployment benefits ran out, etc., you get a closer picture of what the unemployment rate is. That number is in the last row labeled U-6.
While the "official" unemployment rate is an unacceptable 9.0%, U-6 is much higher at 15.9%.
Things are much worse than the reported numbers would have you believe, and this month's report was exceptionally weak beneath the surface.
As designed by Zero, Pelosi, Reid and the rest of the DC Elitists.
Hey, but at least we have a President we can “feel good” about. /sarc
The infuriating thing is that they think the public doesn't know that things are that bad. If it were just one region of the country or segment of the workforce it would be easy to hide but what is happening is across the board and it is really affecting skilled positions, both white and blue collar.
Gas prices are going to hurt that industry.
You are so right.. they think that they can play with numbers and the dumb public will buy it..
Even liberals know how many of their friends, neighbors and family are unemployed or underemployed ..
 For those who can find jobs, these jobs are increasingly part time:
It’s sickening to watch the Media contortions, in their attempt to turn bad news (higher unemployment) into ‘good’ news.
They said the unemployment spike (to 9%) is actually GOOD news because formerly Discouraged workers are reentering the labor market looking for jobs.
But - but - that’s an admission that the Un rate we’ve BEEN suffering under for the past couple years has been MUCH HIGHER THAN REPORTED!
The Unemployer-in-Chief has done enormously MORE damage to Americans’ income and jobs than anyone’s admitted. “Women and Blacks hurt most,” etc.
and somehow to the resident DC DimWits ....this is al so “unexpected”....
Isn't it about time to begin seriously discussing impeachment and removal for malfeasance based on total incompetence?
I would also like to ask them if they have an age distribution as well. For those in their 20s (presumably just getting done with undergraduate/graduate education, this could not be a good sign, if the distribution is focused on them, it’s even worse, considering many of them have debts to pay off, need to get work to add to their own experience, get started making money, etc.
“The infuriating thing is that they think the public doesn’t know that things are that bad. If it were just one region of the country or segment of the workforce it would be easy to hide but what is happening is across the board and it is really affecting skilled positions, both white and blue collar.”
You’re absolutely right; while some places aren’t as bad off as others, nowhere is “doing well” compared to 5 years ago. There is no place voters can deceive themselves that “things are greener”. If the election were held this month I guarantee Obama would not be the Dem candidate.
“I would also like to ask them if they have an age distribution as well.”
I would guess a lot of the unemployed are 35 - 65, while the people hired to do the jobs they used to have, as well as the “McJobs” that are still around, are 20 - 30. They can work for $25K; they have no families or mortgages, and probably never will.
That's OK. The ruling elite are banking on most Americans to be very shallow readers.
Thanks for posting this. Most interesting.
I wonder if the BLS maintains figures on how many manufacturing (or other) jobs are filled through temporary employment services.
My pleasure.
Disclaimer: Opinions posted on Free Republic are those of the individual posters and do not necessarily represent the opinion of Free Republic or its management. All materials posted herein are protected by copyright law and the exemption for fair use of copyrighted works.