Posted on 10/25/2011 10:47:54 AM PDT by Kaslin
Previously, we've shown that the stock market's expected dividends per share are the fundamental driver of today's stock prices. In fact, we even worked out the basic math:
In the equation below "P" refers to the average stock prices for a given month, while "D" refers to the stock market's trailing year dividends per share. "s" refers to how many months ahead we might be looking to see where the stock market's trailing year dividends per share are expected to be at that point in time. "Current" means now (or your period of interest) and "current - 12 months" indicates a value that was recorded 12 months earlier (or 1 month earlier, or 13 months earlier, as whatever the case may be.)
But "m", our amplification factor, is something we've empirically observed. Typically, or at least through much of the current century, we've found its value ranges between 6.0 to 12.0, and we most often select the mid-range value of 9.0 for use in forecasting where stock prices are headed.
But what affects the actual value of this amplification factor? We've previously observed that it can vary substantially, as this single component in our math absorbs what we describe as "noise" in the market, but what if it has its own fundamental component?
We ask that question today because we think we're on to something. The chart below, updated from the version we posted one month ago, shows the game that's afoot (the only changes are that we finalized the data point for September 2011 and added a new data point covering this point in time through October 2011): 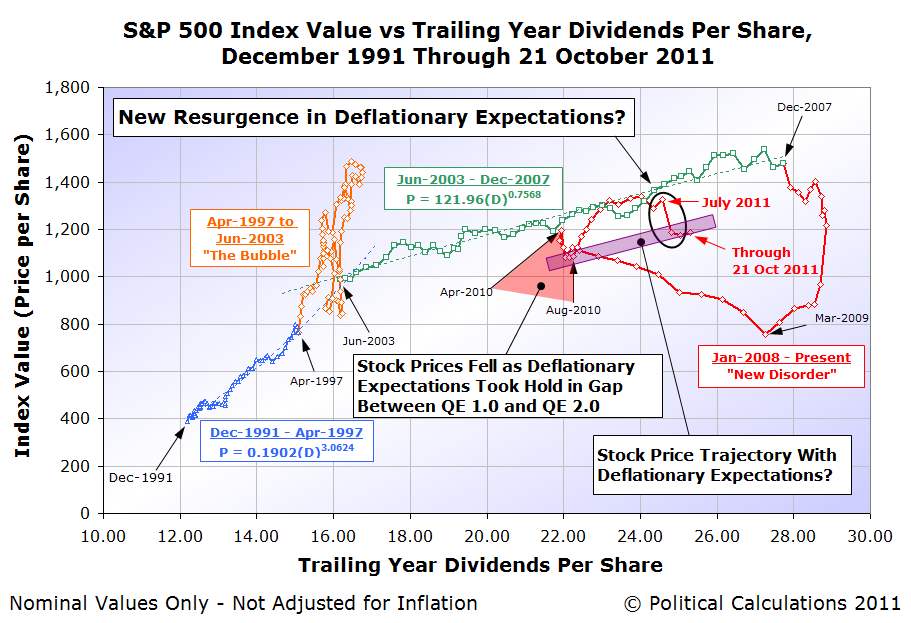
Right now, trailing year dividends per share for the S&P 500 are retracing the exact same levels they first recorded in the years from June 2003 through December 2007. But, stock prices aren't at the same level as they were during that period. They are instead about 14-16% below that earlier trajectory.
The last time that happened, was the months of May through September 2010. And what made those months unique is that they fell in the gap between the Federal Reserve's QE 1.0 and QE 2.0 programs, where the Federal Reserve used a strategy of "quantitative easing" to actively fight the prospects for deflationary conditions taking hold in the U.S. economy during the months that these programs ran.
During the five months from May through September 2010, the Federal Reserve had no quantitative easing program in place to combat deflationary conditions from taking hold in the U.S. economy. In the absence of those programs, expectations for deflationary conditions returned to the U.S. economy.
By contrast, the period from June 2003 through December 2007 was characterized by relatively steady inflationary conditions. Coincidentally, about the same level that we briefly recorded in January through May of 2011.
In our math, the only way we can have approximately the same changes in the growth rate of dividends per share and the approximately the same dividends per share without having the same average stock prices is for the value of the amplification factor, m, to be different. And what appears to be different during the periods of interest we've described above is the expectations of investors with respect to the future rate of inflation.
Ultimately, if we're right, we'll be able to more precisely quantify the value of "m" for use in our stock market math, rather than just going by empirical observations. We'll be better able to forecast where stock prices will go next, which is saying something because we're already pretty good at that.
But then, as we said last month too, we're pretty sure that most investors today would really rather not be part of the science experiment we need to run to get better at that. After all, it took some pretty scary bouts of deflationary pressures for us to notice there might be some sort of connection....
Ultimately, if we’re right, we’ll be able to more precisely quantify the value of “m” for use in our stock market math, rather than just going by empirical observations.
_______________________________________________________________________________________________________________________________
they’ve said that all of my life.
just around the corner.
This is a complex “calculation” that has to take into consideration that Tsys not only yield so little, but appear to be ready to rise in yield (meaning they would decline in price, DRASTICALLY) that stocks with divs become more attractive. There are many factors which affect the preference of investors or speculators into one vehicle or another, and those factors are subject to change over time.
I will say this however: I believe that most long term gains in the stock market are as a result of dividends, not capital gains.
That's right. You'll be getting the inside skinny you need, the Gann angle, the Investor's Strategic Men/Boys Differentiator, in your mailbox right after we cash your two-year subscription check.
Uyup.
Disclaimer: Opinions posted on Free Republic are those of the individual posters and do not necessarily represent the opinion of Free Republic or its management. All materials posted herein are protected by copyright law and the exemption for fair use of copyrighted works.