Skip to comments.
Disability Fraud vs. Expiring Unemployment Benefits Revisited
Townhall.com ^
| May 12, 2012
| Mike Shedlock
Posted on 05/12/2012 6:49:53 AM PDT by Kaslin
In response to 2.2 Million Go On Disability Since Mid-2010; Fraud Explains Falling Unemployment Rate I received a nice email from Madeline Schnapp, Director, Macroeconomic Research at TrimTabs Investment Research.
Madeline Writes ...
Hello Mish,
I loved your disability graph so decided to expand on that theme some more and took a look at the relationship between the trend in disability recipients and the roll off of recipients of emergency and extended unemployment insurance programs.
Should we dare say there is a stunning relationship!
Enjoy,
Best, Madeline
Amazing Achievement is Fraud
First consider a few snips from my previous post, then we will take a look at what TrimTabs has to say.
In the last year, the civilian population rose by 3,638,000. Yet the labor force only rose by 945,000. Those not in the labor force rose by 2,693,000.
In the last month, actual employment fell by 169,000, but the unemployment rate dropped by .1%.
That is an amazing "achievement" to say the least.
Since Mid-2010 2.2 Million Went on Disability

Notice the jump in claims after the recession was allegedly long-over.
The timing coincides with unemployment benefits expiring at 99 weeks. Supposedly higher taxes will fix the problem. I say "nonsense".Trim Tabs Weekly Macro Analysis
Please consider snips from the TrimTabs Weekly Forecast for May 8, 2012.
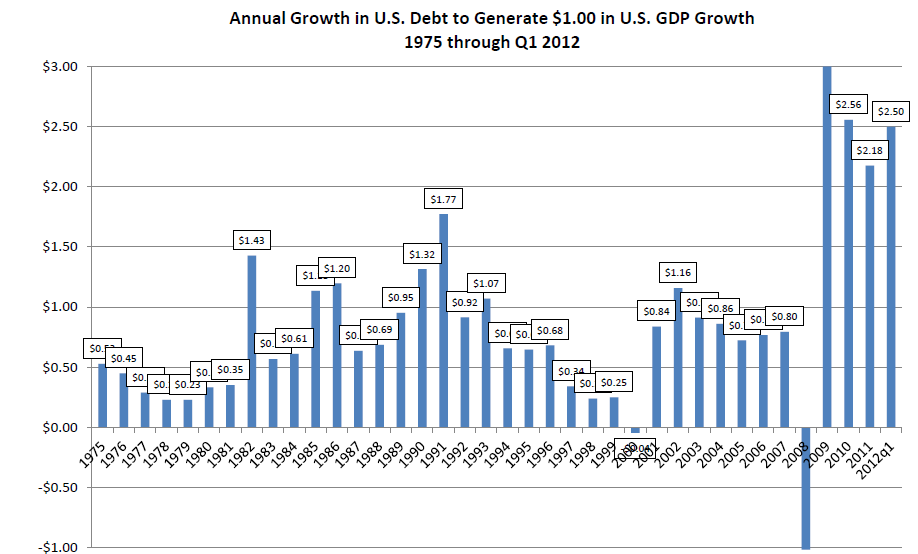
A recent post on the popular ZeroHedge financial blog compared the annualized growth in federal debt to the annualized growth in GDP in Q1 2012. ZeroHedge reported that while U.S. government debt rose by $359.1 billion in Q1 2012, the U.S. GDP grew only $142.4 billion. Durden noted that, “It now takes $2.52 in new federal debt to buy $1 worth of economic growth.”
See Chart Of The Day: Change In Q1 American Debt And GDP
The surprising observation prompted us to examine the relationship between growth in debt and growth in GDP from 1975 through 2012. What we found is both astonishing and frightening. From 1974 to 1980, each $1 increase in GDP was accompanied by an increase in debt of between 20 and 47 cents. Since 2009, however, each $1 increase in GDP has been accompanied by a whopping $2.50 increase in debt. At some point, the amount of debt required to generate $1 of GDP will suffocate the economy and trigger another financial shock.
In Q1 2012, GDP rose $142 billion, while debt rose $355 billion. In other words, it took $2.50 in debt to generate $1.00 in GDP. We wanted to understand how this relationship compared to those that prevailed in previous decades. The graph below shows our findings.
click on chart for sharper image
From 1974 to 1980, each $1 increase in GDP was accompanied by an increase in debt of between 23 and 53 cents. Since 2009, however, each $1 increase in debt has been accompanied by a whopping $2.41 increase in debt. At some point, the amount of debt required to generate $1 of GDP will suffocate the economy and trigger another financial shock.
Another recent post on the popular Global Economic Trend Analysis blog (hat tip to Mish Shedlock) suggested the recent declines in the unemployment rate were due, in part, to the rapid increase in enrollment in disability because people on disability are no longer counted as unemployed.
Please see 2.2 Million Go On Disability Since Mid-2010; Fraud Explains Falling Unemployment Rate
In his blog post Shedlock reported, “Since mid-2010, precisely the time million of U.S. citizens used up all of their 99 weeks of unemployment insurance, disability claims have risen by 2.2 million.”
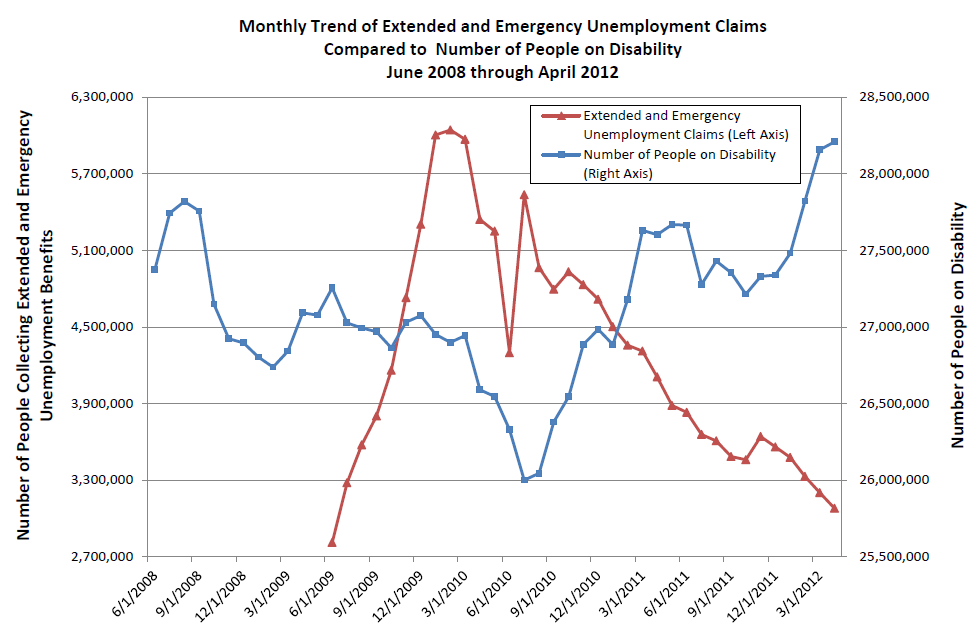
Mish's observation prompted us to dig a little deeper into the relationship between the number of people exhausting extended and emergency unemployment benefits compared to the increase in disability recipients. What we discovered was interesting, to say the least.
click on chart for sharper image
From July 2010 to April 2012, the decline in the number of people collecting extended and emergency unemployment benefits was 2.46 million. Over the same time period the number of people collecting disability benefits increased by 2.20 million. We suspect the similarity in the inverse relationship is more than coincidence.
TOPICS: Business/Economy; Crime/Corruption; Culture/Society; Editorial
KEYWORDS:
1
posted on
05/12/2012 6:49:57 AM PDT
by
Kaslin
To: Kaslin
This makes me sick. Why do these clowns get ON disability then never to get off. What a scam. If you can’t do heavy lifting, work in a retail store. You are not disaabled, you are lazy.
I always remind folks about Stevie Wonder, Ray Charles, etc. Gee golly - did those guys sit on their hands, cry the blues or get off their butts and work hard. I so admired the efforts of both!
2
posted on
05/12/2012 7:02:47 AM PDT
by
WaterWeWaitinFor
(If we don't help make a change, then who will? It starts with us.)
To: Kaslin
To me, this is another reason why this nation will not be reformed.
The people themselves are shameless and corrupt. Willing to lie and commit fraud, believing they are entitled to free stuff.
This is the legacy of the left, an entire generation bereft of responsibility.
3
posted on
05/12/2012 7:04:18 AM PDT
by
ecomcon
To: Kaslin
4
posted on
05/12/2012 7:05:55 AM PDT
by
Mikey_1962
(Obama: The Affirmative Action President.)
To: Kaslin
Open up a free money store and the lines will be long..
5
posted on
05/12/2012 7:12:29 AM PDT
by
vietvet67
To: vietvet67
Open up a free money store and the lines will be long..
WOOT , Obama Bucks for all
6
posted on
05/12/2012 7:58:51 AM PDT
by
molson209
To: Kaslin
Romney needs to begin a systematic audit and re-certification for everyone on disability.
It’s not easy, but Romney could probably perform a radical benefit-ectomy on a few million lazy bums.
It would be simple to show that someone had previous paid employment and question what changed.
7
posted on
05/12/2012 8:02:42 AM PDT
by
darth
To: darth
Romney needs to begin a systematic audit and re-certification for everyone on disability. Would have happened with Newt, but not a chance with Romney. But he is better than King Obama.
To: Kaslin
Reminds me of this angry looking pigeon that was wobbling around on the steps of the Air and Space museum.
Evidently rendered too fat to fly by handouts...

Where's MY Pie?
9
posted on
05/12/2012 9:32:37 AM PDT
by
wm25burke
To: darth
I want to know who these people are!!! I have the right to know where my tax dollars are going!!! The USDA lists online the names of farmers who receive subsidies. I want the SSA to list online the names of all the disabled people the working people are subsidizing.
10
posted on
05/12/2012 9:33:14 AM PDT
by
abclily
To: abclily
I wonder if a FOIA could be used?
Then private watchdog groups could observe the “disabled” lifting weights, carousing in night clubs, selling crack, or whatever no-goods do every day.
11
posted on
05/12/2012 1:05:51 PM PDT
by
darth
To: Kaslin
Part of the surge in SSDI payments is directly related to age.
People over 50 with limited skills are being systematically shut out of the workforce.
The blunt truth is that a large percentage - not all, but a large percentage - of blue collar workers over age 50 are not competitive with younger workers.
Many of the older workers work more slowly, or work with less energy, or are inflexible about switching jobs or learning new skills, they can be harder to manage, they are more likely to get injured, their health insurance costs are higher, and they often create serious resentment among younger workers, who are often paid the same as older workers, but produce much more.
If employers have a choice between a married 30 year old or a 55 year old with equal skills, well, that’s not a choice at all.
I can’t speak for the rest of the country, but here in Seattle we have an infinite supply of 20 year old immigrants who work without complaint for $10 an hour.
When faced with competition like that, a lot of older workers are going to show up at the Social Security office and invent or exaggerate their pain or mobility issues.
It’s not the morally correct decision.
But the number of people who will have to make this decision is going to go up EVERY year.
Disclaimer:
Opinions posted on Free Republic are those of the individual
posters and do not necessarily represent the opinion of Free Republic or its
management. All materials posted herein are protected by copyright law and the
exemption for fair use of copyrighted works.
FreeRepublic.com is powered by software copyright 2000-2008 John Robinson