And before the usual Leftists rush out to scream their usual lie about "inherited debt" here is the actual history of Federal Deficit since 1992.
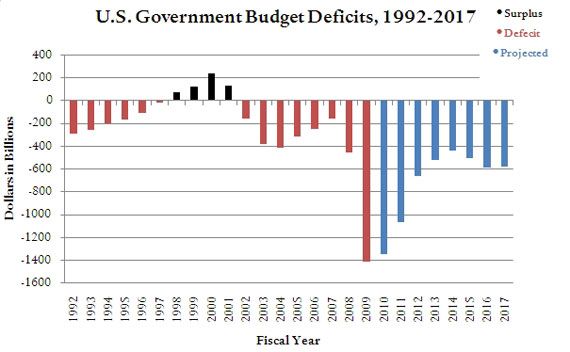
FY 1992-1993 Bush 1 and Dem Congress. FY 1994-95 Clinton and a Dem Congress. FY 1996-2001 Clinton and a GOP Congress. FY 2002-2003 Bush 2 and GOP House/Dem Senate. FY 2004-2007 Bush and a GOP Congress. FY 2008-2011 Obama and Dem Congress. FY 2012+ Obama/GOP House/Dem Senate.
Your chart seems off. FY 2012 is projected to be around 650 billion, and 2013 at even less than that. The only way we can achieve those numbers is through massive defense cuts.
In an unrelated matter, I understand the 1.4 Trillion deficit the year Bush left office (bailout 700 billion + stimulus 800 billion); however, I don’t understand why it would be trillion+ for a couple of years afterwards....Some of it might be lost tax revenues, increased debt payment, few workers paying less in tax....however, this does not compute. Please explain if someone has a logical answer. Thanks.