Skip to comments.
Mish Takes the Most Complete Look at Employment and Unemployment Anywhere
Townhall.com ^
| December 8, 2012
| Mike Shedlock
Posted on 12/08/2012 8:10:49 AM PST by Kaslin
Initial Reaction
The establishment report of +146,000 jobs was about what most expected.
However, beneath the surface, this report looks grim.
The household survey shows a loss of 122,000 jobs. The unemployment rate dropped by .2% because the labor force fell by 350,000 and those "not in the labor force" rose by a whopping 542,000.
Thus, we are back to the previous 2012 pattern of witnessing unemployment rate drop largely because of a massive increase of those "not" in the labor force.
No Effect From Hurricane Sandy
Hurricane Sandy had no effect. The BLS reports "Our survey response rates in the affected states were within normal ranges. Our analysis suggests that Hurricane Sandy did not substantively impact the national employment and unemployment estimates for November."
November BLS Jobs Report at a Glance
- Payrolls +146,000 - Establishment Survey
- US Employment -122,000 - Household Survey
- Involuntary Part-Time Work -168,000 - Household Survey
- Baseline Unemployment Rate -.02 at 7.7% - Household Survey
- U-6 unemployment -.02 to 14.4% - Household Survey
- The Civilian Labor Force -350,000 - Household Survey
- Not in Labor Force +542,000 - Household Survey
- Participation Rate -.2 to 63.6 - Household Survey
Recall that the unemployment rate varies in accordance with the Household Survey not the reported headline jobs number, and not in accordance with the weekly claims data.
Quick Notes About the Unemployment Rate
- US unemployment rate -.2 to 7.7%
- In the last year, those "not" in the labor force rose by 2,380,000
- Over the course of the last year, the number of people employed rose by 2,648,000
- Long-Term unemployment (27 weeks and over) was 4,786,000 a decline of 216,000
- Ratio of long-term unemployment to overall unemployment is 40.1%. Once someone loses a job it is still very difficult to find another.
October 2012 Jobs Report
Please consider the Bureau of Labor Statistics (BLS) November 2012 Employment Report.
Total nonfarm payroll employment rose by 146,000 in November, and the unemployment rate edged down to 7.7 percent, the U.S. Bureau of Labor Statistics reported today. Employment increased in retail trade, professional and business services, and health care.
Click on Any Chart in this Report to See a Sharper Image
Unemployment Rate - Seasonally Adjusted

Nonfarm Employment - Payroll Survey - Annual Look - Seasonally Adjusted

Employment is above the total just prior to the 2001 recession, and about where it was in mid-2005.
Nonfarm Employment - Payroll Survey Monthly Changes - Seasonally Adjusted

click on any chart for sharper image
Between January 2008 and February 2010, the U.S. economy lost 8.8 million jobs.
Since the employment low in February 2010, nonfarm payrolls have expanded by about 5.15 million jobs. Of the 8.8 million jobs lost between January 2008 and February 2010, approximately 58.5% percent have been recovered (not accounting for normal demographic-related job growth).
Since the beginning of the year, job growth has averaged 151,000 per month, similar to the average monthly gain of 153,000 in 2011.
Statistically, 125,000+- jobs a month is enough to keep the unemployment rate flat. For a discussion, please see Question on Jobs: How Many Does It Take to Keep Up With Demographics?
Once again, recall unemployment is based on the household survey.
Current Report Jobs

Average Weekly Hours

Index of Aggregate Weekly Hours

The index of aggregate hours paints a good picture of the stall in the recovery. Employment is up, but hours are not up proportionally. This reflects the trend to part-time workers and the reduction of hours in part-time workers.
Average Hourly Earnings vs. CPI

Average hourly earnings has been falling for years and lagging CPI inflation since September 2009. Simply put real wages have been declining. Add in increases in state taxes and the average Joe has been hammered pretty badly.
For further discussion, please see What's "Really" Behind Gross Inequalities In Income Distribution?
BLS Birth-Death Model Black Box
The BLS Birth/Death Model is an estimation by the BLS as to how many jobs the economy created that were not picked up in the payroll survey.
The Birth-Death numbers are not seasonally adjusted, while the reported headline number is. In the black box the BLS combines the two, coming up with a total.
The Birth Death number influences the overall totals, but the math is not as simple as it appears. Moreover, the effect is nowhere near as big as it might logically appear at first glance.
Do not add or subtract the Birth-Death numbers from the reported headline totals. It does not work that way.
Birth/Death assumptions are supposedly made according to estimates of where the BLS thinks we are in the economic cycle. Theory is one thing. Practice is clearly another as noted by numerous recent revisions.
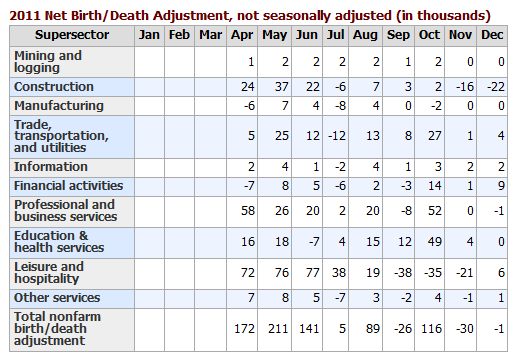
Birth Death Model Adjustments For 2011

Birth Death Model Adjustments For 2012

Birth-Death Notes
Once again: Do NOT subtract the Birth-Death number from the reported headline number. That approach is statistically invalid.
Note the historically rare occurrence this month of a negative non-January adjustment.
In general, analysts attribute much more to birth-death numbers than they should. Except at economic turns, BLS Birth/Death errors are reasonably small.
For a discussion of how little birth-death numbers affect actual monthly reporting, please see BLS Birth/Death Model Yet Again.
Household Survey Data

click on chart for sharper image
In the last year, the civilian noninstitutional population rose by 3,733,000. Yet the labor force only rose by 1,354,000.
Those "not" in the labor force rose by 2,380,000 to 88,883,000.
The massive rise of those "not" in the labor force is primarily economic weakness, not demographics. Actually, older workers are returning to the work force because they cannot afford retirement. One look at the average age of Walmart greeters and those working in fast food restaurants tells a story itself.
Decline in Labor Force Factors
- Discouraged workers stop looking for jobs
- People retire because they cannot find jobs
- People go back to school hoping it will improve their chances of getting a job
- People stay in school longer because they cannot find a job
Were it not for people dropping out of the labor force, the unemployment rate would be well over 10%.
Part Time Status (in Thousands)

click on chart for sharper image
There are 8,176,000 workers who are working part-time but want full-time work. This is a volatile series.
BLS Alternate Measures of Unemployment

click on chart for sharper image
Table A-15 is where one can find a better approximation of what the unemployment rate really is.
Notice I said "better" approximation not to be confused with "good" approximation.
The official unemployment rate is 7.7%. However, if you start counting all the people that want a job but gave up, all the people with part-time jobs that want a full-time job, all the people who dropped off the unemployment rolls because their unemployment benefits ran out, etc., you get a closer picture of what the unemployment rate is. That number is in the last row labeled U-6.
U-6 is much higher at 14.4%. Both numbers would be way higher still, were it not for millions dropping out of the labor force over the past few years.
Duration of Unemployment
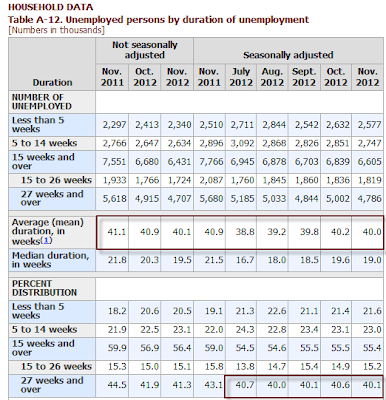
Long-term unemployment remains in a disaster zone with 40% of the unemployed in the 27 weeks or longer category. Median duration of unemployment has been rising for 3 months while the average has been hovering right around 40 weeks for a year.
Grossly Distorted Statistics
Given the complete distortions of reality with respect to not counting people who allegedly dropped out of the work force, it is easy to misrepresent the headline numbers.
Digging under the surface, the drop in the unemployment rate over the past two years is nothing but a statistical mirage. Things are much worse than the reported numbers indicate.
Last month I said "before anyone gets too excited about this jobs report, note that it is just one month, and it may be revised away. Even if not, take another look at the index of aggregate hours and average wages vs. CPI because those charts reflect very important stories not at all seen in the headline numbers."
This month shows pronounced weakness in the underlying numbers.
For a look ahead to 2013, please see Small Business Owners' Hiring Intent Plunges to 2008 Lows; Don't Blame Sandy or Fiscal Cliff.
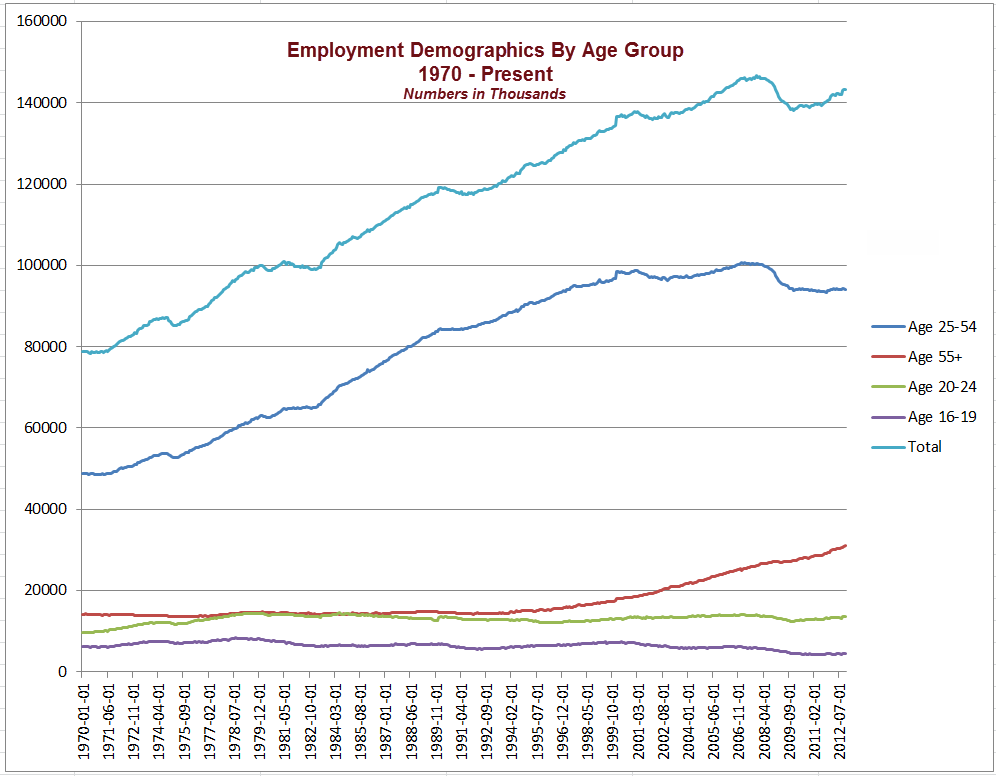
ZeroHedge had an interesting set of charts of BLS data in his post Number Of Workers Aged 25-54 Back To April 1997 Levels.
I picked up on that theme and put together this chart of BLS data showing various age groups.
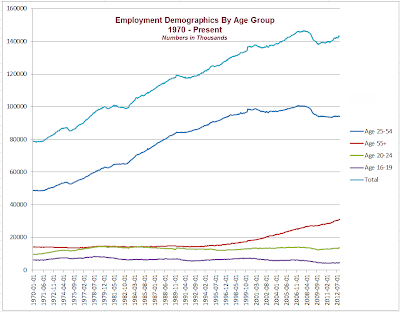
click on chart for sharper image
Demographic Points of Note
- Employment in age group 25-54 is 94,063,000
- Employment in age group 25-54 was 94,167,000 in April 1997
- Total employment is 143,257,000
- Total employment was 143,449,000 in February 2006
- The low employment for age group 25-54 was 93,356,000 in October 2011, 28 months after the recovery began
- Total employment at the start of the recovery in June 2009 was 140,074,000
- Age 55 and up employment at the start of the recovery was 27,105,000
- Age 25-54 employment at the start of the recovery was 95,264,000
- Age 55 and up employment is now 31,119,000
- Age 25-54 employment is now 94,063,000
Reflections on the Recovery
- Since the start of the recovery, the economy added 3,183,000 total jobs
- Since the start of the recovery, the economy added 4,014,000 jobs in age group 55+
- Since the start of the recovery, the economy lost 831,000 jobs of those between 16-54
- Since the start of the recovery, the economy lost 1,201,000 jobs of those between 25-54
Boomer demographics certainly explains "some" of this trend.
For the rest of the trend, consider my comment in today's job report:
Establishment Survey +146,000; Household Survey -122,000 Jobs; Unemployment 7.7% as Labor Force Shrinks by 350,000In the last year, the civilian noninstitutional population rose by 3,733,000. Yet the labor force only rose by 1,354,000.
Those "not" in the labor force rose by 2,380,000 to 88,883,000.
The massive rise of those "not" in the labor force is primarily economic weakness, not demographics.
Actually, older workers are returning to the work force because they cannot afford retirement. One look at the average age of Walmart greeters and those working in fast food restaurants tells a story itself.Flashback May, 1 2008
For point of record, consider what I said on May 1, 2008 in Demographics Of Jobless Claims
Ironically, older part-time workers remaining in or reentering the labor force will be cheaper to hire in many cases than younger workers. The reason is Boomers 65 and older will be covered by Medicare (as long as it lasts) and will not require as many benefits as will younger workers, especially those with families. In effect, Boomers will be competing with their children and grandchildren for jobs that in many cases do not pay living wages.
TOPICS: Business/Economy; Culture/Society; Editorial
KEYWORDS:
1
posted on
12/08/2012 8:10:54 AM PST
by
Kaslin
To: Kaslin
2
posted on
12/08/2012 8:15:45 AM PST
by
Chode
(American Hedonist - *DTOM* -ww- NO Pity for the LAZY)
To: Chode
3
posted on
12/08/2012 8:20:07 AM PST
by
Travis McGee
(www.EnemiesForeignAndDomestic.com)
To: Kaslin
Just a quick question. Wouldn’t U6 trend upward with all of the people being ‘removed’ from the work force?
4
posted on
12/08/2012 8:22:37 AM PST
by
fhayek
To: Kaslin
What is so bad about all this is that the Fed has had interest rates at ZERO percent since the end of 2008. This recovery is built on QUICKSAND of debt and Fed unsustainable easing.
5
posted on
12/08/2012 8:23:34 AM PST
by
Beowulf9
To: Kaslin
What is so bad about all this is that the Fed has had interest rates at ZERO percent since the end of 2008. This recovery is built on QUICKSAND of debt and Fed unsustainable easing.
6
posted on
12/08/2012 8:23:40 AM PST
by
Beowulf9
To: Kaslin
To: Travis McGee

100%
8
posted on
12/08/2012 8:27:11 AM PST
by
Chode
(American Hedonist - *DTOM* -ww- NO Pity for the LAZY)
To: fhayek
Just a quick question. Wouldn’t U6 trend upward with all of the people being ‘removed’ from the work force? U6 includes people that are under employed. People that aren't looking for a job aren't counted in that category.
9
posted on
12/08/2012 9:44:24 AM PST
by
EVO X
To: Kaslin
Even Fox News is neglecting to point out obvious statistics like the staggering numbers “ dropped” from the labor pool.
To: Kaslin
Even Fox News is neglecting to point out obvious statistics like the staggering numbers “ dropped” from the labor pool.
To: 21st Century Crusader
Even Fox News is neglecting to point out obvious statistics like the staggering numbers “ dropped” from the labor pool. Maybe Fox's back office has decided that, with the election over, they need to join the "happytalk" campaign to "boost consumer confidence". Or whatever you boost by not talking about depressing topics.
Disclaimer:
Opinions posted on Free Republic are those of the individual
posters and do not necessarily represent the opinion of Free Republic or its
management. All materials posted herein are protected by copyright law and the
exemption for fair use of copyrighted works.
FreeRepublic.com is powered by software copyright 2000-2008 John Robinson