Skip to comments.
Last Hurrah for Jobs?
Townhall.com ^
| February 2, 2013
| Mike Shedlock
Posted on 02/02/2013 3:42:46 PM PST by Kaslin
The establishment survey reported a gain of 157,000 job this month.
However, for the third consecutive month, the household survey is much weaker than the headline number.
The household survey shows a gain of a mere 17,000 jobs. Last month the household survey gained only 28,000 jobs. The unemployment rate rose to 7.9%.
As measured by the household survey (the basis for the reported unemployment number) the number of unemployed rose by 126,000.
Note: The BLS did not produce its usual collection of graphs today that I normally include in this report. I was scrambling to find them but the report has changed, perhaps just for this month.
Massive population adjustments may explain the lack of charts this month.
Census Adjustments
Last month I stated "In the last year, the civilian noninstitutional population rose by 3,766,000"
This month I report "In the last year, the civilian noninstitutional population rose by 2,394,000. That is a huge downward census adjustment.
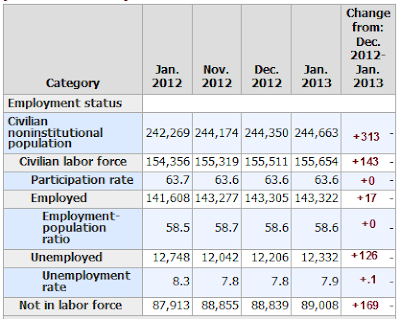
December BLS Jobs Report at a Glance
- Payrolls +157,000 - Establishment Survey
- US Employment +17,000 - Household Survey
- US Unemployment +126,000 - Household Survey
- Involuntary Part-Time Work +55,000 - Household Survey
- Baseline Unemployment Rate +.01 at 7.9% - Household Survey
- U-6 unemployment +.00 to 14.4% - Household Survey
- The Civilian Labor Force +143,000 - Household Survey
- Not in Labor Force +169,000 - Household Survey
- Participation Rate +.00 to 63.6 - Household Survey
Recall that the unemployment rate varies in accordance with the Household Survey not the reported headline jobs number, and not in accordance with the weekly claims data.
Quick Notes About the Unemployment Rate
- In the last year, those "not" in the labor force rose by 1,095,000
- Over the course of the last year, the number of people employed rose by 1,714,000
- In the last year the number of unemployed fell from 12,748,000 to 12,322,000 (a drop of 426,000)
- Long-Term unemployment (27 weeks and over) was 4,708,000 a decline of 58,000
- Percentage of long-term unemployment is 38.1%. Once someone loses a job it is still very difficult to find another.
January 2012 Jobs Report
Please consider the Bureau of Labor Statistics (BLS) January 2012 Employment Report.
Total nonfarm payroll employment increased by 157,000 in January, and the unemployment rate was essentially unchanged at 7.9 percent, the U.S. Bureau of Labor Statistics reported today. Retail trade, construction, health care, and wholesale trade added jobs over the month.
Click on Any Chart in this Report to See a Sharper Image
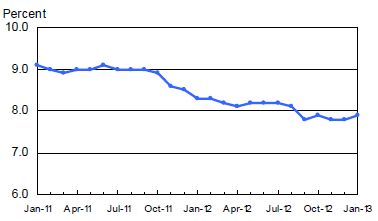
Unemployment Rate - Seasonally Adjusted
Average weekly hours remained flat at 34.4 hours. A year ago average hours were 34.5 hours. Average hourly earnings rose this month from $23.74 to $23.78.
Real wages have been declining. Add in increases in state taxes and the average Joe has been hammered pretty badly. For 2013, one needs to factor in the increase in payroll taxes for Social Security.
For further discussion of income distribution, please see What's "Really" Behind Gross Inequalities In Income Distribution?
BLS Birth-Death Model Black Box
The BLS Birth/Death Model is an estimation by the BLS as to how many jobs the economy created that were not picked up in the payroll survey.
The Birth-Death numbers are not seasonally adjusted, while the reported headline number is. In the black box the BLS combines the two, coming up with a total.
The Birth Death number influences the overall totals, but the math is not as simple as it appears. Moreover, the effect is nowhere near as big as it might logically appear at first glance.
Do not add or subtract the Birth-Death numbers from the reported headline totals. It does not work that way.
Birth/Death assumptions are supposedly made according to estimates of where the BLS thinks we are in the economic cycle. Theory is one thing. Practice is clearly another as noted by numerous recent revisions.
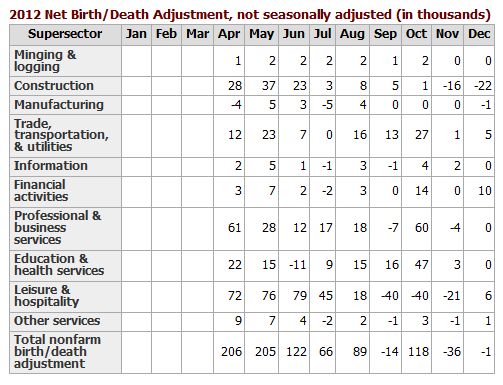
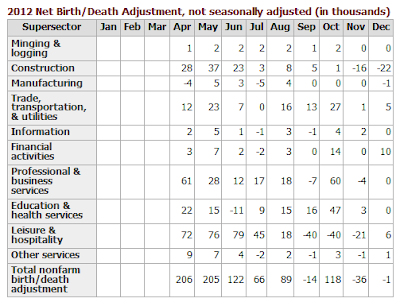
Birth Death Model Adjustments For 2012
Birth Death Model Adjustments For 2013
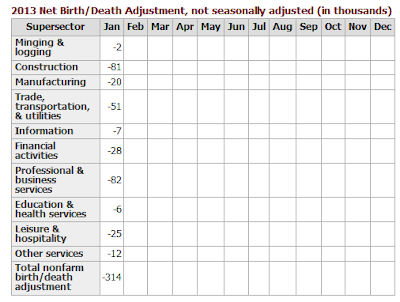
Birth-Death Notes
Once again: Do NOT subtract the Birth-Death number from the reported headline number. That approach is statistically invalid.
In general, analysts attribute much more to birth-death numbers than they should. Except at economic turns, BLS Birth/Death errors are reasonably small.
For a discussion of how little birth-death numbers affect actual monthly reporting, please see BLS Birth/Death Model Yet Again.
Household Survey Data
click on chart for sharper image
There were massive revisions in labor force statistics this month.
Last month I stated "In the last year, the civilian noninstitutional population rose by 3,766,000.
This month I report "In the last year, the civilian noninstitutional population rose by 2,394,000. That is a huge downward census adjustment.
Last month I reported "Year-over-year, those not in the labor force rose by 2,394,000
This month I report "Year-over-year, those not in the labor force rose by 1,095,000 to 89,008,000."
In the last year, the labor force rose by 1,298,000.
Decline in Labor Force Factors
- Discouraged workers stop looking for jobs
- People retire because they cannot find jobs
- People go back to school hoping it will improve their chances of getting a job
- People stay in school longer because they cannot find a job
Were it not for people dropping out of the labor force, the unemployment rate would be well over 10%.
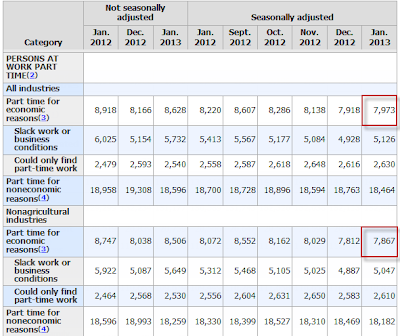
Part Time Status (in Thousands)
click on chart for sharper image
There are 7,918,000 workers who are working part-time but want full-time work. This is a volatile series.
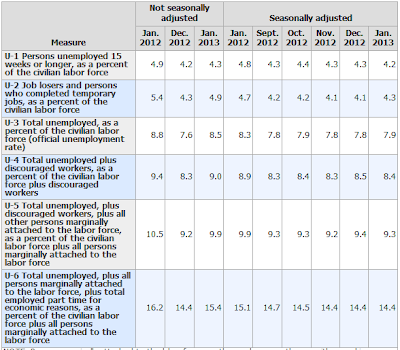
Table 15 BLS Alternate Measures of Unemployment
click on chart for sharper image
Table A-15 is where one can find a better approximation of what the unemployment rate really is.
Notice I said "better" approximation not to be confused with "good" approximation.
The official unemployment rate is 7.9%. However, if you start counting all the people who want a job but gave up, all the people with part-time jobs that want a full-time job, all the people who dropped off the unemployment rolls because their unemployment benefits ran out, etc., you get a closer picture of what the unemployment rate is. That number is in the last row labeled U-6.
U-6 is much higher at 14.4%. Both numbers would be way higher still, were it not for millions dropping out of the labor force over the past few years.
Duration of Unemployment
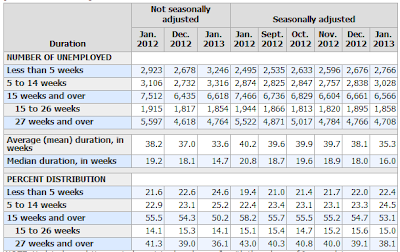
Long-term unemployment remains in a disaster zone with 38% of the unemployed in the 27 weeks or longer category.
Grossly Distorted Statistics
Given the complete distortions of reality with respect to not counting people who allegedly dropped out of the work force, it is easy to misrepresent the headline numbers.
Digging under the surface, much of the drop in the unemployment rate over the past two years is nothing but a statistical mirage. Things are much worse than the reported numbers indicate.
The Last Hurrah?
For the third month in a row, the underlying numbers were weak. The revisions to the population statistics support some of the drop in the unemployment rate, but those adjustments are in the past.
The recent divergence between the household survey and the payroll survey will close. The question is which way. Given business hiring plans, Obamacare adjustments, and the increase in payroll taxes that will take 2% of consumer spending away from those who need it most, I expect this is the last hurrah for jobs.
For a look ahead to 2013, please see Small Business Owners' Hiring Intent Plunges to 2008 Lows; Don't Blame Sandy or Fiscal Cliff.
TOPICS: Business/Economy; Culture/Society; Editorial
KEYWORDS:
1
posted on
02/02/2013 3:42:47 PM PST
by
Kaslin
To: Kaslin
Oh, I thought this was about Steve Jobs. Never mind.
To: Kaslin
It may be in the report, but I didn’t see it: gas prices are rocketing upward.
3
posted on
02/02/2013 3:49:37 PM PST
by
gusopol3
To: Kaslin
As Obama-Kare kicks in employment will continue to drop.
The medical benefits cost per employee will skyrocket to the level that it will become a big incentive to reduce employee count and/or find alternate ways to get jobs done.
Employers will be reducing employment within the USA in every way possible to avoid the crippling new taxes and fees:
- Pay overtime instead of keeping higher numbers of employees
- Subcontract
- Outsource
- Automate
- Move factories out of the USA
4
posted on
02/02/2013 4:18:53 PM PST
by
Iron Munro
(I Miss America, don't you?)
To: Iron Munro
You nailed it. The official, in the know, best estimate ever given by bureaucratic nerds at the IRS estimate the low end cost of an Obamacare approved and sprinkled with his holiness water is $20,000 for a family plan. Now, let’s see, how many waitresses, step-n-fetchits, assistants to the assistant, etc. are going concerns willing to fund at 20k in addition to salary and other benefits.
Disclaimer:
Opinions posted on Free Republic are those of the individual
posters and do not necessarily represent the opinion of Free Republic or its
management. All materials posted herein are protected by copyright law and the
exemption for fair use of copyrighted works.
FreeRepublic.com is powered by software copyright 2000-2008 John Robinson