Posted on 04/05/2013 5:08:37 AM PDT by dennisw
Daily finance & investment thread (4-5-13 edition)
Trying to focus on the markets for today and each day and the economic news
This is where you can impart some investment wisdom to your fellow freepers. You can vent about the big one that got away. You can chime in how Obama is out
to wreck American capitalism.
If you see another FR economic thread you like and want to link to it here, please do
Post your favorite economic site links. Your favorite economic blogs and precious metals blogs and sites
Apmex.com is a solid place with good reputation to buy precious metals and has great presence on ebay for easy quick impulse buys such as a gift for a
college boy's graduation. College Girls too! Even high scoool.
Kitco is the best site for gold and silver charts and other precious metals information
Ping list -- on or off let me know here or via freep-mail. If I missed you then Freep-mail me
I might ping you to other interesting economic threads a few times a week. One per day maybe
Sites that posters have reccommended ------ zerohedge turdferguson
ping
Non-farm Payrolls and Unemployment in 17 minutes!
PreMarket is looking down.
Stochastics show downward trend for Russel 2000 / TNA
TZA is up in the early trading before the opening bell.
This market is more and more like Mr Toad’s Wild Ride!
NYSE Morning Update:
Ahead of the Bell: Dow futures are trading down 90 points and S&P futures are trading down 9 points following weak economic data from the US and Europe, along with geopolitical events in Asia. The focus will be on the March jobs report this morning, after the jobless claims data showed the number of Americans filing first time claims for unemployment benefits rose to a four-month high. Economists surveyed are forecasting that private employers added 200K jobs last month, while the unemployment rate is expected to remain unchanged at 7.7%. Tensions in the Korean peninsula are rising after North Korea placed intermediate range missiles on its east coast in a move that could threaten Japan, South Korea, or U.S. Pacific bases.
• Other reports on the economic calendar today, International traded for February will be out prior to the opening bell, $-44.8B is expected versus the same reading for the month prior.
• The dollar is up against the major currencies. Gold is trading at $1,554. Crude oil is currently trading at $92 a barrel.
• Yesterday, stocks advanced, despite weaker than expected jobless claims data, after The Bank of Japan said it will double its efforts on its monetary policy and the ECB said it will keep its easy monetary policy accommodative as long as necessary.
• On CNBC today, Tom Friedman, New York Times columnist, talked about geopolitical risks and the markets. Friedman said if you look globally, we need a time out right now between the situation developing in North Korea and its neighbors. He added there are a number of countries around the world on the red lines, including North Korea, Iran, Egypt, and the rest of the Middle East. Friedman believes we have been very lucky with geopolitical events around the world because investors have been focused on the recovery. Friedman pointed out, the key to the North Korean issue is the Chinese; they provide the food and energy. The Chinese are interested in a divided Korea, because what is bad for the US is good for them. Finally, he said at some point, the Chinese will have to step up and be a player in this situation.
Thursday’s Close
DJIA up 55.76 pts/-0.38%/ 14,606.11
S&P up 6.29 pts/+0.40%/ 1,559.98
Nasdaq up 6.38 pts/+0.20%/ 3,224.98
Friday’s Futures
Dow Futures down 90.27 pts/-0.41%
S&P Futures down 9.50 pts/-0.61%
Nasdaq Fut down 18.25 pts/-0.66%
Overseas Markets
FTSE -1.35%
CAC 40 -1.61%
NIKKEI 225 +1.58%
HANG SENG -2.73%
Overseas: World stock markets are lower today. European and Asian markets are down on weak economic data from the euro zone region, and concerns the non-farm payroll data will disappoint.
Economic Reports: Employment Situation expected to be 200K, International Trade expected to be $-44.8B at 8:30 a.m., and Consumer Credit expected to be $15.0B.
Top Headlines:
• Three members of the board of directors of Hewlett Packard (HPQ), including Ray Lane are stepping down from their post, after they were barely elected. The directors were on the board when HP acquired British software company Autonomy Corp, which led to a $8.8 billion writedown.
• Reports indicate Anheuser-Busch InBev NV (BUD) and the DOJ are close to a settlement of a lawsuit seeking to block the brewer’s purchase of Grupo Modelo SAB.
• Reports indicate Blackstone Group (BX) and Michael Dell have yet to tackle a critical issue of agreeing on what role he would play if the private-equity firm wins the bidding for the computer maker.
Commodities/Currency:
Gold: up $1.60 to $1,554.80
Oil: down 0.53 to $92.08
EUR/USD 1.2919 -0.0011
USD/JPY 96.2150 -0.3440
GBP/USD 1.5221 -0.0015
Volatility Index (VIX): As of the close of business Thursday, April 4, the VIX is up 0.88 at 13.58
Companies Reporting Quarterly Earnings:
Penford reports Q2 EPS 10c, vs. Est 14c and Q2 revenue $89M, vs. Est to $86.2M a year ago.
Today’s Opening and Closing Bells:
Grace Institute Visits the NYSE Shari Krull, Executive Director will ring the opening bell.
World Wrestling Entertainment, Inc. will ring the closing bell.
thanks for your daily market lines
US Department of Labor
A to Z Index | FAQs | About BLS | Contact Us
U.S. Bureau of Labor Statistics
Follow Us Follow BLS on Twitter | What’s New | Release Calendar | Site Map
Home
Subject Areas
Databases & Tools
Publications
Economic Releases
Beta
Economic News Release
FONT SIZE:Minus Font SizePlus Font Size PRINT: Print
CPS CPS Program Links
CES CES Program Links
SHARE ON: share on facebook share on twitter share on linkedin
Employment Situation Summary
Transmission of material in this release is embargoed USDL-13-0581
until 8:30 a.m. (EDT) Friday, April 5, 2013
Technical information:
Household data: (202) 691-6378 * cpsinfo@bls.gov * www.bls.gov/cps
Establishment data: (202) 691-6555 * cesinfo@bls.gov * www.bls.gov/ces
Media contact: (202) 691-5902 * PressOffice@bls.gov
THE EMPLOYMENT SITUATION — MARCH 2013
Nonfarm payroll employment edged up in March (+88,000), and the unemployment rate was
little changed at 7.6 percent, the U.S. Bureau of Labor Statistics reported today.
Employment grew in professional and business services and in health care but declined
in retail trade.
Household Survey Data
Both the number of unemployed persons, at 11.7 million, and the unemployment rate, at
7.6 percent, were little changed in March. (See table A-1.)
Among the major worker groups, the unemployment rates for adult men (6.9 percent),
adult women (7.0 percent), teenagers (24.2 percent), whites (6.7 percent), blacks
(13.3 percent), and Hispanics (9.2 percent) showed little or no change in March. The
jobless rate for Asians was 5.0 percent (not seasonally adjusted), little changed from
a year earlier. (See tables A-1, A-2, and A-3.)
In March, the number of long-term unemployed (those jobless for 27 weeks or more) was
little changed at 4.6 million. These individuals accounted for 39.6 percent of the
unemployed. (See table A-12.)
The civilian labor force declined by 496,000 over the month, and the labor force
participation rate decreased by 0.2 percentage point to 63.3 percent. The employment-
population ratio, at 58.5 percent, changed little. (See table A-1.)
The number of persons employed part time for economic reasons (sometimes referred to
as involuntary part-time workers) fell by 350,000 over the month to 7.6 million. These
individuals were working part time because their hours had been cut back or because
they were unable to find a full-time job. (See table A-8.)
In March, 2.3 million persons were marginally attached to the labor force, essentially
unchanged from a year earlier. (The data are not seasonally adjusted.) These individuals
were not in the labor force, wanted and were available for work, and had looked for a job
sometime in the prior 12 months. They were not counted as unemployed because they had not
searched for work in the 4 weeks preceding the survey. (See table A-16.)
Among the marginally attached, there were 803,000 discouraged workers in March, little
changed from a year earlier. (These data are not seasonally adjusted.) Discouraged workers
are persons not currently looking for work because they believe no jobs are available for
them. The remaining 1.5 million persons marginally attached to the labor force in March
had not searched for work for reasons such as school attendance or family responsibilities.
(See table A-16.)
Establishment Survey Data
Total nonfarm payroll employment edged up in March (+88,000). Over the prior 12 months,
employment growth had averaged 169,000 per month. In March, employment increased in
professional and business services and in health care, while retail trade employment
declined. (See table B-1.)
Professional and business services added 51,000 jobs in March. Over the past 12 months,
employment in this industry has grown by 533,000. Within professional and business
services, accounting and bookkeeping services added 11,000 jobs over the month, and
employment continued to trend up in temporary help services and in several other
component industries.
Job growth in health care continued in March, with a gain of 23,000, similar to the prior
12-month average. Within health care, employment increased by 15,000 in ambulatory health
care services, such as home health care, and by 8,000 in hospitals.
Construction employment continued to trend up in March (+18,000). Job growth in this
industry picked up this past fall; since September, the industry has added 169,000
jobs. In March, employment continued to expand among specialty trade contractors
(+23,000). Employment in specialty trade contractors has increased by 128,000 since
September, with the gain about equally split between the residential and nonresidential
components.
Within leisure and hospitality, employment in food services and drinking places continued
to trend up in March (+13,000). Over the past year, the industry added 262,000 jobs.
In March, retail trade employment declined by 24,000. The industry had added an average
of 32,000 jobs per month over the prior 6 months. In March, job declines occurred in
clothing and clothing accessories stores (-15,000), building material and garden supply
stores (-10,000), and electronics and appliance stores (-6,000).
Within government, U.S. Postal Service employment fell by 12,000 in March. Employment in
other major industries, including mining, manufacturing, wholesale trade, transportation
and warehousing, information, financial activities, state government, and local government,
showed little change over the month.
The average workweek for all employees on private nonfarm payrolls increased by 0.1
hour to 34.6 hours. The manufacturing workweek decreased by 0.1 hour to 40.8 hours, and
factory overtime rose by 0.1 hour to 3.4 hours. The average workweek for production and
nonsupervisory employees on private nonfarm payrolls was unchanged at 33.8 hours. (See
tables B-2 and B-7.)
In March, average hourly earnings for all employees on private nonfarm payrolls, at $23.82,
changed little (+1 cent). Over the year, average hourly earnings have risen by 42 cents,
or 1.8 percent. Average hourly earnings of private-sector production and nonsupervisory
employees, at $20.03, changed little (-1 cent) in March. (See tables B-3 and B-8.)
The change in total nonfarm payroll employment for January was revised from +119,000 to
+148,000, and the change for February was revised from +236,000 to +268,000.
____________
The Employment Situation for April is scheduled to be released on Friday, May 3, 2013, at
8:30 a.m. (EDT).
Employment Situation Summary Table A. Household data, seasonally adjusted
Employment Situation Summary Table B. Establishment data, seasonally adjusted
Employment Situation Frequently Asked Questions
Employment Situation Technical Note
Table A-1. Employment status of the civilian population by sex and age
Table A-2. Employment status of the civilian population by race, sex, and age
Table A-3. Employment status of the Hispanic or Latino population by sex and age
Table A-4. Employment status of the civilian population 25 years and over by educational attainment
Table A-5. Employment status of the civilian population 18 years and over by veteran status, period of service, and sex, not seasonally adjusted
Table A-6. Employment status of the civilian population by sex, age, and disability status, not seasonally adjusted
Table A-7. Employment status of the civilian population by nativity and sex, not seasonally adjusted
Table A-8. Employed persons by class of worker and part-time status
Table A-9. Selected employment indicators
Table A-10. Selected unemployment indicators, seasonally adjusted
Table A-11. Unemployed persons by reason for unemployment
Table A-12. Unemployed persons by duration of unemployment
Table A-13. Employed and unemployed persons by occupation, not seasonally adjusted
Table A-14. Unemployed persons by industry and class of worker, not seasonally adjusted
Table A-15. Alternative measures of labor underutilization
Table A-16. Persons not in the labor force and multiple jobholders by sex, not seasonally adjusted
Table B-1. Employees on nonfarm payrolls by industry sector and selected industry detail
Table B-2. Average weekly hours and overtime of all employees on private nonfarm payrolls by industry sector, seasonally adjusted
Table B-3. Average hourly and weekly earnings of all employees on private nonfarm payrolls by industry sector, seasonally adjusted
Table B-4. Indexes of aggregate weekly hours and payrolls for all employees on private nonfarm payrolls by industry sector, seasonally adjusted
Table B-5. Employment of women on nonfarm payrolls by industry sector, seasonally adjusted
Table B-6. Employment of production and nonsupervisory employees on private nonfarm payrolls by industry sector, seasonally adjusted(1)
Table B-7. Average weekly hours and overtime of production and nonsupervisory employees on private nonfarm payrolls by industry sector, seasonally adjusted(1)
Table B-8. Average hourly and weekly earnings of production and nonsupervisory employees on private nonfarm payrolls by industry sector, seasonally adjusted(1)
Table B-9. Indexes of aggregate weekly hours and payrolls for production and nonsupervisory employees on private nonfarm payrolls by industry sector, seasonally adjusted(1)
Access to historical data for the “A” tables of the Employment Situation Release
Access to historical data for the “B” tables of the Employment Situation Release
HTML version of the entire news release
The PDF version of the news release
Table of Contents
Last Modified Date: April 05, 2013
Recommend this page using:
share on facebookFacebook
share on twitterTwitter
share on linkedinLinkedIn
tools
Areas at a Glance
Industries at a Glance
Economic Releases
Databases & Tables
Maps
calculators
Inflation
Location Quotient
Injury And Illness
help
Help & Tutorials
FAQs
Glossary
About BLS
Contact Us
info
What’s New
Careers @ BLS
Find It! DOL
Join our Mailing Lists
Linking & Copyright Info
resources
Inspector General (OIG)
Budget and Performance
No Fear Act
USA.gov
Benefits.gov
Disability.gov
Freedom of Information Act | Privacy & Security Statement | Disclaimers | Customer Survey | Important Web Site Notices
U.S. Bureau of Labor Statistics | Division of Labor Force Statistics, PSB Suite 4675, 2 Massachusetts Avenue, NE Washington, DC 20212-0001
www.bls.gov/CPS | Telephone: 1-202-691-6378 | Contact CPS
U.S. Bureau of Labor Statistics | Division of Current Employment Statistics, PSB Suite 4860, 2 Massachusetts Avenue, NE Washington, DC 20212-0001
www.bls.gov/CES | Telephone: 1-202-691-6555 | Contact CES
count me in on this ping list please!
TZA over TNA now with the new pricing/stock split.
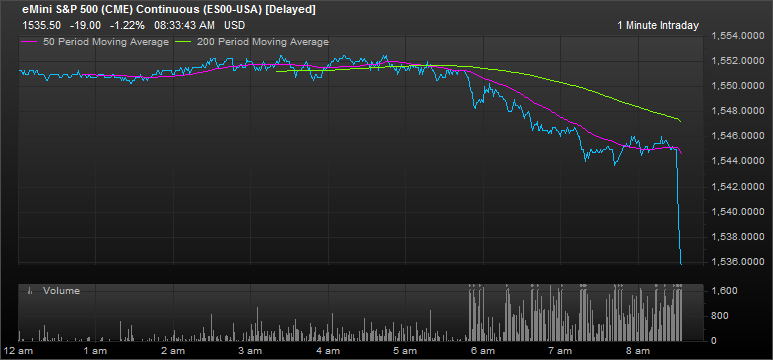
nice chart,,,what web site did you get it from?
I have a FactSet terminal and I just copied the chart and posted.
Gonna buy more of one if it goes down more.
Although this could be it, watching it with my own eyes, streaming, real time.
JC Penneys rebounding. Go figure.
I’ve been slowly buying gold this week. Bought some SAND Wed. more THM (my long term spec. gold) yesterday holding SLW (long term silver) and I had already sold my TZA (dagnabbit). I normally buy it Fri. just before the close and hold the weekend. Maybe it will come down later today. If not, I’ll hold my nose and buy just in case SHTF with either Iran or the NORKs.
Gained: 88,000 full-time jobs
Lost: 350,000 part-time jobs
Looks like a net loss of workers to me.
The miners are poison...productions cost have soared for them. Only SAND and SLW are worth thinking about. But SLW can really plunge. At its spring 2009 low it was $5/share
Actually the SLW low was 2.81 on November 21 2008
Situational awareness BUMP! Thanks to all posters.
Please add me to this ping list... Thanks!
SAND and SLW both can plunge because their idiot management tries some fancy leveraging schemes instead of going the slow but sure growth model that most of us want. I trade in and out of SLW but SAND is a new one trade. I got THM on the cheap, I can’t get too hurt on them. One day the rotation may favor the miners but probably not this year. I always want to hold a core in gold and silver and trade the rest. Happy trading.

Disclaimer: Opinions posted on Free Republic are those of the individual posters and do not necessarily represent the opinion of Free Republic or its management. All materials posted herein are protected by copyright law and the exemption for fair use of copyrighted works.