
Posted on 06/09/2020 2:51:59 AM PDT by DoughtyOne
PING LIST - Please contact me as needed...
COVID-19 Update # 83
As of 06/08/2020 23:15 PDST United States CDC - Provisional Numbers
As of 00/00/2020 23:45 PDST Johns Hopkins University - Capture Nations Informaton
As of 00/00/2020 23:45 PDST Johns Hopkins University - Capture Counties Information
As of 00/00/2020 23:46 PDST Johns Hopkins University - Process JHU Data
As of 00/00/2020 23:59 PDST WorldofMeters - Document Core Numbers
As of 00/00/2020 23:59 PDST WorldofMeters - Capture Nations Information
As of 00/00/2020 23:59 PDST WorldofMeters - Capture States Information
As of 00/00/2020 00:00 PDST WorldofMeters - Data Processing begins...
As of 00/00/2020 ??:?? PDST Publish COVID-19 Update - 00/00/00
Thank you for stopping by to check out the COVID-19 Update.
Here you can find...
Section: 01 Commentary, Special Reports, COVID-19 Update Info, & System Notes
Section: 02 the United States Situation
Section: 03 the Global Community Situation Outside China
Section: 04 the Global Community Situation Including China with reservations
Section: 05 the Mortality Report
Section: 06 Miscellaneous Reports of Interest
Section: 07 the United States, Counties (alphabetical / case no descending)
Section: 08 the United States, States Ranking, Provisional Numbers, & Territories
Section: 09 the United States, Ranked with Other Nations
Section: 10 the End of this COVID-19 Update
Section: 11 Data Sources and a Link to My Own Spreadsheet
Section: 12 Linked Spreadsheet: Counties, States, Provisional, Territories, & Nations
Section: 13 Links to Other Resources
Section: 01
Commentary, Special Reports, and COVID-19 Update Information2
Interesting Tid-bits (hopefully)
Yesterday's Summary in a Nutshell
New Cases in the United States came in at 19,148 yesterday. That was up 244
cases from the day before.
Fatalities rose to 592 in the United States. That was up 219 from the day
before
Global Cases dropped off 1,003 cases to come in at 108,709. The day before
the number was 109,712. That 108,709 was the highest Monday to date.
Fatalities on the Global scene came in at 2,568. The day before the number
was 3,937.
Brazil Tires of Bad Press and Makes a Move
The president of Brazil got a little peeved at the media in his nation, who
were giving him a hard time about Fatalities. His response was to stop
reporting out fatalities.
On the Global scene, Brazil is still reporting their cases, but their
fatalities are now a mystery.

Section: 02
The Following Addresses the Numbers Here in
the United Staetes of America
Here we go...

Our daily New Case numbers are residing in a place they haven't been since
the 24th through 26th of May. Hopefully we can't hang around down here for
a while. High reporting days just ahead.
Concept of adding in Active Cases and Serious Critical here, courtesy of amorphous
Here are more of our numbers...

Our Active Cases are still lower than they were just before the end of May.
Would like to think we've seen our highest Active Case count, but we may
not have.
Our Slice of the COVID-19 Pie
The growth of our slice of the pie has been dropping recently.
Here are the numbers I've been tracking, Globally Declared and Active Cases.

Our slice of the Global COVID-19 pie, is getting smaller. Hope that trend
can continue.
Active Cases in the United States / Chart
Unlike some of the other charts here, we should see a good rise and
fall at some point withone.
Note that this presents the one day and then 7 and 14 day averaging versions.

Remember, these are not new Declared Cases. These are remaing Active Cases.
With some wild numbers being reported on Friday, this Chart has been
disrupted a bit. It was appearing like we were going down the back side,
but the last day or so is coming around to look like only flattening.
Testing and New Case Figures
Requested by stocksthatgoup
Some folks have shown an interest in seeing the COVID-19 Test figures compared
to the New Cases being declared. The following Data addresses that.

The percentages here seem to fluctuate a bit. We're still doing good.
Here is a chart to reveal visually what the decline has looked like.

On the right there, you can see the lines weaving lower overall.
The U. S. Stats / w 10 Day Averaging / Fr: 03/17
Requested by: Texas Eagle
This data and chart presents things in a little different way. In the
chart it is easy to see the relationship of these numbers.
The Chart will use the data all the way back to 03/17, but the data displayed
here will only go back one month.

Here is the chart to match.

I like being able to follow the movement of these stats visully.
The lines are coming together here. That dynamic is much more pronounced
for the Global scene on its Chart down below.
Section: 03
The Following Addresses the Global Numbers
without Mainland China
Here is the first set of Data for the Global Outside China
Territories

Yesterday's New Cases reported out as a new record for a Monday. For about
the last three weeks, almost every day has been a record for the day. Cases
have grown steadily on the Global scene week to week.
Fata.lities, Recoveries, Resolved, Active Cases, and
Serious/Critical Cases - Globally, Excluding M/L China
Concept of adding in Active Cases and
Serious/Critical here, courtesy of amorphous
Here we go...

For your review...
How is the Global Community Outside China Doing,
Without U. S. numbers?
Let's see...

That middle number has come down considerably in the last few days, but we
are talking about a Sunday and Monday.

See how out of character Friday's number wound up being? Compare our
blue columns over the last few days. Look at that ridiculous jump, then
back down.


Globally, not looking good. We've dropped back down under 20k. That's
great.
The Active Cases outside China Globally / Chart
As in the U. S. version of this, we should see a good rise and fall at
some point these two.
Note that these present the one day and then 7 and 14 day averaging versions.


Remember, these are not new declared Cases. These are remaing active cases.
That single day line seems raring to go there.
Special Section on France, Germany, Italy, Spain, and the U. K.
Case growth.
Let's Look at Some Numbers in Five Day Increments:


The United Kingdom, in a word, balistic...
Sweden and It's Neighbors, Who Has the Best Tactic Against COVID-19?
Sweden is doing its own thing with regard to isolating. I think most people
are aware of it by now.
Here are some numbers to help us look at this issue.


Sweden still remains a hot topic, and it's tragectory IS NOT looking good
on that Chart. In it's own group, it's not good at all. If you compare it
to some European Nations, it looks no worse.
Movers and Shakers...
I will present the top fifty nations with the most New Cases and New
Fatilities.
Here we go...

The president of Brazil got a little peeved at the media in his nation, who
were giving him a hard time about Fatalities. His response was to stop
reporting out fatalities.
On the Global scene, Brazil is still reporting their cases, but their
fatalities are now a mystery.
Global osChina Stats / w 10 Day Averaging / Fr: 03/05
Requested by: Texas Eagle
This data and chart presents things in a little different way. In the
chart it is easy to see the relationship of these numbers.
The Chart will use the data all the way back to 03/05, but the data
displayed here will only go back one month.

Here is the chart to match.

I like being able to follow the movement of these stats visully.
I like seeing those trajectories intersect
Section: 04
The Following Addresses the Global Numbers
including Mainland China*
Mainland China's numbers are 0.002% of today's total global numbers.
A Look at Declared, Resolved, and Active Cases, Includes M/L China
End of day figures follow:

That percentage in the right column there, has slipped a bit, but yesterday
it rebounded a bit. Nice...
Fatalities, Recoveries, Resolved, Active, and Serious/Critical
Cases Globally, Including M/L China
Concept of adding in Active Cases and
Serious/Critical here, courtesy of amorphous

Not much to say here. Big numbers getting bigger!
Section: 05
the Mortality Report
Here is the data for four entities...
Here are the figures for the growing case totals for four entities.

Anyone paying attention is already aware of the issues surrounding these
numbers. I'm not going to touch base on them every day.
Here is the chart to go along with those figures.

Charts like this one only show growth. That's why I recently took the advice
of a FReeper and added in a new chart for the U. S. and Global outside China
regions.
Here are figures revealing the daily growth for those four entities.

We've had some very nice numbers over the last three days. Higher count
days are just ahead. Would love to see us remain under 1,000.
Here are two charts to go with the above data.


Fatalities are dropping off nicely here, but on the Global scene it seems
as if the numbers have rebounded up. Hope that changes soon.
Here, let's look at data for the U. S. broken out by itself.

Nice...

It's pretty easy to spot the weekly cycles isn't it..
Section: 06
Population Saturation
Here are figures revealing how many people in each population base represent one
case. I'm also showing what percent of each population base is infected at this
time.

Our numbers have moderated in these demographics. Hope that continues.
Nations With Lots of Cases
At the end of the day yesterday, there were:

It's hard to belive there are that many nations with massive numbers.
Daily Case Report Evaluation
I'll be keeping tabs on the daily tallies for days of the week for a while. Folks have
noticed some patterns of larger and smaller data entry on certain days, and on Fridays
sometimes the numbers get noticeably larger because of it.
And we now know Thursdays have potential to break out also. Yikes!
IMO Let's check out the numbers and a chart.


Way too much activity lately...
Section: 07
The Top 200 Counties in the U. S., by Number of Cases
This little report lists 200 Counties in the United States in declining Case numbers.
There is also a listing that is alphabetical. This report list only the entities
and the number of Cases in the two different sorts.
It will also be available as a downloadable Excel file in Section 12.

Section: 08
States of the Union and the District of Columbia, Compared to Each Other
Each of these pages is sorted differently. Look at the red header above
the columns to see which column was used for the sort on any given page.

For your review...

For your review...

For your review...

For your review...

For your review...

For your review...

For your review...

For your review...

For your review...
If this area interests you, please use this LINK to the source, and review
the lengthy description and explanation of it's development process.
There are two reports. The presentation above comes from the second one,
and the detailed segmented information below it, may interest you.

These can now also be found under the states on the Alphabetical list. The
states and these entity's numbers should be combined to match that of the
U. S. figures each day.
Section: 09
The United States, Where it Ranks With Other Nations?
Each of these pages is sorted differently. Look at the red header above
the columns to see which column was used for the sort on any given page.
The U. S. will be highlighted red here so we can find it easily in the list.
There was 215 nations on this list last night now. I didn't want to post
seven lists with 215 nations on it, so I picked the top 50. Coincidentally,
one report category had the U. S. at 41st, so it wasn't showing up on the
list with the 31 top nations on it. That wasn't the reason why I extended the
list length, but it did work out well.
I work on the nations right next to the states on my spreadsheet. The
states with the District of Columbia come in at a total of 51 lines.
I decided to keep the international reports near that length, and 50
was good enough.
Here we go... for your review.

For your review...

For your review...

For your review...

For your review...

For your review...

For your review...

We remained at 30th place here...
Section: 10
Here is what it is all about. From January 20th to the present.

This concludes our look back at yesterday's data. Take care...

Section: 11
Data for this Report Sourced From:
LINK WorldoMeters
LINK Johns Hopkins University
The Center for Systems Science and Engineering (CSSE)
LINK United States Center for Disease Control - Provisional Numbers
Listed in the order of current utilization...
LINK You are Invited to Review My COVID-19 Spreadsheet (XLSX)
There is not an XLS version available for distribution at this time.
Section: 12
Other Features:
LINK US Counties200, States & DC51, Territories & Other Entities11, Nations214,
and the CDC Provisional Counts53
Five Excel Spreadsheet datasets you can sort for your own studies...
Section: 13
Links to other resources:
I cannot vouch for these sites. Please use your own judgement.
LINK Adventist Health Coronavirus Resource Hub - Scroll down for useful info
LINK Antibiotic Vitamin, the (Vitamin D)
Good article on Vitamin D's likely role in prevention of infection. Thanks Blam.
LINK CDC Data for Download - Scroll down - Excel required. Includes death stats.
LINK CDC National Center for Health Services
Provisional deaths as determined by review of vital documents. Much lower...
LINK CDC Secondary Data and Statistics - Portal Entry / Look around
LINK Coronavirus (COVID-19) Map
LINK Coronavirus infection risk may be reduced by Vitamin D
by Former CDC Chief Dr. Tom Frieden
LINK Coronavirus Spread Quickly Around the World in Late 2019, Study Shows
the University College London Genetics Institute
LINK COVID-19 Deaths Broken Out by Thirds, 05/07/20 Map of US Counties
Very revealing display of Concentrated Death Zones - thanks hoosiermama
LINK COVID-19 First U.S. Case, Treatment, features Remdesivir
New England Journal of Medicine article
LINK Cytokine Storm, med Actemra, Physician near death saved
LINK Diamond Princess Review at 634 Case Point of Eventual 712
LINK Hydroxychloroquine Article: International Poll
Daily Mail Reports, Most Effective Treatment According to 6,000 Physicians
LINK Hydroxychloroquine Has about 90 Percent Chance of Helping COVID-19 Patients
the Association of American Physicians and Surgeons, reports 91.6% of patients improved clinically
LINK IHME - Institute for Health Matrix and Evaluation
LINK National Institutes of Health - Cornavirus (COVID-19)
LINK Nasal Irrigation is the Key, COVID-19 Related
LINK New York City - interesting breakdown, borough, age, sex
LINK On the Origin of CCP Virus, A Documentary Movie (turn up the sound)
Epoch Times: I highly recommend this very well documented report.
LINK Rt COVID-19
Calculates and displays the Rt Factor for each state. Thanks FreedomPoster.
LINK World Health Organization

Nobody with more than two brain cells believes in the Coronavirus hoax anymore.
Covid isn’t even Covid many times.
With a two week lifespan (for lack of a better word) for the virus, that means the active cases should start plummeting like a rock soon.
Florida provides a lot of data.
http://ww11.doh.state.fl.us/comm/_partners/action/report_archive/state/state_reports_latest.pdf
Here are some numbers indicating there has been no discernible increase in cases since we began opening up Florida on May 1.
What has increased significantly is the number of testings.
During the week May 26 thru Jun 1 there were 5,300 new cases that week and 163,000 tests that week. Or in percent terms 3.25% of those tested were new cases.
During the week Jun 2 thru Jun 8 there were 8,300 new case that week and 258,000 tests that week. Or in percent terms 3.22% of those tested were new cases.
Another interesting statistic from Florida is the number of hospitalizations.
Thus far, Florida has had 64,448 cases and 11,185 hospitalizations or 17.3%.
Thanks for the mention of those things.
It was interesting.
I can’t capture everything, and it’s good when other add to
my nightly reports.
US Case Index: 0.93
US Fatality Index: 0.96
US June 9 Deaths: 1,093
US Total Deaths: 114,148
Brazil Case Index: 4.20
Brazil Fatality Index: 3.08
Brazil June 9 Deaths: 1,185
Brazil Total Deaths: 38,497
For some time, I've wondered how hard CV was going to hit those living in third world countries, including other world countries. So far, Brazil has been about the hardest hit. Even so, their current fatality index (3.08) is about where the US was around 1 May. At that time, the US had already had over 65,000 deaths. With about 2/3rds the population of the US, Brazilian fatalities are roughly half the US number at this particular point.
June 9:
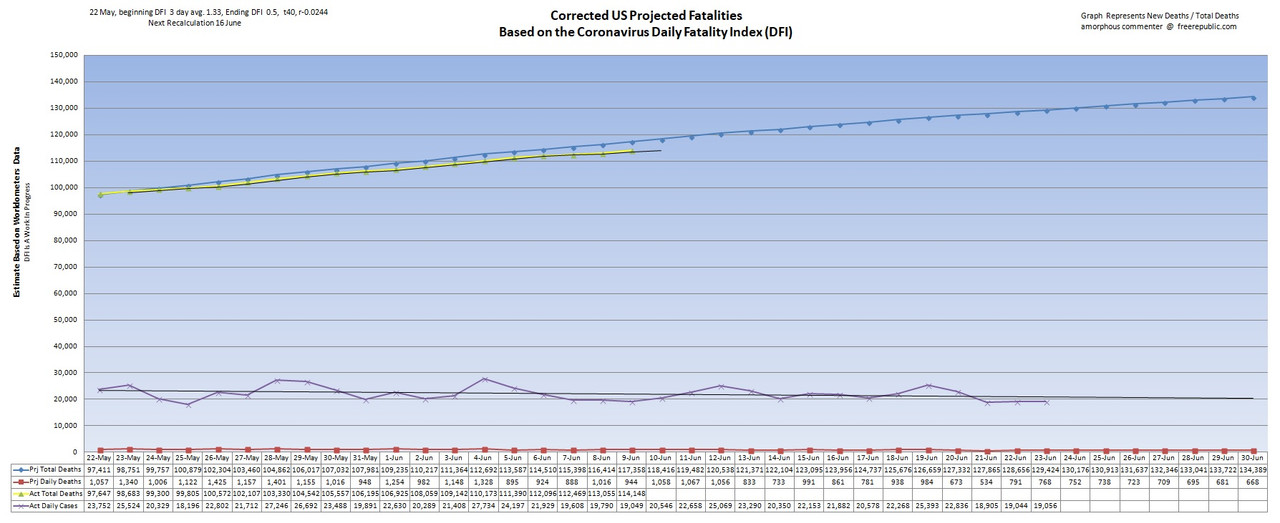
•Blue line represents projected death totals.
•Yellow line is actual death totals based on WorldofMeters.info data.
•Purple line is actual case numbers offset by 14 days.
•Red line represents projected daily deaths.
•Black extension lines are trend lines.
thanks to DO for crunching the numbers.
Amorphous — it looks like Brazil will overtake the USA. Bad, bad government policies in Brazil.
It would be interesting to see a breakdown by state in Brazil - I wonder how well the earlier theory I (and many others) had that heat would be a stumbling block for the virus, I wonder how true that is now with this additional data from Brazil
My thinking is Brazil may come in lower than the US in total numbers. My reasoning is two thirds of our population, plus they have the opportunity to implement lessons we’ve learned in fighting the virus. Also, Brazil is seeing quite a few lesser fatalities at their current timeline in the virus progress than the US, at the time. JMHO.
Disclaimer: Opinions posted on Free Republic are those of the individual posters and do not necessarily represent the opinion of Free Republic or its management. All materials posted herein are protected by copyright law and the exemption for fair use of copyrighted works.