The unvaxxed tend to be young and the young rarely die from Covid. They may as well have said “old people die more then young people”
It seems the young healthy vaxed people are more likely to die of heart issues.
I am very worried about one of my sisters kids who runs so fast he could be an olympic contender, but he had faith the govt and pharma was there to help him. We have encouraged him not to run so much
Vaccinated people are now more likely to be hospitalized or die from Covid, even after adjusting for fact they're older than the unvaccinated
“The unvaxxed tend to be young”
I don’t know if that’s true, without a source.
The young tend to be brainwashed liberals, those that would believe that they need 18 boosters.
Manitoba, which has about 1.4 million residents, also provides figures that are adjusted for the fact that vaccinated and boosted people tend to be older.
The figures are age adjusted.
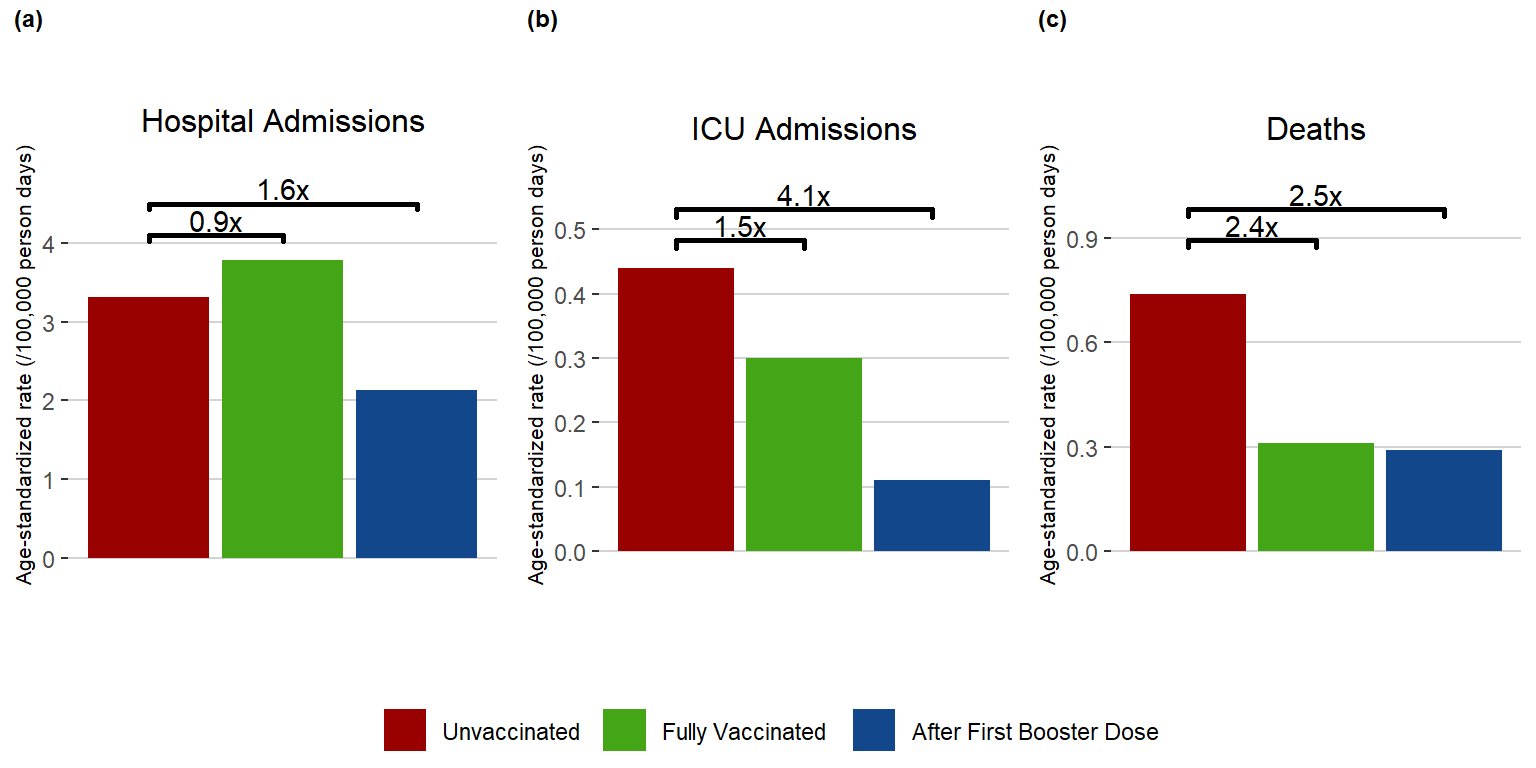
According to the bar graphs Harrison grabbed from the Manitoba site, severe outcomes were lowest for the boosted and highest for the fully vaccinated in: Figure 6. Age-Standardized Rate (/100,000 person days) and Risk of Severe Outcomes Associated with COVID-19 Manitoba, May 1, 2022 – May 31, 2022
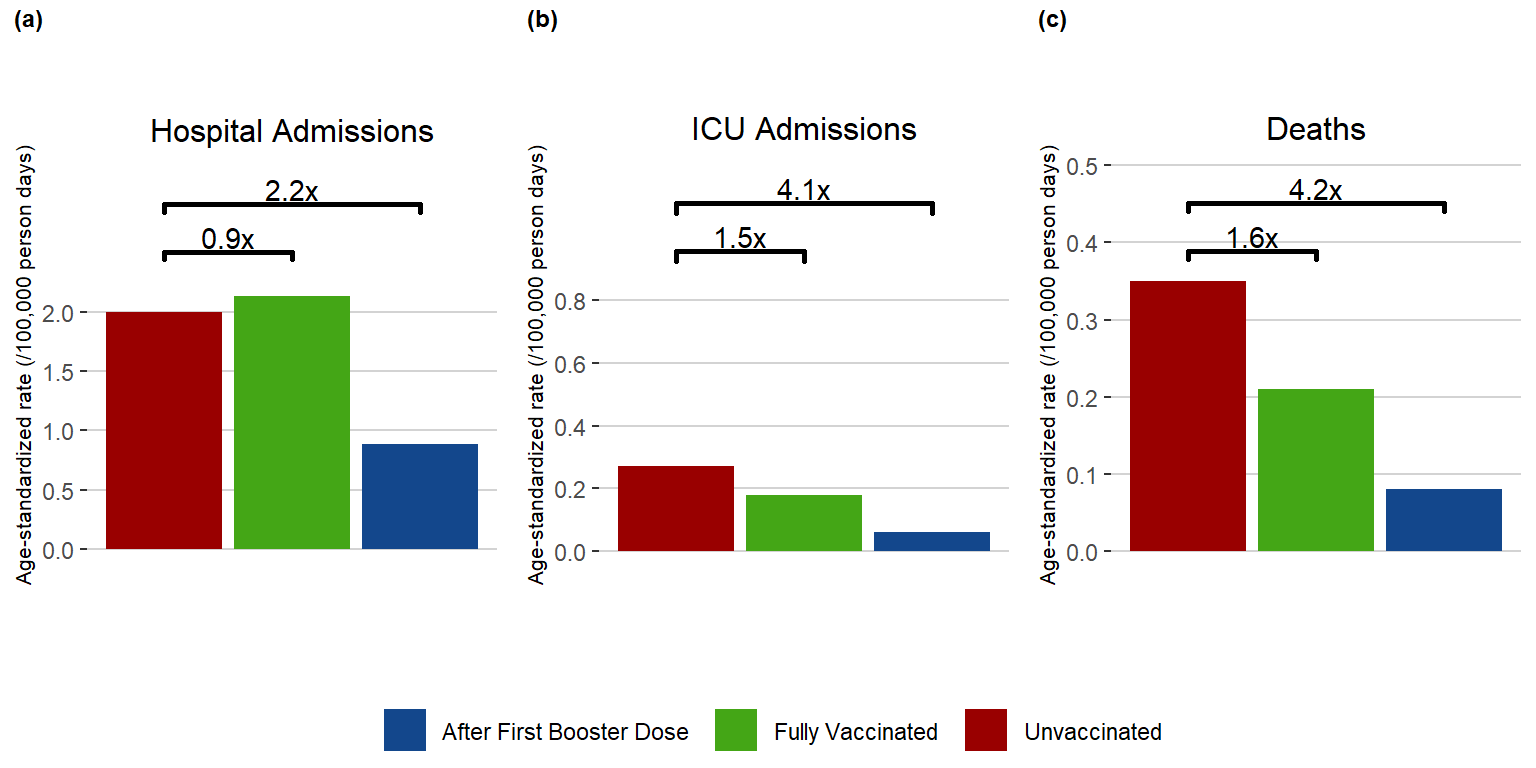
But if you look at the previous month, April 1, 2022 – April 30, 2022, ICU admissions are much higher in the unvaccinated and lowest in the boosted, and the death rate for the unvaccinated is way higher, lowest again in the boosted:
Web page:
https://www.gov.mb.ca/health/publichealth/surveillance/covid-19/2022/week_26/index.html
Similar in the month before that, March 1, 2022 – March 31, 2022, when hospital admissions were slightly higher for the fully vaccinated vs unvaccinated and much lower in the boosted; ICU admissions were higher for the unvaccinated and lowest in the bloosted,; death rate for unvaccinated highest by far, lowest for the boosted:
Web page:
https://www.gov.mb.ca/health/publichealth/surveillance/covid-19/2022/week_20/index.html
So why is May different from the previous months? Given how small are the numbers of hospitalizations, ICU admissions and deaths, it could easily be just a statistical hiccup. We can’t check it, as the numbers given for hospitilazation, ICU admission and death by age group are cumulative, beginning December 16, 2020. The page does not show the actual numbers by month to compare to the graph.
The total population of Manitoba is only 1,342,000. So, when you’re looking at a death rate risk of about 0.15 per 100,000 for the unvaccinated and boosted in May, that’s only 2 deaths in each group in all of Manitoba. And then there’s the death rate risk for the fully vaccinated of about 0.24 per 100,000, or 3.2 deaths. Add in the age standardization formula used on top of the low raw numbers, and, really how statistically relevant are any of these graphs? The confidence level must be pathetic.
Trust Berenson to choose this oddball graph as “proof” of his pet theory. smh
The study adjusted for that. Needle kneelers just went right along after seeing so very many test positive and experience flu symptoms at the worst. They believed the lie that there were millions positive with no symptoms.
After decades in the lab every one will tell you, correlations with symptoms are evidence their test system is accurate. Pcr targets set by who?
And we were using single target positives, probably still are. That a not just no for pcr testing. Multiple targets are standard because pcr tests have a higher false positive rate.
Any solution the government, particularly global governments are pushing is suspect from the word go.
Kneel once and they will never allow you to rise again.