There are many resources under the fold (by clicking "there's more" in this post), including details of the latest oil/infra damage estimates from Chuck Watson at KAC/UCF as well as lot of other resources including rig maps, models, google earth maps, and a lot more in the comments. Please help us find things that help convey the energy situation and problems created by this storm. Client-type readers should click on Chuck Watson's links - his long range Katrina forecasts were spot on and he has helped us -a website of volunteers - by volunteering a great deal of time and expertise.
UPDATE! 21:46 EST From Chuck Watson with respect to the LOOP:
Extensive damage and an extended recovery time probably measured in months. The pipelines to shore are probably in a lot of trouble on this trajectory due to scour.
Comment from Matthew Simmons 23:43 8/30:
LOOP is the only facility in the Gulf to unload VLCC tankers which carry over 2 million barrels of crude. They can in theory be "litered" by unloading onto smaller tankers that can make it into the Gulf Coast ports but this is very lenghty timing and the spare capacity of these smaller tankers is slim. We get about 1.2 million b/d of crude imports through Loop. (+/- 10%)UPDATE: 21:00 EST - Graphic below - shut-in production estimates below fold
Sneak preview of the 11pm runs. This is from LBAR, which has been almost as good as GFDL on track (at 48 hrs, 156mi vs 136mi), and updates much faster.
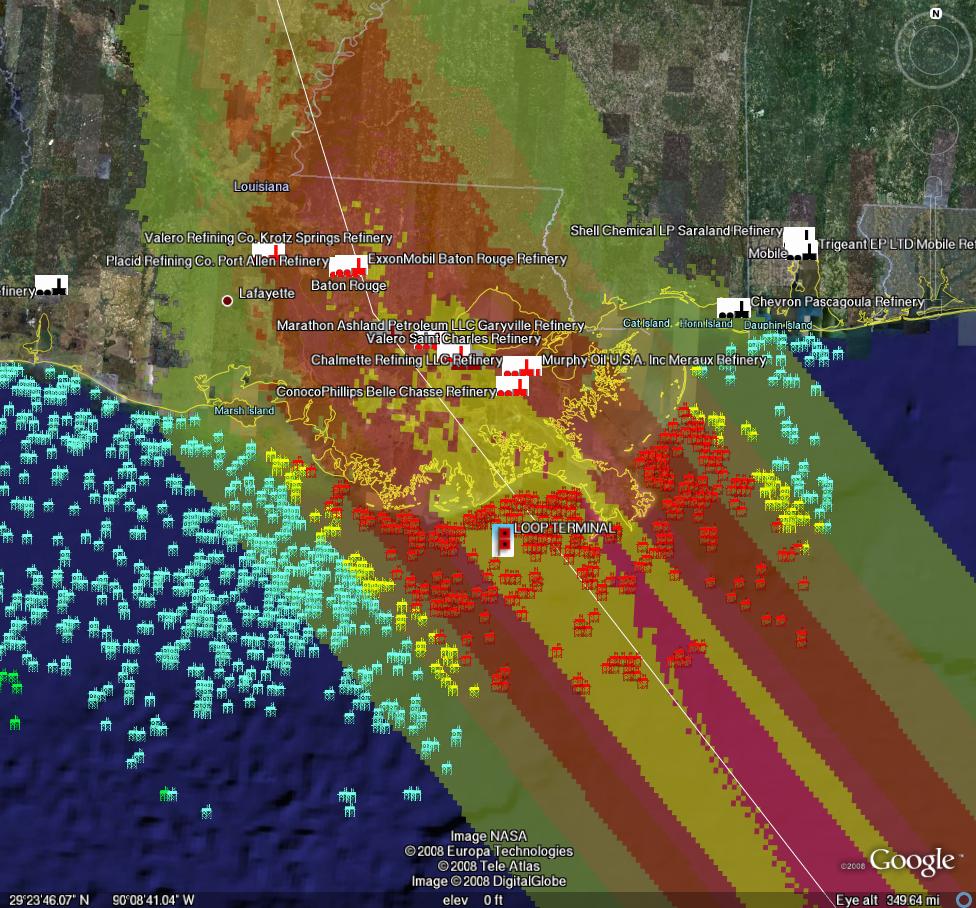
Damage estimates using LBAR 48 hour run 9pm EST-click twice to enlarge
For all graphics: Rigs/Platforms: Blue: evacuated only; Yellow will require inspection before restart; Red: damage requiring repair.
Refineries: Black: operational impact (partial shutdown) Green: Operational impact (full shutdown)
Red: Damage likelyPorts: standard hurricane flags for wind
We hope those in the path of this behemoth will get out of the way, prepare, and do everything they can to preserve human life. Let's hope this is all a waste of time and that this is not the human tragedy that it looks to be.
Click map to go to WUnderground
UPDATED: 20:53 EST 8/30
Since the major models are converging on New Orleans, I asked Chuck Watson if his expertise extended to the impacts on the navigation, etc. of the Mississipi River, our nations most important port. His response:Biggest problem for navigation in the lower river, as I understand it, is debris - trees, boats, houses, superdome parts, etc. If this thing stalls and upriver levees start to bust, then you get silt and more debris. LBAR track (one of the fairly good "quick" models) is now tracking "worst case" for NOLA. We're showing $80 Billion plus on-shore damage on that track just in lower LA.
I'm still skeptical this thing will maintain Cat4 all the way to landfall. Makes sense to plan for it, but the dynamics just don't feel right. More nervous about it than this morning, but still think it's less than 1 in 3 for Armageddon (which is bad enough).
Chuck Watson has created a table for us, showing expected production (vs original) for 14 day, 30 day, 60, 90 day, 6M, and 12M (updated 20:53 EST 8/30)
Early 00z (8pm ET) runs have shifted towards NOLA again. Will be
interesting to see if the big global runs like GFDL and HWRF shift as well.
Forecast GOM Production Estimates based on various track models (updated 21:00 est)
Official Forecast TrackOFCL ATCF Forecast Time: 2008083018 14 day: 6.99 MMBBL ( 43.42% normal), gas 51.21 BCF ( 57.15% normal) 30 day: 19.89 MMBBL ( 57.65% normal), gas 137.55 BCF ( 71.64% normal) 60 day: 44.88 MMBBL ( 65.04% normal), gas 306.38 BCF ( 79.79% normal) 90 day: 70.56 MMBBL ( 68.17% normal), gas 485.33 BCF ( 84.26% normal) 6 mon : 152.45 MMBBL ( 73.65% normal), gas 1040.40 BCF ( 90.31% normal) 1 year: 341.75 MMBBL ( 81.42% normal), gas 2279.55 BCF ( 97.58% normal)
Best Objective Track
BOTR ATCF Forecast Time: 2008083012
14 day:    6.44 MMBBL ( 40.00% normal), gas   48.65 BCF ( 54.29% normal)
30 day:   17.96 MMBBL ( 52.06% normal), gas  127.77 BCF ( 66.55% normal)
60 day:   45.40 MMBBL ( 65.80% normal), gas  290.50 BCF ( 75.65% normal)
90 day:   74.66 MMBBL ( 72.14% normal), gas  461.18 BCF ( 80.07% normal)
6 mon :  166.36 MMBBL ( 80.37% normal), gas 1013.94 BCF ( 88.02% normal)
1 year:  370.11 MMBBL ( 88.17% normal), gas 2275.52 BCF ( 97.41% normal)
Alternate Scenario 1 Track
LBAR ATCF Forecast Time: 2008083100
14 day:    6.50 MMBBL ( 40.37% normal), gas   52.09 BCF ( 58.14% normal)
30 day:   16.97 MMBBL ( 49.19% normal), gas  132.66 BCF ( 69.10% normal)
60 day:   38.89 MMBBL ( 56.36% normal), gas  292.30 BCF ( 76.12% normal)
90 day:   61.88 MMBBL ( 59.79% normal), gas  454.79 BCF ( 78.96% normal)
6 mon :  145.78 MMBBL ( 70.43% normal), gas  974.89 BCF ( 84.63% normal)
1 year:  358.24 MMBBL ( 85.35% normal), gas 2149.43 BCF ( 92.01% normal)
17:15 EST 8/30 Current track has LOOP out for extended period of time as well as some extensive refinery shutdowns.
Chuck comments:
The current tracks, both official and objective, are showing serious damage to the LOOP terminal as well as Southwest Pass. About a dozen refineries, including the big Baton Rouge Refinery (~500,000BPD), are showing at least week-long shutdowns and various levels of damage. Long term power and pipeline disruption is forecast in the target area, with extended rain (due to the storm stalling inland) making repairs difficult. It's not a good forecast - in some ways, worse than Katrina.
However, one thing folks should keep in mind: right now the major track models are abnormally closely clustered in space if not in time. That (obviously!) means that they are either all right or all wrong. I've done this long enough to suspect the former . . .
Chuck Watson update 17:00 EST 8/30: The tables show the expected and forecast cumulative production from the GOM at the end of each period. So according to the runs based on the Official NHC forecast, at the end of 90 days the GOM would have produced only 70 MMBBL as opposed to the normal 103 MMBBL, a 30% cumulative shut in.
Little wobbles matter a lot. It's important to realize just how sensitive losses are to the exact track and geometry of the storm. As you're probably aware, a few leases are responsible for the majority of production (I should do a map of that some time). The critical damage width, even for a strong storm, is really quite small - 30 miles wide or so. So a 10 mile wobble or a 20 degree change of approach can make a huge difference in impacts. The expected shear means greater asymmetry in the storm, which also changes the geometry. As I've said all along, the numbers tend to be all over the place until we get to about 2-3 days out.
Chuck has put together a dynamically updating page that will reflect the latest damage models/forecasts at this link: KAC/UCF models.
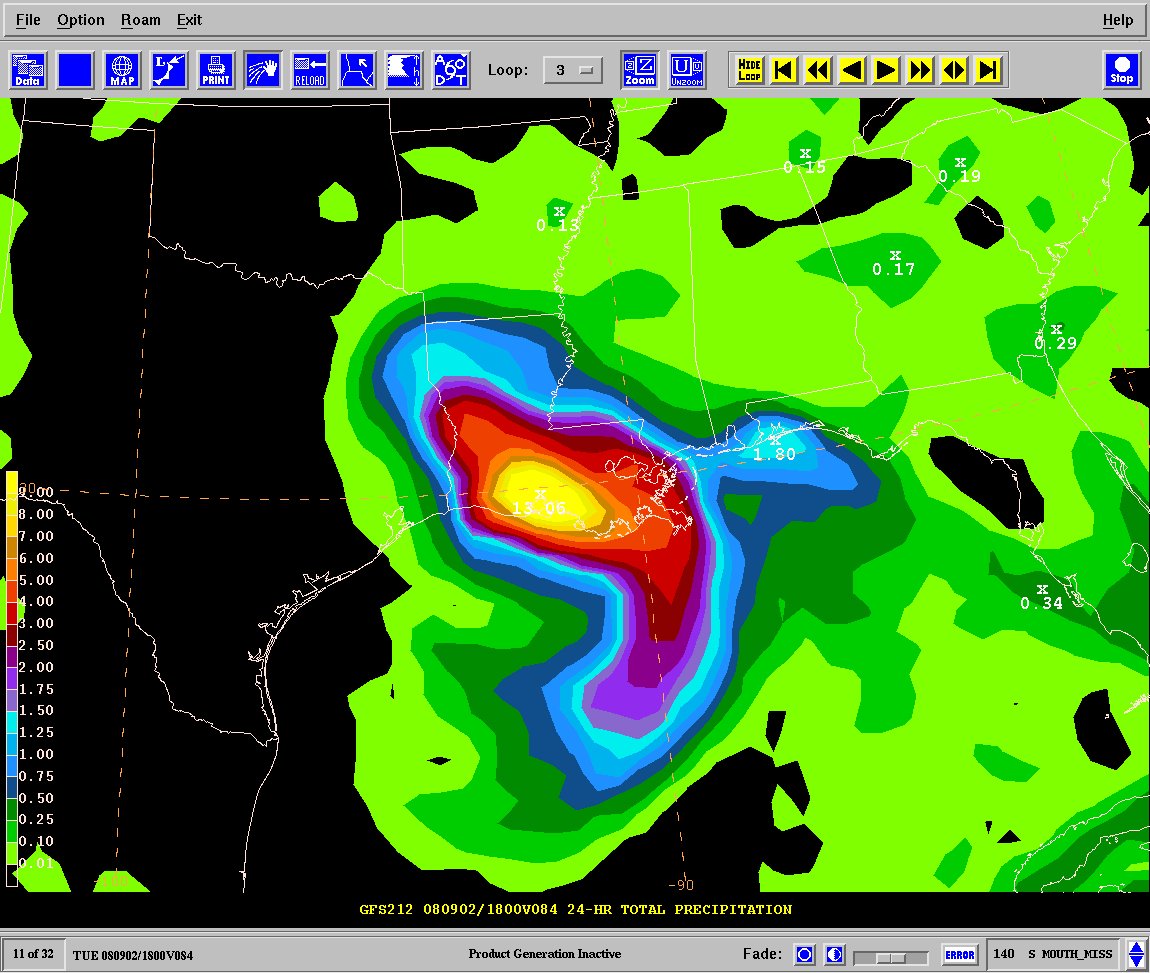
Rain estimates using GFS forecast
Rain forecast from GFS - over 1 foot of rain immediately post storm, another 10" on day 2, 8" day 3. Wow.
UPDATED
PRODUCTION/INFRASTRUCTURE MAPS AND REFINERY INFORMATION
Here's a link to a really good map of oil refining/SPR storage facilities in respect to the path of Katrina (NB: OLD TRACK MAP!) and here is a listing of production and refining capability for the state of LA.
Just to give you a rough idea of where things are, the map above is a probability swath for Katrina (OLD TRACK MAP!) with the Thunder Horse platform as the red dot, and the other purple dot represents the Mad Dog development (100,000 bd); the Holstein development that produces at peak, around 100,000 bd of oil; and the Atlantis field that may have ramped up to around 200,000 bd in all. Put together these projects have the potential of around 650,000 bd, but as can be seen, they were sitting in an uncomfortable spot relative to the track of the Katrina.The white dot is where Port Fourchon is. This is where the Louisiana Offshore Oil Port, or LOOP, is located. Rigzone pointed out that this is where the foreign tankers offload, Google and Terraserve maps you can see that the area is very low-lying. One of the big concerns is that there will be sub-sea landslides or other ground movement that might affect the LOOP. Were this to be disrupted, then foreign tankers would need to be diverted elsewhere, with the likely port being Houston.
We have accumulated resources from previous hurricans below, but we'd like to find updated materials if you know of them. Recent refinery maps, recent rig maps in the gulf, recent gas fields, SPR facilities, the Intercoastal Canal, pipeline stations and transfer points, etc., etc. Leave links in the comments please.
Also, here's the EIA's Alabama, Louisiana, Mississippi, and Texas Resources pages. They will also likely come in handy. Also, here's a link to the national page.
Here's another good resource for infrastructure maps and such. (scroll down a bit)
Here's a map from CNN with large and small refineries laid out. (though it is an old storm track)
Very detailed piece by RIGZONE on rigs and other infrastructure in the area. (thanks mw)
Here's a flash graphic of the oil refineries and rig maps from Hurricane Rita, it emphasizes Beaumont and Galveston's importance. Click on oil production in the tab. Note the many rigs on the east side of the storm that will get the brunt of the damage from the NE quad of the storm...hence the high long-term GOMEX oil production damage estimates below.
Here's a link to Rigzone's coverage of Gustav.
You want a detailed map? Well here's the probably the best MMS map I could find. Very detailed and lots of interesting stuff. (VERY big .pdf warning)
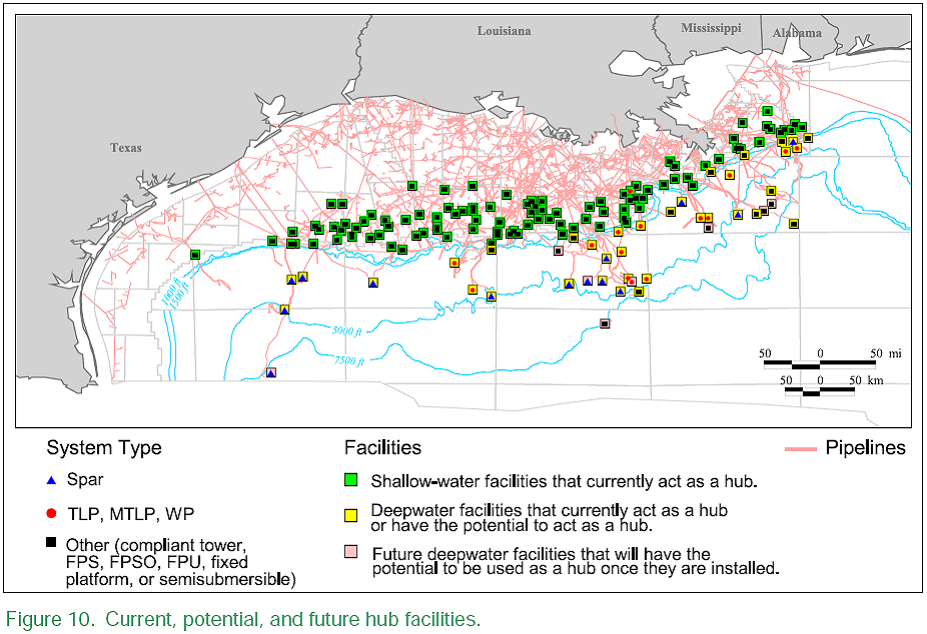
Also, Scott Wilmoth at Simmons & Co was kind enough to send us this map. The map below captures only deepwater infrastructure. For a complete list of deepwater development systems (includes operator, depth, location): http://www.gomr.mms.gov/homepg/offshore/deepwatr/dpstruct.html