
Posted on 07/10/2014 1:30:40 PM PDT by Ernest_at_the_Beach
Readers may recall the contentious discussions that occurred on this thread a couple of weeks back. Both Willis Eschenbach and Dr. Leif Svalgaard were quite combative over the fact that the model data had not been released. But that aside, there is good news.
David Archibald writes in to tell us that the model has been released and that we can examine it. Links to the details follow.
While this is a very welcome update, from my viewpoint the timing of this could not be worse, given that a number of people including myself are in the middle of the ICCC9 conference in Las Vegas.
I have not looked at this model, but I’m passing it along for readers to examine themselves. Perhaps I and others will be able to get to it in a few days, but for now I’m passing it along without comment.
Archibald writes:
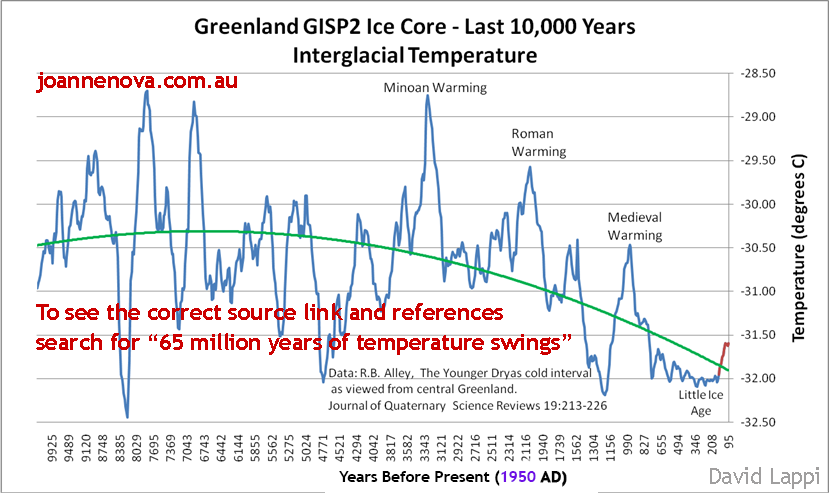
There is plenty to chew on. Being able to forecast turns in climate a decade in advance will have great commercial utility. To reiterate, the model is predicting a large drop in temperature from right about now:
David Evans has made his climate model available for download here.
The home for all things pertaining to the model is: http://sciencespeak.com/climate-nd-solar.html
UPDATE2:
For fairness and to promote a fuller understanding, here are some replies from Joanne Nova
fyi
Archibald makes an Ap Index prediction
As many readers know, I follow the Average Magnetic Planetary Index (Ap) fairly closely as it is a proxy indicator of the magnetic activity of our sun. Here is the latest Ap Graph:
I’ve pointed out several times the incident of the abrupt and sustained lowering of the Ap Index which occurred in October 2005.

click for a larger image
David Archibald thinks it may not yet have hit bottom. Here is his most recent take on it.

click for larger image
The low in the Ap Index has come up to a year after the month of solar cycle minimum, as shown in the graph above of 37 month windows of the Ap Index aligned on the month of solar minimum. For the Solar Cycle 23 to 24 transition, the month of minimum is assumed to be Ocotber 2008. The minimum of the Ap Index can be a year later than the month of solar cycle minimum, and the period of weakness can last eighteen months after solar cycle minimum.
The graph also shows how weak this minimum is relative to all the minima since the Ap Index started being measured in 1932. For the last year, the Ap Index has been plotting along parallel to the Solar Cycles 16 – 17 minimum, but about four points weaker. Assuming that it has a character similar to the 16 – 17 minimum, then the month of minimum for the Ap Index is likely to be October 2009 with a value of 3.
The shape of the Ap Index minima is similar to, but inverted, the peaks in neutron flux, which are usually one year after the month of solar minimum.
David Archibald
January 2009

Searching the comments of the Archibald thread from 2009 ,,,,found this...
**********************************EXCERPTR*********************************
E.M.Smith says:
Is the ap index still dropping like this ‘a bad thing’, a ‘really bad thing’ or a ‘gee, intersting…’ thing? Just eyeballing the graph and with the statement that it’s a proxy for solar output, I feel like buying some longjohns…
Then there is this head scratcher:
Well I’ll be. James Lovelock, the greens green and creator of Gaia mythology, agrees that carbon trading is a waste of time! I’ve softened a couple of his words a bit (my edits are in [square brackets] in the quote) to save the moderator a ‘snip’…
From:
http://www.newscientist.com/article/mg20126921.500-one-last-chance-to-save-mankind.html
Not a hope in [heck]. Most of the “green” stuff is verging on a gigantic scam. Carbon trading, with its huge government subsidies, is just what finance and industry wanted. It’s not going to do a [darn] thing about climate change, but it’ll make a lot of money for a lot of people and postpone the moment of reckoning. I am not against renewable energy, but to spoil all the decent countryside in the UK with wind farms is driving me mad. It’s absolutely unnecessary, and it takes 2500 square kilometres to produce a gigawatt – that’s an awful lot of countryside.
NOAA & GISS:
And finally, I’ve done a first pass through the NOAA data and the GISS code. I’m still figuring out what it all means (table of variables with description? You’ve got to be dreaming. Comments? OK, how about one cryptic one per program?) At this point though, my ‘first blush’ is that NOAA has the false precision problem. They hand over ‘monthly mean’ data in 1/100 degree C precision. I don’t see how that is even remotely possible.
It also looks (per the terse readme) like GISS uses the UHI unadjusted NOAA data set rather than the adjusted one (though it is a manual download – easy ftp! – so anyone could use any dataset at the time of running the code. In the ‘readme’ the GHCN and HCN station description files have the .Z ending confounded. The readme for one said to use it (when it was missing) the other said not (when it was there). Hope this isn’t a trend.
Finally, it looks like all GISS does is glue together the HCN, GHCN, and antarctic data (plus some small bits) with some removal of dups and ‘preening’ then does the magic UHI homogenization dance, and some final formatting/cleaning. So that would lead me to believe that a simple cross check dataset can be made by taking the NOAA UHI adjusted data directly and doing station to station comparison graphs.
From the GISS Readme:
GISS Temperature Analysis
=========================
Sources
——-
GHCN = Global Historical Climate Network (NOAA)
USHCN = US Historical Climate Network (NOAA)
SCAR = Scientific Committee on Arctic Research
Basic data set: GHCN – ftp://ftp.ncdc.noaa.gov/pub/data/ghcn/v2
v2.mean.Z (data file)
v2.temperature.inv.Z (station information file)
For US: USHCN – ftp://ftp.ncdc.noaa.gov/pub/data/ushcn
hcn_doe_mean_data.Z
station_inventory
For Antarctica: SCAR – http://www.antarctica.ac.uk/met/READER/surface/stationpt.html
so a simple ftp window on the data location, in your browser, and you can get the UHI adjusted data (though the fahr implies F) and compare to GISS to see what he’s doing. Or just use the same dataset, he uses, not UHI adjusted by anyone…
From the HCN Readme:
urban_max_fahr.Z Urban Heat Adjusted Maximum Monthly Temperature
urban_calc_mean_fahr.Z Urban Heat Adjusted Mean Monthly Temperature
(Calculated from urban.max.Z and urban.min.Z) urban_mean_fahr.Z Urban Heat Adjusted Mean Monthly Temperature
urban_min_fahr.Z Urban Heat Adjusted Minimum Monthly Temperature
For some unknown reason, GISS break the processing down into steps 0,1,2,3,4-5. The start and end are FORTRAN, but step 1 is python (with some C bits to compile and install on your machine). Go figure… The good news is that the PApars.f chunk in Step2 that does the pasteurizing process is the one bit of code that does have decent comments in it.
The code is not particularly complex. It has oodles of undocumented variables and many scratch files, especially between steps, so decoding it will take a bit of work. My estimate is that the code could be shrunk by about 60% with no loss of function.
The Grapj at post #3 is of the Archibald AP Index....
***************************************EXCERPT******************************************
lenbilen says:
Thanks for the heads up. I have noticed the same thing and collected them in “Eleven signs of cooling. A new little Ice Age coming?” This twelfth sign seems to be the strongest of them all.
http://lenbilen.com/2014/07/01/eleven-signs-of-cooling-a-new-little-ice-age-coming/
**************************************EXCERPT***************************
LogosWrench says:
If true there will not be embarrassed people in the climate left wing establishment. They will change the narrative and say they predicted “change” all along and that mankind is still responsible and with warming we should expect cooler than normal temperatures. Have you learned nothing from the “polar vortex”? In other words those seeking absolute power will say and do absolutely anything to get it.
Accuracy and precision are foreign concepts to climate scientists.
If weather stations are only reporting whole degrees, then any average will only be accurate to whole degrees.
Disclaimer: Opinions posted on Free Republic are those of the individual posters and do not necessarily represent the opinion of Free Republic or its management. All materials posted herein are protected by copyright law and the exemption for fair use of copyrighted works.