Summary, Links to where to get a pdf copy of his paper & to the data sets & methods he used.
Result looks like this:

Sombody's got some splain'n tah do.
Posted on 10/28/2003 7:10:41 PM PST by polemikos
Edited on 04/13/2004 1:41:19 AM PDT by Jim Robinson. [history]
An important new paper in the journal Energy & Environment upsets a key scientific claim about climate change. If it withstands scrutiny, the collective scientific understanding of recent global warming might need an overhaul.
A little background is needed to understand the importance of the new research behind this paper by Stephen McIntyre, a statistics expert who works in the mining industry, and Ross McKitrick, a professor of economics at the University of Guelph, Ontario. As scientists and governments have tried to understand mankind's influence on the environment, global warming has become a primary concern. Do mankind's activities
(Excerpt) Read more at usatoday.com ...
Summary, Links to where to get a pdf copy of his paper & to the data sets & methods he used.
Result looks like this:
Sombody's got some splain'n tah do.
Mann sure has made his way in the world.
Sorry that I can't provide a lengthy reply to the solar variation issues on "Rushing to Judgement"; there is still much more to be said, and I hope to say more starting tomorrow and into next week. You have raised new points that deserve analysis (to the extent that I am capable).
Regarding the results of McIntyre and McKitrick, there is some ongoing discussion of it on this blog that is both interesting, confusing, and disturbing:
Dr. Mann is indicating that McIntyre and McKitrick used an incorrectly compiled data set, which may well be true. McIntyre and McKitrick reply that Dr. Mann has not been particularly forthcoming in response to their requests, which may also be true. Mann indicates that other researchers have replicated his results independently, which also appears to be true. At this point about all that can be said is that the analysis of McIntyre and McKitrick, while perhaps a valid analysis, may not have been conducted on the proper data.
Which makes just about everybody involved look a bit messy.

The orange line is from a paper authored by Crowley and Lowery in Ambio in 2000. The red line is Mann et al.'s analysis, the one that is under the gun in the audit paper. The other lines are analyses are from this Web site:
The evolution of climate over the last millenium
One comment: if McIntyre and McKitrick really wanted to scare the h*ll out of the climate science community, they should have published their paper in a climate science journal, not Energy and Environment, which is making a specialty out of publishing papers written by the community of global warming skeptics. Now, the editorial slant of a journal is the right of its editors, but as long as Mann and his cohorts are publishing in Science, Nature, Journal of Climate, etc., and the skeptics are all publishing in one little "place", they won't get their case heard by the wider scientific community. It doesn't serve the cause to aim low in terms of publishing, if the aim is to influence the viewpoint of the scientific community. If the aim is to influence public opinion, then they can publish wherever they want and let the media run with the story.
At this point about all that can be said is that the analysis of McIntyre and McKitrick, while perhaps a valid analysis, may not have been conducted on the proper data.
Of interest is the data on which the analysis and audit was done was provided by Mann's people! The complaint that Mann appears to be responding to as not being the proper data, is the XL spreadsheet form, though the raw data was also sent to M&M in text form as well, and copy returned to Mann for verification.
http://www.uoguelph.ca/~rmckitri/research/trc.html
"The proxy data set we received from Mann (pcproxy.txt). The text version is just as received from Mann (and re-sent back to him to verify)."
From what I can determine from M&M's paper they made a initial run with the XL data and noticed large discrepensies, compared the XL spreadsheet data apparently with the orginal text dataset.
http://www.multi-science.co.uk/mcintyre_02.pdf
"This led to a systematic comparison of MBH98 data to original data, identifying obsolete versions and undisclosed truncation of time series. Independent calculations of the proxy principal components convinced us that those in MBH98 were erroneous we updated and corrected the database and then applied MBH98 methodology, as publicly disclosed,"
Mann's response as stated in Quark Soup:
"However, Mann said today, a transcription error was inadvertently made in preparation of the spreadsheet, in which some multiple data that should have appeared in multiple columns was mistakenly overwritten into some single columns. A dataset that should have contained 159 columns of data in fact only contained 112 columns. So when M&M slid this dataset into their calculations, the results that came out were naturally in error."
Something not Kosher here, the "spreadsheet" was apparently rebuilt by M&M using original data, and the analysis run on that "original data" is what provided M&M's final output, not the "spreadsheet" sent to them by Mann's office.
Which makes just about everybody involved look a bit messy.
As I noted, there needs to be some splain'n done by somebody.
If the aim is to influence public opinion, then they can publish wherever they want and let the media run with the story.
Actually it is public opinion that needs to be addressed. The UN/IPCC "Global Warming" folks placed this in the political arena making it everybodies football.
I have no probs with anyone presenting their papers where they can be published and put into the debate pot, unfortunately Nature etc. are known to take their own license in what they allow to publish and have their own axes to grind.
As provided by M&M, their approach of publishing in Energy and Environment is consistant with who they are. Neither are in the Climate community and they do not claim to be doing original research, merely auditing the data and methods of Mann to determine reproducibility of Mann's result using Mann's dataset. They have provided exposure of both their papers, data used, methodology to the world via the internet, anyone may compare Mann's methods, results & data against M&M's claims. That seems sufficient to me.
It will be interesting to see if the media pressure and the pressure from the skeptical community on him will be sufficient to get him to respond. He is definitely capable of responding; after the Soon, Baliunas (et al.) papers came out early this year, due to persistent inquiries from the press, he collaborated on a response that was in the American Geophysical Union Eos publication.
Mann makes a lot of stuff available on his personal home page; here's the Eos article (PDF). The first figure shows a bunch of climate reconstructions over the past 1000 years.
On Past Temperatures and Anomalous 20th-Century Warmth
A couple of years ago there was some attention paid to an analysis published by Esper et al. (to which Mann responded). Esper's data, which appears in the figure noted above, shows much deeper cold periods than Mann's data (Mann's data was multi-proxy temperature records; Esper's was only tree-ring data). Esper's data is spikier, and there are a couple of times when his temperature record is significantly higher (0.2-0.3 C) than Mann's. But the overall pattern is still the same. If Esper's data and analysis are truly independent of what Mann et al. have done (same goes for the Crowley and Lowery analysis), then the likelihood that McIntyre and McKitrick operated on an erroneous data set increases. But it certainly appears that most of the blame for them receiving a flawed data set falls squarely on Dr. Mann.
If he'd been smart, he would have made certain that they got the correct data, and if their analysis had not shown any errors, then nothing would have happened. Now Mann is in a mess of his own making. It will be interesting to see the way in which he responds now.
You may wish to comment on or at least review the more accurate version here, there was a significant change in result as a consequence of the correction:
http://www.freerepublic.com/focus/f-news/1002384/posts?page=105#105

igure 1. Comparison of proxy-based NH temperature reconstructions [Jones et al., 1998; Mann et al., 1999; Crowley and Lowery, 2000] with model simulations of NH mean temperature changes over the past millennium based on estimated radiative forcing histories [Crowley, 2000; Gerber et al., 2002--results shown for both a 1.5°C/2*CO2 and 2.5°C/2*CO2 sensitivity; Bauer et al., 2003). Also shown are two independent reconstructions of warm-season extratropical continental NH temperatures [Briffa et al., 2001; Esper et al., 2002] and an extension back through the past two thousand years based on eight long reconstructions [Mann and Jones, 2003]. All reconstructions have been scaled to the annual, full Northern Hemisphere mean, over an overlapping period (1856-1980), using the NH instrumental record [Jones et al., 1999] for comparison, and have been smoothed on time scales of >40 years to highlight the long-term variations. The smoothed instrumental record (1856-2000) is also shown. The gray/red shading indicates estimated two-standard error uncertainties in the Mann et al. [1999] and Mann and Jones [2003] reconstructions. Also shown are reconstructions of ground surface temperatures (GST) based on appropriately areally-averaged [Briffa and Osborn, 2002; Mann et al., 2003] continental borehole data [Huang et al., 2000], and hemispheric surface air temperature trends, determined by optimal regression [Mann et al., 2003] from the GST estimates. All series are shown with respect to the 1961-90 base period.
This is from
Ice Ages & Astronomical Causes
Brief Introduction to the History of Climate
by Richard A. Muller

This mistake is made over and over and over again, and it's one of the ways that the "hockey stick" critics have tried to assess his data. Regional temperature variability is always going to be greater than a merged data set, because the peaks in one region may be partially or completely canceled by troughs in another region.
However, note something: the location of the warm and cold periods still generally coincides with the other records. The only point of dispute regards the magnitude of the warmest peaks around 400 and 900-1000 AD compared to the end of the ice core record.
By the way, at what year exactly is the Vostok ice core temperature record considered to end?
"The second graph (Data 3) is for the past 200 years. This time period includes all of the Industrial Revolution which began in the mid-1800s. The start of the Industrial Revolution marked the beginning of the large-scale exploitation of fossil fuels. The small dip in temperature in the early 1800s was caused by volcanic eruptions which reduced the amount of sunlight reaching the Earth's surface. CO2 inflection points are visible at around 1860, 1950 and 1975. After 1958, the data are from annual air measurements, not ice core proxies, and are therefore of higher quality."

So if this is correct, then in your plot the temperature data only goes to 1958. In which case the temperature rise over the last 40 years, which would increase the endpoint of your graph by at least 0.25 C, isn't shown.
It's useful to look at Vostok data over 400,000+ years, because on that scale what happens in 500-1000 years is integrated by the climate system into the precipitation signal. But in the modern timeframe, the Antarctic is partially decoupled from processes happening in the rest of the world.
As a final aside, Mann's multi-proxy data record includes six ice-core records, but does not include the Vostok ice core data. I have no idea if Vostok was excluded because of what I said above, or for other reasons.
But in the modern timeframe, the Antarctic is partially decoupled from processes happening in the rest of the world.
LOL, that's one interpretation.
The other is global temperture dependance upon CO2 concentration is grossly overstated hence a perceived decoupling on the part of those wedded to a CO2->Global Warming dependancy.
- "(1) correlation does not prove causation,
(2) cause must precede effect, and
(3) when attempting to evaluate claims of causal relationships between different parameters, it is important to have as much data as possible in order to weed out spurious correlations.
***
Consider, for example, the study of Fischer et al. (1999), who examined trends of atmospheric CO2 and air temperature derived from Antarctic ice core data that extended back in time a quarter of a million years. Over this extended period, the three most dramatic warming events experienced on earth were those associated with the terminations of the last three ice ages; and for each of these climatic transitions, earth's air temperature rose well in advance of any increase in atmospheric CO2. In fact, the air's CO2 content did not begin to rise until 400 to 1,000 years after the planet began to warm. Such findings have been corroborated by Mudelsee (2001), who examined the leads/lags of atmospheric CO2 concentration and air temperature over an even longer time period, finding that variations in atmospheric CO2 concentration lagged behind variations in air temperature by 1,300 to 5,000 years over the past 420,000 years."[ see also: Indermuhle et al. (2000), Monnin et al. (2001), Yokoyama et al. (2000), Clark and Mix (2000) ]
- "Other studies periodically demonstrate a complete uncoupling of CO2 and temperature "
[see: Petit et al. (1999), Staufer et al. (1998), Cheddadi et al., (1998), Raymo et al., 1998, Pagani et al. (1999), Pearson and Palmer (1999), Pearson and Palmer, (2000) ]
- "Considered in their entirety, these several results present a truly chaotic picture with respect to any possible effect that variations in atmospheric CO2 concentration may have on global temperature. Clearly, atmospheric CO2 is not the all-important driver of global climate change the climate alarmists make it out to be."
Global warming and global dioxide emission and concentration:
a Granger causality analysis
- "We find, in opposition to previous studies, that there is no evidence of Granger causality from global carbon dioxide emission to global surface temperature. Further, we could not find robust empirical evidence for the causal nexus from global carbon dioxide concentration to global surface temperature."
By the way, at what year exactly is the Vostok ice core temperature record considered to end?
149 years prior to 2000, so the temperature chart provided above from Muller's site includes additional studies all using 1950 temp as the relative baseline. Muller also includes current measured temperatures up around '95 in his chart set to complete the record.(may need to hit leftclick->show picture to see the graphics)
But then we can always fill in the last 140 years with direct surface temperature deviations so VOSTOK is hardly required at that point they merely need to be adjusted to the relative 1950 base line he uses:
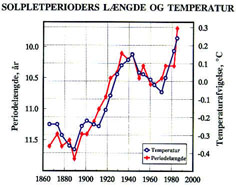 Graph of solar activity versus climate
From Friis-Christensen, E., and K. Lassen, "Length of the solar cycle: An indicator of solar activity closely associated with climate," Science, 254, 698-700, 1991.
And do you see why the graph you posted doesn't allow a direct comparison to the graph of several temperature reconstruction histories that I posted, because it doesn't show the warming since the mid-1800s (which is 0.6-0.8 C in the surface instrumental record)?
And have you read this?
On the length of the solar cycle and Earth's climate (PDF document)
I have to leave it at that for today, as I have to get out into the twilight early with three sugar-craving toddlers.
Let me know if you wish to be added or removed from this list.
I don't get offended if you want to be removed.
For real time political chat - Radio Free Republic chat room
What's the source of the temperature data in that graph?
The Friis-Christensen, E., and K. Lassen study uses average Northern Hemphisphere surface temperatures.
The webpage containing the graph is: http://web.dmi.dk/solar-terrestrial/space_weather/
it doesn't show the warming since the mid-1800s (which is 0.6-0.8 C in the surface instrumental record)?
You can always look at link I provided above to Muller's History of Climate introduction, which presents the full range of data he used right up to 1999 or thereabouts.
Beginning in the early 1900s, the climate of the world began to warm. This is evident in Figure 1-1, which shows the average Earth surface temperature from 1880 through 1999. The temperature is an area-weighted average over the land and ocean compiled by the National Oceanographic and Atmospheric Administration, using an averaging technique devised by Quayle et al. ; see also . In the plot, "zero" temperature is defined as the temperature in 1950. The fine line shows the monthly temperatures; the thicker line shows the 12 month yearly averages.

But in the modern timeframe, the Antarctic is partially decoupled from processes happening in the rest of the world.
Actually I was wrong on the 2400 year data set, I didn't look to verify and assumed Vostok Data, after checking Muller's introduction, the actual data set used was
Data from a kilometer long core taken from the Greenland glacier, as part of the Greenland Ice Sheet Project "GISP2" , are shown in Figure 1-2. For comparison purposes, the zero of temperature scale for this plot was set to match that of the previous plot. For historical interest, we marked some events from European history.
This makes the plot more interesting, because one of the reasons that Mann's data has been repeatedly criticized is that it eliminated the "Medieval Warm Period". If you look at the multi-record graph above, there is a warmer period roughly 900-1300 preceding the cooler period of about 1400-1800 (coldest around 1600-1750?). But because the data records are supposed to be global representations, the regional signals are reduced. The Medieval Warm Period was quite warm in Europe and the FennoScandian region, and some of this warmth may have transferred over to Greenland; thus, GISP2 has more pronounced warm periods in the "Medieval" range than the global records.
More next week.
Disclaimer: Opinions posted on Free Republic are those of the individual posters and do not necessarily represent the opinion of Free Republic or its management. All materials posted herein are protected by copyright law and the exemption for fair use of copyrighted works.