Section 1. Pre Storm Flooding in Jefferson Parish East (0345-1500 CDT)
Prior to Katrina's arrival near New Orleans, several reports of flooding were posted by various news agencies, notably in areas northeast, (Transcontinental Drive and Kawanee Avenue), and southwest (Duncan Canal and 1200 block of Williams Drive) of Kenner, Louisiana, a subsection of urban New Orleans just west of downtown, on the east bank of the Mississippi River.
0345 AM, Monday, August 29, 2005
"Some East Jefferson drainage canals were topping out as huge pumps struggled to suck rainfall out of neighborhoods and move it over the levee into Lake Pontchartrain.
Watching the progress of the storm from Jefferson Parish's emergency operations center in Marrero, Walter Maestri sounded an early note of optimism at 3:45 a.m., as Katrina jogged a bit off course. But he also cautioned that conditions could deteriorate as the day progresses.
"It looks like we've done fairly well," he said. "We have had no reports of serious wind damage, and we don't see any indication of tidal surge problems. "But of course it's still really early. The next four to five hours will tell the tale."
Some East Jefferson drainage canals were topping out as huge pumps struggled to suck rainfall out of neighborhoods and move it over the levee into Lake Pontchartrain.
Street flooding was reported in the vicinty of Transcontinental Drive and Kawanee Avenue, a frequent trouble spot about halfway between the Suburban and Elmwood canals, Maestri said. Rain was falling there at the rate of three inches per hour."
0345 CDT Report Source
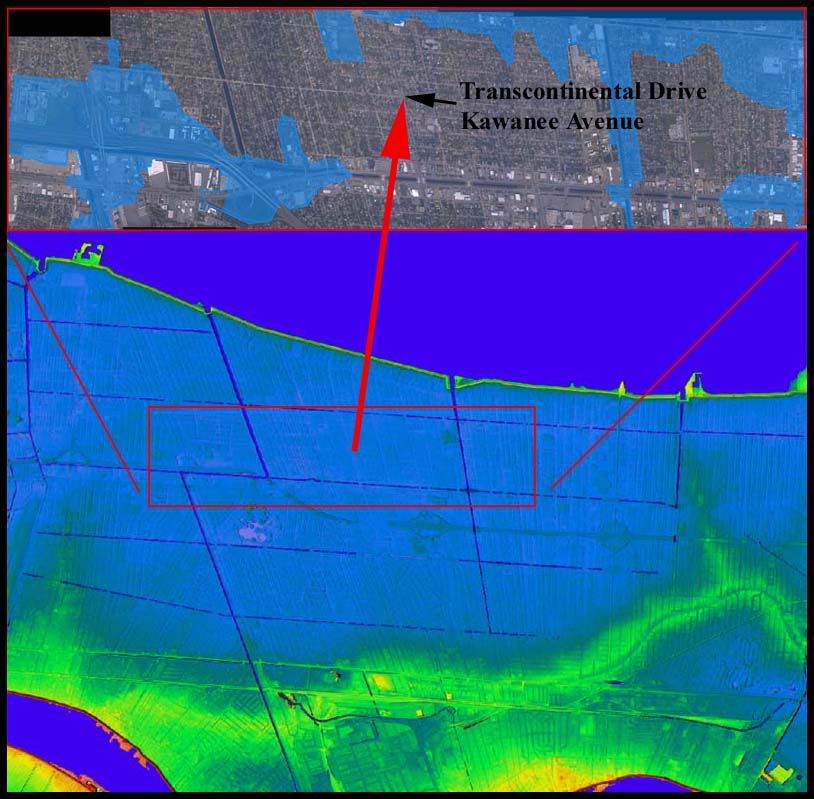
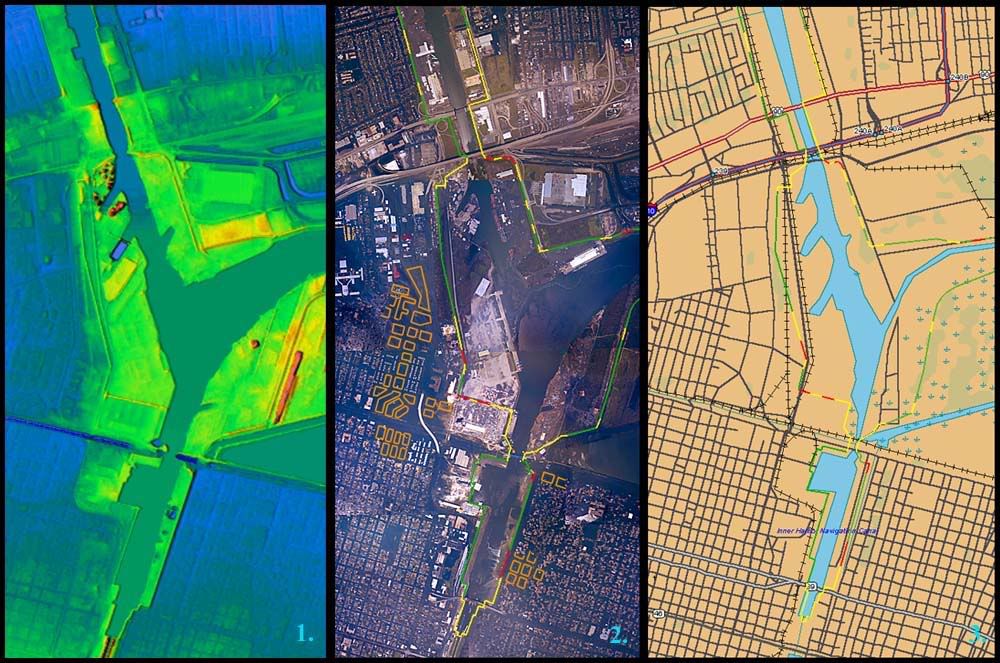
The image above is comprised of several elements. The top pane is a composite of 9 high resolution (4096 by 4096 pixels each) aerial images taken a few days after Hurricane Katrina. The transparent blue overlay in the top pane is the result of close-up examination for flooding indicators, such as debris patterns inconsistent with eyewall winds and evidence of soil transport.
The lower pane is a 3 meter (9 feet) per pixel Digital Elevation Model (DEM) including most of Kenner and western Metairie, Louisiana. This DEM was rendered with sea level artificially reduced to negative 10 below sea level feet in order to display areas inside the levee protection systems in their normally dry, pre-storm state.
The following was posted between 0645 and 0730 CDT, Monday, August 29th, 2005:
In Kenner, police Capt. Steve Caraway said the department's officers were pulled from the streets around 4:45 a.m., after the gusts became too intense.
Caraway said there were reports of street flooding in the 900 to 1200 blocks of Williams Boulevard. He also said there were reports that the Duncan Canal was close to overflowing.
Wind gusts of 84 mph were recorded at airport around 6 a.m.
~0700 CDT Report Source
The section of the Duncan Canal referenced in the above report is west of Kenner, near the New Orleans International-Moisant Field airport, where that canal goes underground to pass beneath the runway flowing WNW towards Lake Pontchartrain. Most evidence of flooding in this area appears to have been the result of the canal filling, almost certainly due to precipitation from pre-Katrina rain bands, to the point where the underground tunnels could no longer accomodate the flow, which then backed up and spilled over into surrounding areas. Other canals in this area which also pass underground for short sections show similar evidence of localized flooding.
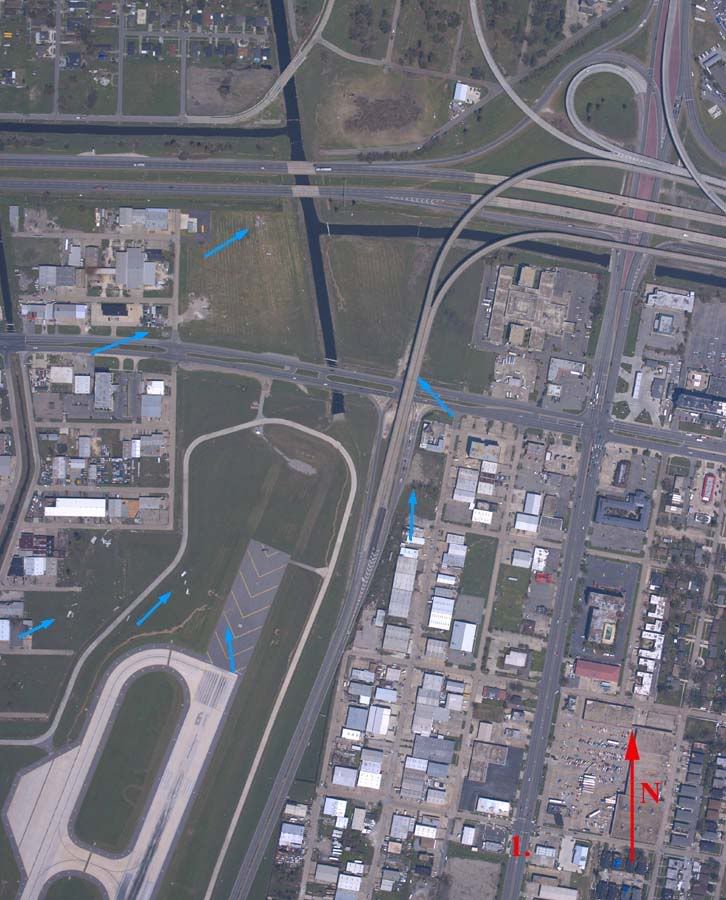
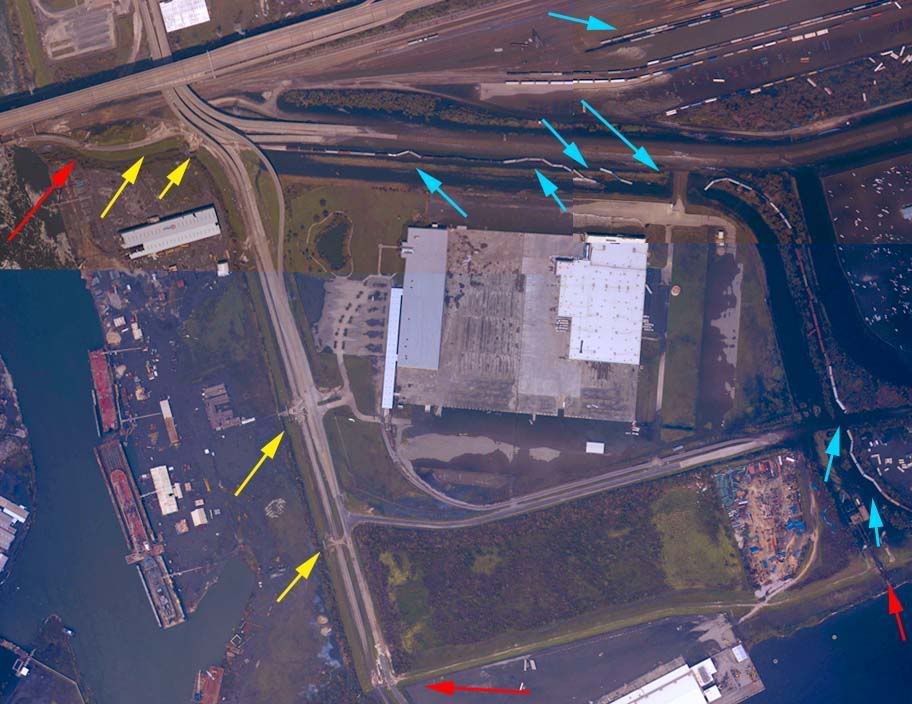
The above aerial photograph shows where the Duncan Canal emerges from underground near the north end of the airport, with the 2500 block of Williams Boulevard indicated by the red numeral 1. The center of Kenner is 4 blocks (2800 feet) south of this intersection. Evidence of flooding is indicated at the blue arrows.
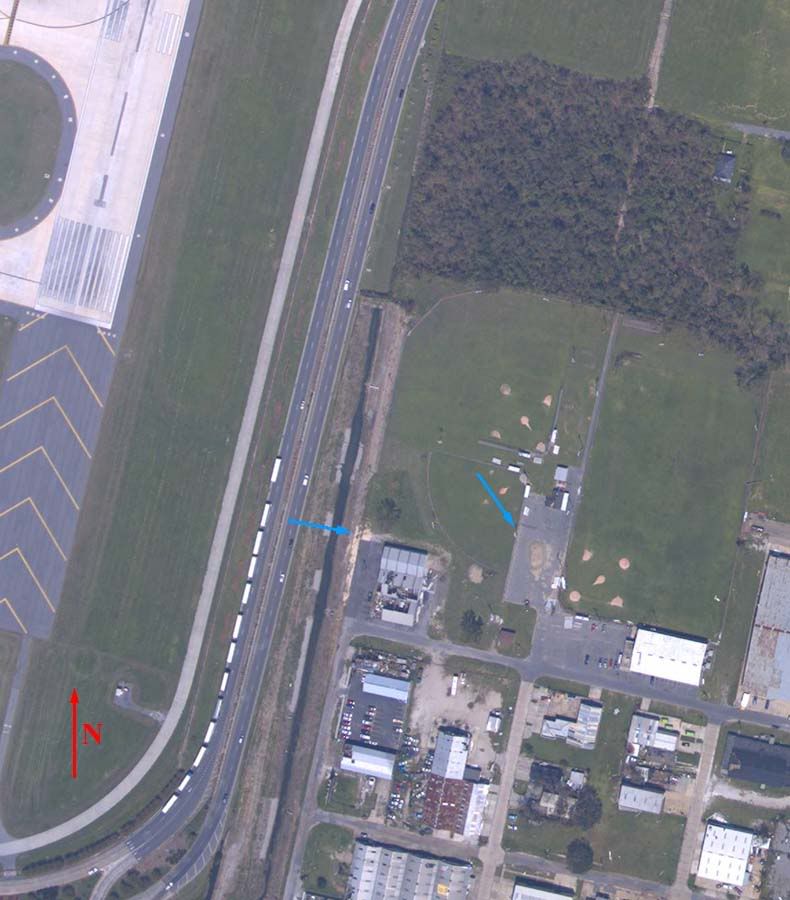
This above aerial photograph shows the area where the Duncan Canal goes underground southeast of the airport. The 1200 block of Williams Boulevard is out of the frame immediately east of the image's northeast corner. Flooding is indicated by the blue arrows. Those familiar with certain questions raised during the evacuations of downtown New Orleans may find other items of interest (13 of them, outbound) in this image.
Later in the day, as the rainfall continued to overwhelm canal pumps, the flooding continued to worsen, in areas further north of Kenner, much closer to the Lake, as evidenced by this report:
Kenner flooding serious
Monday, 1:45 p.m.
Williams Boulevard in Kenner is flooded north of I-10 to just before the lake levee, officials said.
Officials said the flooding appears to be more severe than seen on May 8, 1995. However, Lake Pontchartrain did not overtop levees. Throughout Williams and elsewhere in Kenner, businesses, homes and apartments are dealing with flooding and significant roof damage.
Chateau Boulevard is a zig-zag of trees and power lines blocking one of Kenner's main arteries.
1345 CDT Report Source
As noted in the 1:45 pm report above, any topping of the Lake Pontchartrain levees in this area was minimal, resulting in soil transport visible only at the highest zoom levels in the aerial images, which did not even reach the base of the inner levee surface. The flooding described above could therefore only have originated from rain and overflowing canals in Jefferson Parish. No levee breaches exist or contributed to this flooding.
Monday, 10:20 p.m.
Jefferson Parish's Chief Administrative Assistant Tim Whitmer said the damage from Hurricane Katrina was almost equally split between the east bank and the West Bank. "We have widespread devastation in the parish," he said.
Between 8 and 10 p.m., he said about 80 employees had arrived for work and said more were continuing to show up.
Widespread flooding also was reported in Kenner in East Jefferson, particularly north of the interstate.
The first step on Tuesday, Whitmer said, is to get all remaining flood water pumped out of the streets. Whitmer said parish officials expect to get most of the pumping stations online overnight, with the possible exception of the Duncan Canal and Bonnabel stations, which lost their roofs in the storm.
Workers were evacuated from those stations for safety reasons, he said. Work crews will inspect the stations Tuesday to determine if there is any additional damage besides the roofs.
Whitmer said he had been told by Sheriff's Office officials that Old Metairie was fairly dry and that by late afternoon, Levee District officials reported water levels dropping on Airline Drive in Kenner.
2220 CDT Report Source
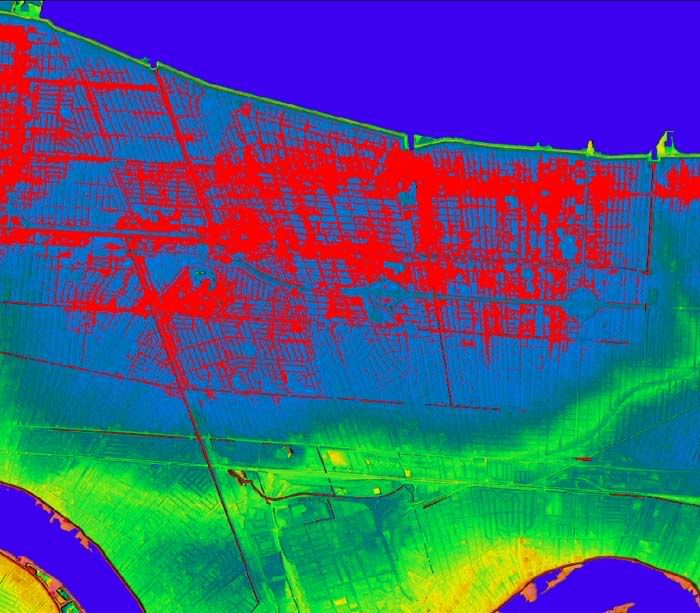
The above image is rendered from the same 3 meter per pixel DEM as used previously, this time with sea level (rendered in red) simulated at a level of negative 4.8 feet, the level which most closely matches the flood levels indicated by the aerial imagery analysis in Photo 1, applied to the wider Metairie/Kenner area. This analysis is based on two critical assumptions. One, that flooding through the Kenner/Metairie area was consistent, i.e., all the canals filled and all of them overflowed. This may or may not have been the case. Two, that all flooding that occurred left evidence still visible when the aerial imagery was captured. This is almost certainly inaccurate, as the area of Transcontinental Drive and Kawanee Avenue, referenced in the first available report of flooding, does not show evidence of current or prior high water as of the time the aerial imagery was taken. Because of this, this image may overestimate flooding that took place in areas where the pumps may have continued to run, and this image also almost certainly underestimates flooding that took place in areas where the pumps were either deliberately shut down, failed, or were unable to keep up with the rainfall.
Note in the original aerial imagery, all of the these flooded areas had already been drained and had dried (some still damp, but no standing water) before the sections of New Orleans that flooded as a result of levee breaches had even begun draining operations.
Aaron Broussard's decision to evacuate the Jefferson Parish pump operators may have played a role in this flooding. Because it has not been widely reported whether the pumps were abandoned while still in operation, or whether they were shutdown pror to the evacuation, it is currently unclear what impact the decision to evacuate the pump operators may have had. If the pumps were shut down prior to evacuation, or failed due to being unsupervised during that period, the damage directly resulting from that decision may be measured in the millions or billions of dollars.
Section 2. Analysis of the 17th Street and London Canal Breaches and Post Katrina Flood Sequence in Downtown New Orleans
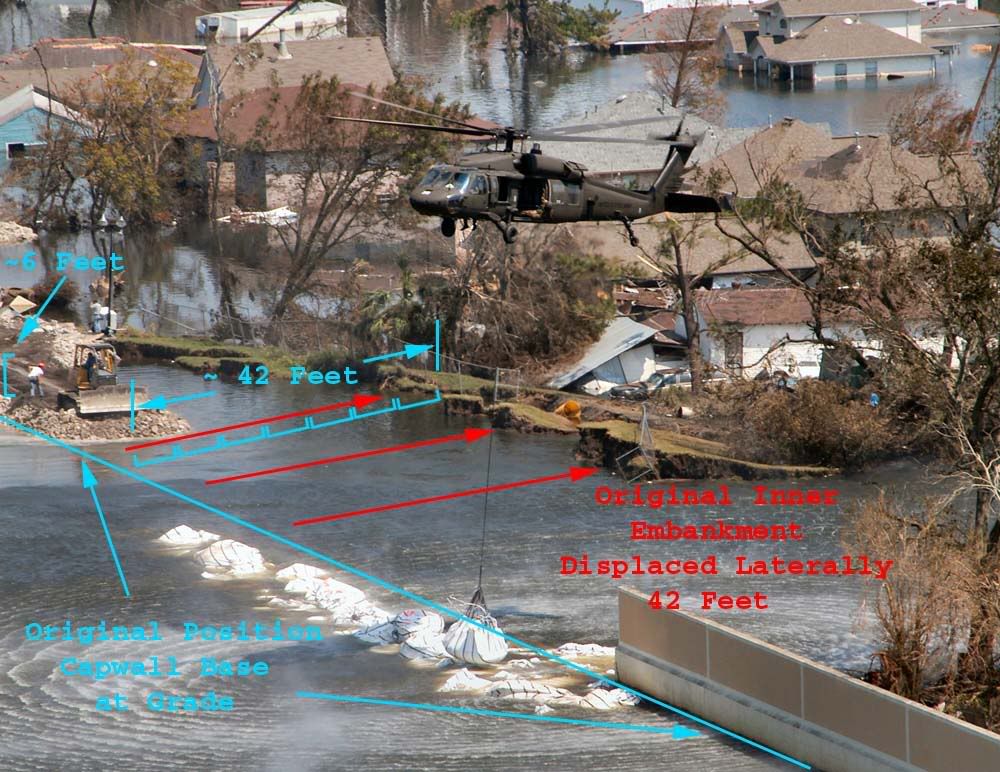
The images below clearly indicate the failure mechanism in the 17th Street Canal and London Canal I-Wall breaches. In the first image, from the 17th Street Canal breach, a layer of weak or weakened subsoil succumbed to lateral loads imposed by elevated water levels fed into the canal by storm surge on Lake Pontchartrain's southern shore, allowing the entire cross section of the embankment and capwall to be displaced an estimated 42 feet from their pre-storm position.
Similar evidence is shown in the image below from the southern London Canal breach.
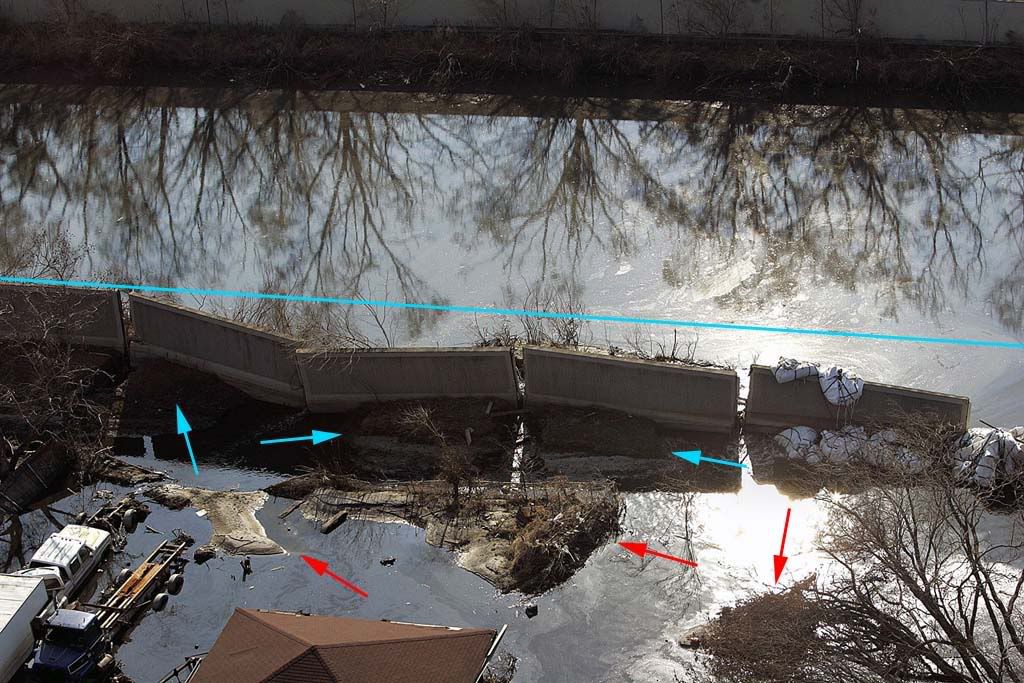
In addition, the image above gives some indication of the depth of the weak or weakened layer at this location. The cross-image blue line represents the approximate original position of the capwall's crown prior to the storm. Sections of the inner embankment were displaced as outlined above by the pressure of the high water on the canal side of the capwall, noted in the image at the blue arrows.
The red arrows, however, denote area of soil displacement which originated well behind the embankment and above the weak or weakened layer, and which were displaced and folded upwards when the embankment and capwall pushed them back in the course of its own displacement. These are secondary effects and almost certainly due to the same weak layer at some depth below original grade.
Because the post storm imagery indicates similar failure mechanisms between the 17th Street and London Canal breaches, the following discussion will not discriminate between the two locations.
At some point prior to failure, the resistence to lateral displacement of certain sections of the embankment, resistance owed primarily to the embankment and capwall's weight, footprint area, and the weak layer's "coefficient of friction", was approached by the potential energy of the weight of the surge water pushing in against the levee. When the two opposing forces reached equal magnitude, that section of the levee was essentially "floating" on top of the weak or weakened subsurface soil layer. This condition probably extended over a wide area, as original soil tests indicate that the weak soil layer was not an isolated occurrence. The variables which ordained certain sections to failure, while allowing other sections to survive, may never be fully known, but analysis of these must include the following possibilities:
1. Weak layer depth. A shallow weak area would necessarily support a lesser weight of soil above it, decreasing the resistance of all supported layers to lateral displacement, by reducing the force normal to the weak layer.
2. Embankment variations in cross section. Again, lower volumetric cross sections would exert less normal force (weight) on the standard layer/weak layer interface, and therefore allow less resistance to lateral displacement.
3. Percolation, seepage, and liquid entrainment in the weak layer and surrounding layers. As the water levels in the canal increased, pore pressure in the surrounding soils increased, almost certainly increasing percolation and entrainment. A saturated soil layer would have a net bouyant effect on anything immersed or supported by that layer. Percoaltion could also displace soil at critical locations, resulting in subsidence and loss of coherent structure in both supporting and supported layers. Transport of clay or slurry into or along the slipping interface between the weak layer and the displaced layers would further reduce resistence to lateral displacement.
4. Static and dynamic hydraulic forces. All three I-Wall failures occurred in close proximity to roadway bridges over the canals. Of these, the 17th Canal breach and the northern London Canal breach occurred just south of the roadway bridges, "downstream" to the flow of surge south from Lake Pontchartrain. The southern London Canal breach occurred just upstream from the bridge. Turbulence, standing waves, increasing or decreasing flow rates, helical flow regimes or standing vortices, all a potential result of bridge abutments, abutment foundations, piers, or pier foundations could contribute to localized variations, both static and dynamic with respect to time, in the hydraulic pressure exerted on certain sections of the I-wall system.
Regardless of what contributory factors led to the localized breaches, the breaches did in fact occur, setting in motion a precise chain of events culminating in the situational evidence available today. As the hydraulic pressure approached and then exceeded the levee section's ability to resist lateral displacement, the I-wall and embankment began to slide backwards, at first as a complete unit. Very soon there-after, however, the joints between the capwall's monolithic concrete sections came into tension as the no longer straight capwall attempted to lengthen to accomodate the new non-linear path. While these joints in many cases did not immediately fail, they also did not retain their watertight integrity, as evidenced in the post storm images above, allowing surge to flow in between capwall monoliths, eroding and scouring localized segments of the levee embankment.
With the full depth of the water's force applied to the capwall and sheet-piling, and only a partial depth of the force applied to the unprotected side of the levee embankment, in many instances the sheet-piling, capwall monoliths, and protected side of the embankment continued to be displaced, further and further from their original positions, leaving the outer embankment behind, in some cases all the way back in its pre-storm original position.
As the canal side of the embankment separated from the sheetpilings, the sheet pilings lost a great deal of support, allowing them greater latitude to deform and/or to lean backwards. Whether the sheet-pilings and capwall monoliths parted company at this point is immaterial, once freed of the embankment they rotated flat so as to offer the least resistence to the now flowing surge water, much as the links of a chain will orient themselves in accordance with a similar viscuous flow, stretching and in some cases rupturing the link mechanisms between capwall monoliths (sections). In many respects, the capwalls offered us valuable assistence. Although the breaching was now structurally complete, the flattened capwall monoliths offered some protection to the rear embankment, preserving the evidence for us to analyse after the floodwaters receeded, much as a rip-rap facing protects a surviving levee embankment from flow, scouring, and direct immersion.
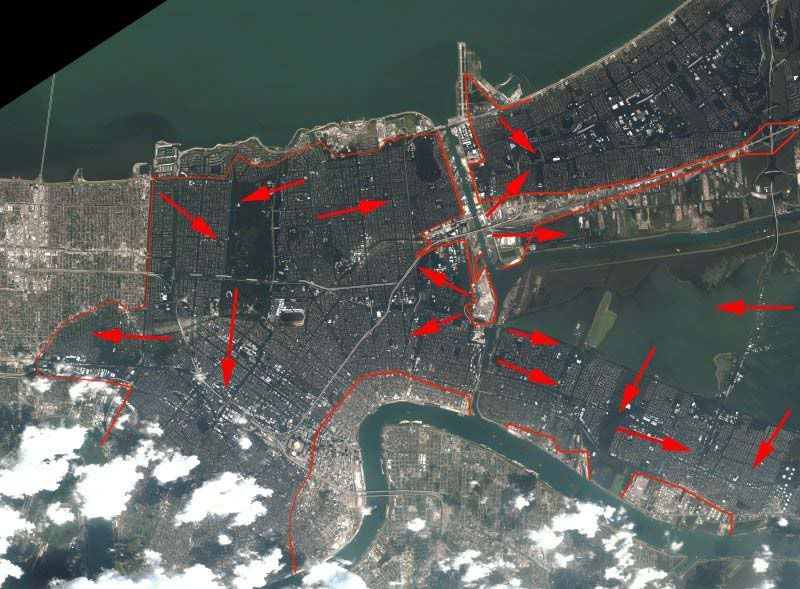
The flooding of the New Orleans downtown area originated from five major breaches, two in the Industrial Canal area, two along the London Canal, and one along the 17th Street Canal. The low lying sections of the urban area filled first, then became conduits for floodwaters to reach areas of higher elevation. The flooding seems to have stopped at the 3.0 to 3.5 foot ASL mark. Shortly after Katrina's passage, water levels in Lake Pontchartrain were measured at 5.5 feet ASL and dropping. Due to the relatively small area of the breaches and the large area of the city below sea level, the levels did not equalize until the Lake levels had dropped to between 3 and 3.5 feet ASL. The image below indicates the sources and directions of the major flooding sequences. Note that the ridge from Metairie extending west and south prevented floodwaters from levee breaches from reaching the Kenner and surrounding areas. The flooding in those areas was entirely due to failed, deliberately shut down, or overloaded pump stations in Jefferson Parish.
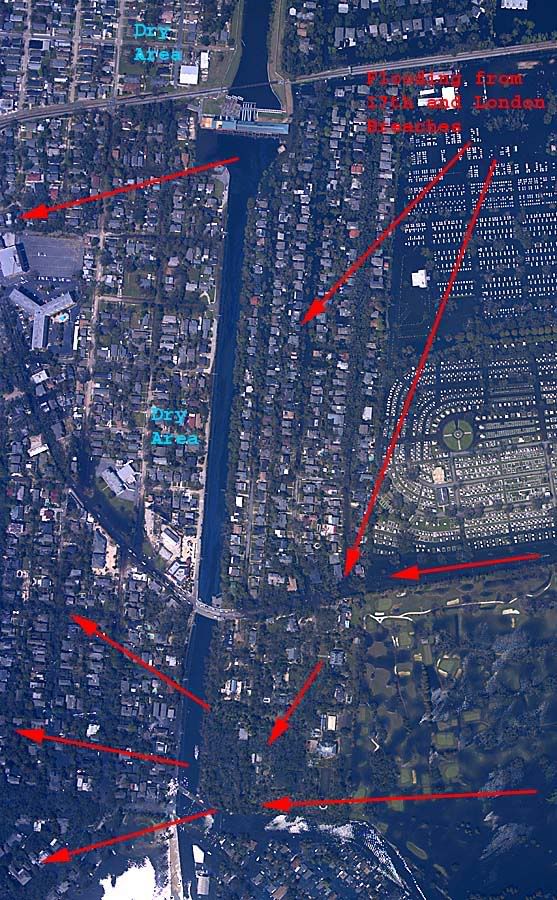
There were many media and anecdotal reports of a second breach along the 17th Street Canal, which led to the Metairie flooding south of Airline Drive. The best data available does not support these claims. Instead, as the flood levels from the previously discussed breaches deepened, eventually the water level topped the lower, inland canal walls south of the 17th Street Canal pumping station, on both sides of the canal, and flowed west from there, as evidenced in the image below.
Prior to Katrina's arrival, counter-clockwise winds along the northern and western reaches of the storm caused a surge along Lake Pontchartrain's southern shore. While some have debated the maximum depth of this surge, which was equaled in the connected 17th Street and London canals, the available evidence clearly shows that the Lake Pontchartrain levees were topped by storm surge or prolonged wave action.
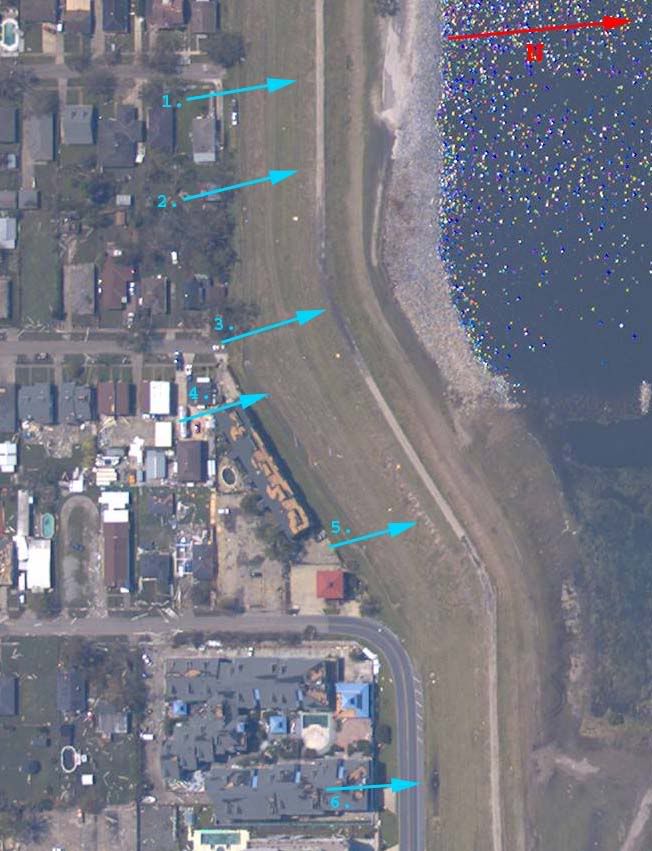
The above image clearly indicates topping of the Lake Pontchartrain levee immediately west of the 17th Street Canal outlet. Arrows at 1, 2, 4, and 5, point out evidence of fill transport, scouring, and topping at all elevations of the protected inner face of the embankment, base to crown. The dark area indicated by arrow 3 shows ponding still evident along the bike path atop the levee, and arrow 6 denotes ponding still evident along the inner base of the levee embankment. Per CoE documents, this section of the Lake Pontchartrain levee stands 14.5 feet ASL.
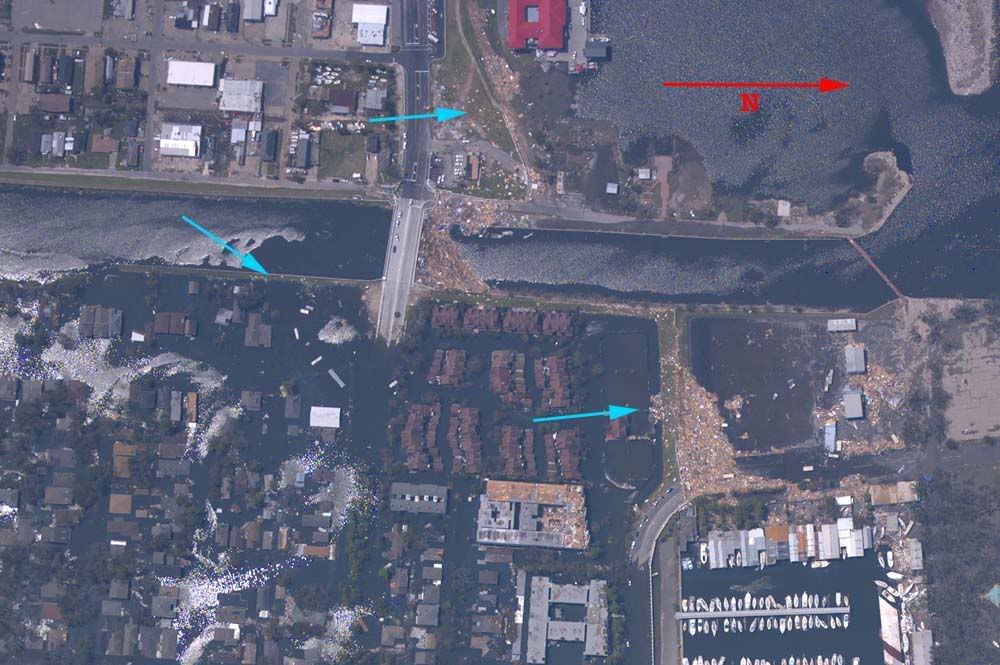
The above image clearly indicates topping of the Lake Pontchartrain levee immediately east of the 17th Street Canal outlet. The 17th Street Canal breach is shown at left center of the image. The blue arrows indicate locations where surge transported significant quantities of storm debris over the Lake levee's crown to deposit it on and below the levee's inner face. Per CoE documents, this section of the Lake Pontchartrain levee stands 13.5 feet ASL.
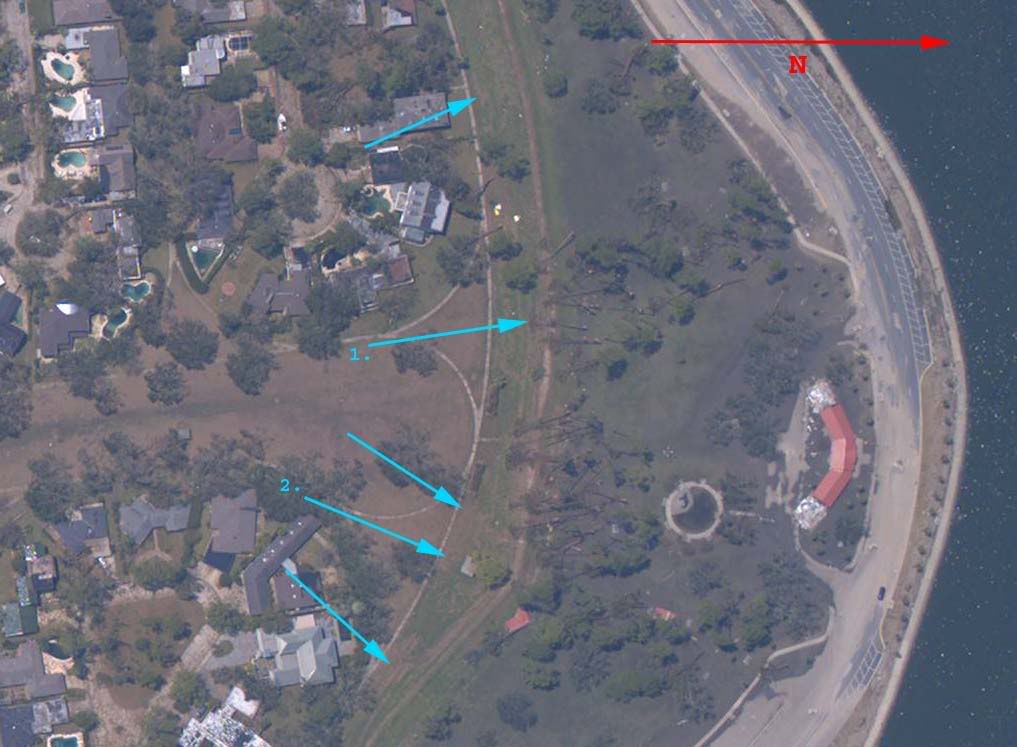
The above image clearly indicates topping of the Lake Pontchartrain levee immediately west of the London Canal outlet. The arrow at 1 indicates large trees transported by the surge over the crown of the levee embankment. The arrow at 2 indicates surge transported debris from the structure at right center to its present location, inside the protective embankment. The other arrows indicate fill transport and scouring along the inner face of the levee embankment. Per CoE documents, this section of the Lake Pontchartrain levee stands 17.5 feet ASL.
With both the London and 17th Street Canal outlets fully open to Lake Pontchartrain, demonstrated surge levels ranging from 13.5 to 17.5 feet above sea level would also have topped the 13.5 foot ASL Canal I-Walls. The city of New Orleans and the State of Louisiana, along with considerable federal funding, paid for storm surge protection to 11.5 feet ASL.
"The New Orleans area's last line of defense against hurricane flooding is a 475-mile-long system of levees, locks, sea walls and floodgates averaging about 16 feet high. The Army Corps of Engineers says the system will protect the city and suburbs from a Category 3 hurricane that pushes in enough seawater to raise Lake Pontchartrain 11.5 feet above sea level -- high over the head of anyone standing on the other side of a levee."
Source
The city received protection to levels of 13.5 to 17.5 feet ASL in the vast majority of locations, two to six feet above what was paid for, yet three locations unfortunately did fail under the impact of surge well in excess of the pre-approved design specifications, and allowed the city to flood. Although additional design considerations might have protected the entire I-wall system to Katrina's fury, and allowed the downtown area to escape the resulting devastating post storm flood damage, this must be attributed to an act of nature rather than a design or construction failure. New Orleans got all it paid for in I-walls, and then some.
Section 3. Surge Sequence for the Industrial Canal Basin, Analysis of the Five Major Breaches and east Orleans Parish Flooding
Subsection A - Storm Overview and Intercoastal Waterway Surge
Subsection B - Pre-conditions and Initial Industrial Canal Main Basin Surge
Subsection C - Topping and Breaching in the Industrial Canal and Related Ancilliary Basins
Subsection A-1. Storm Overview
In a timeline perspective, subsequent to the Kenner area pre-Katrina flooding, the next significant events to occur took place in the Industrial Canal area, immediately east of downtown New Orleans, west of the Ninth Ward (and St. Bernards Parish), and west of east Orleans Parish. Because all of these events and failures were interrelated, this analysis presents them as part of a unified sequence rather than isolated events.
Before proceeding to data and analysis, it is helpful to understand certain factors of the storm's large scale geometry, and how this geometry interacted with natural and manmade landforms in its path.
Prior to and during Katrina's arrival near New Orleans, the storm was moving almost due north, specifically, 357.2 degrees magnetic, based on the National Hurricane Center plots at 0709 and 1000 CDT. The inner radius of Katrina's eyewall was estimated to be 20 miles, with the strongest winds estimated to occupy an annular (doughnut shaped) area extending 10 additional miles from the inner eyewall. The now famous "jog to the east" which allowed New Orleans to "dodge a bullet" began sometime between 0200 CDT and 0323 CDT based on the respective NHC plots for those times. This had the effect of displacing the storm's circulation center 2.58 miles to the east.
As shown, the inner eyewall passed roughly 3 miles east of Chalmette, and the outer eyewall passed directly over the Super Dome in downtown New Orleans.
Though early post storm media reports that New Orleans had "dodged a bullet" were completely inaccurate on the basis with which they were presented, New Orleans did in fact, dodge the bullet, a potentially fatal one.
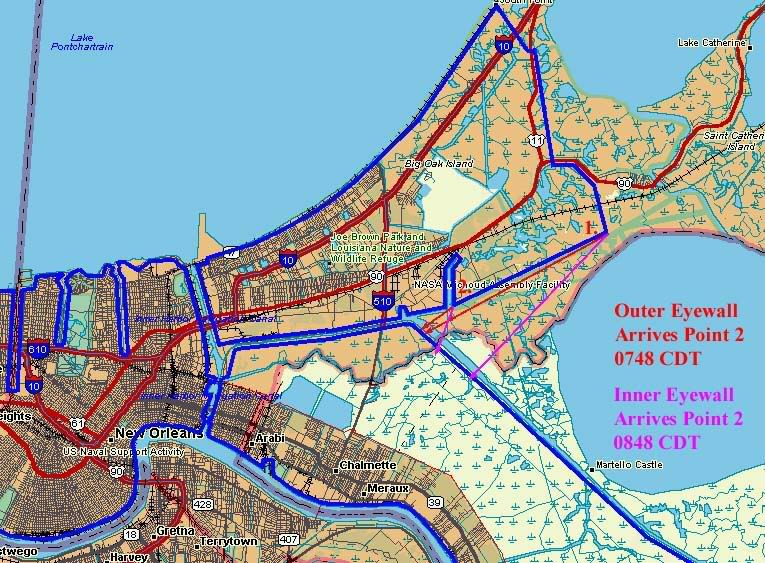
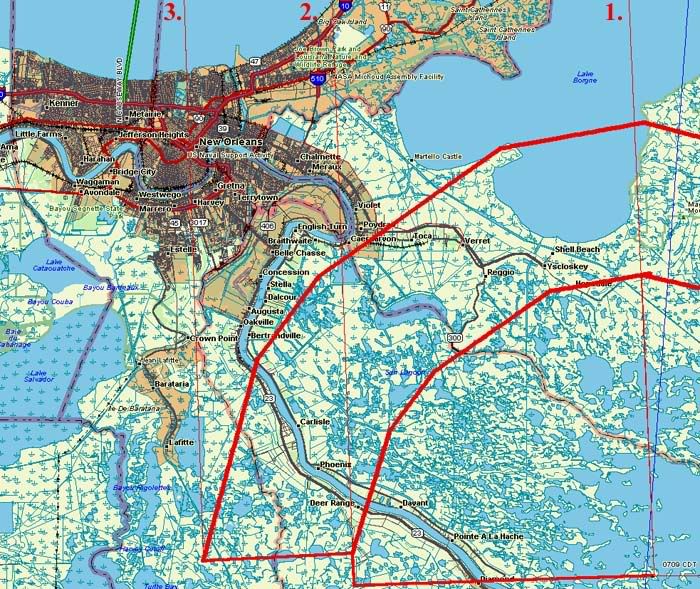
The above image is a subset of the previous one, and it outlines the hurricane protection levee system for the greater New Orleans metropolitan area, with two critical points indicated at numbers 1 and 2. Assuming that the winds at the outer eyewall were tangential to the eyewall's circumference, the wind directions associated with the eyewall's arrival are denoted by the respective red arrows at these two points. Due to the decreasing radius of the storm relative distance as the storm's center passed east of New Orleans, the wind direction changed as the storm passed, with the violet arrows denoting the wind direction as the inner eyewall transited the two critical points.
Subsection A-2. Intercoastal Waterway Surge 0730 - 0815 CDT
As shown in the above image, that reach of the levee system between points 1 and 2 acted as a protective barrier to the eastern mouth of the Intercoastal Waterway because the wind direction was unable to push Gulf water directly into the Intercoastal Waterway and thence, into the Industrial Canal basin. Instead, the Intercoastal Canal was subject to a secondary effect which greatly reduced the resultant flooding. Instead of pushing water directly into the canal, the wind's direction at all points in time during eyewall passage built up a surge effect against the St Bernards north east levee reach. Blocked by that levee, the surge then was partially returned (flow in the opposite direction of then current winds) by subsurface currents, and partially spilled sideways to the wind, meaning that a much smaller portion of the surge entered the Intercoastal Waterway Canal.
Had hurricane Katrina followed a track even as little as 5 miles west of its actual path, the reach of levee between points 1 and 2 on the earlier image, instead of serving as a protective barrier, would have acted to funnel storm surge from an area of Lake Borgne as wide as ten miles, into the 2000 foot wide Intercoastal Waterway, with unthinkable results. In addition to causing catastrophic damage to the levee system (and therefore to those areas these levees protect) all along the Intercoastal Waterway, a wall of water would have roared into the Industrial Canal basin, overwhelming levees on all sides, and then proceeding with the full force of wind driven surge into the heart of downtown New Orleans. Although it is difficult to make accurate estimates of the resulting effects, speculation cannot help but raise the possibility that significant portions of the high rise buildings in the downtown area could have been at risk of total structural failure, along with, and in addition to any and all smaller structures. In such an event, receeding floodwaters may have revealed no trace of the city which once stood there, the debris having been carried off to other locations, as documented for large areas of Galveston, Texas after the great 1900 storm. Even though New Orleans avoided this fate, the actual events proved more than destructive enough, as will be demonstrated very shortly.
Shortly after Katrina's passage, scientists from LSU, Notre Dame, and other facilities made public results from super-computer surge estimates, which may indicate higher surge levels and a greater funneling effect than what actually took place.
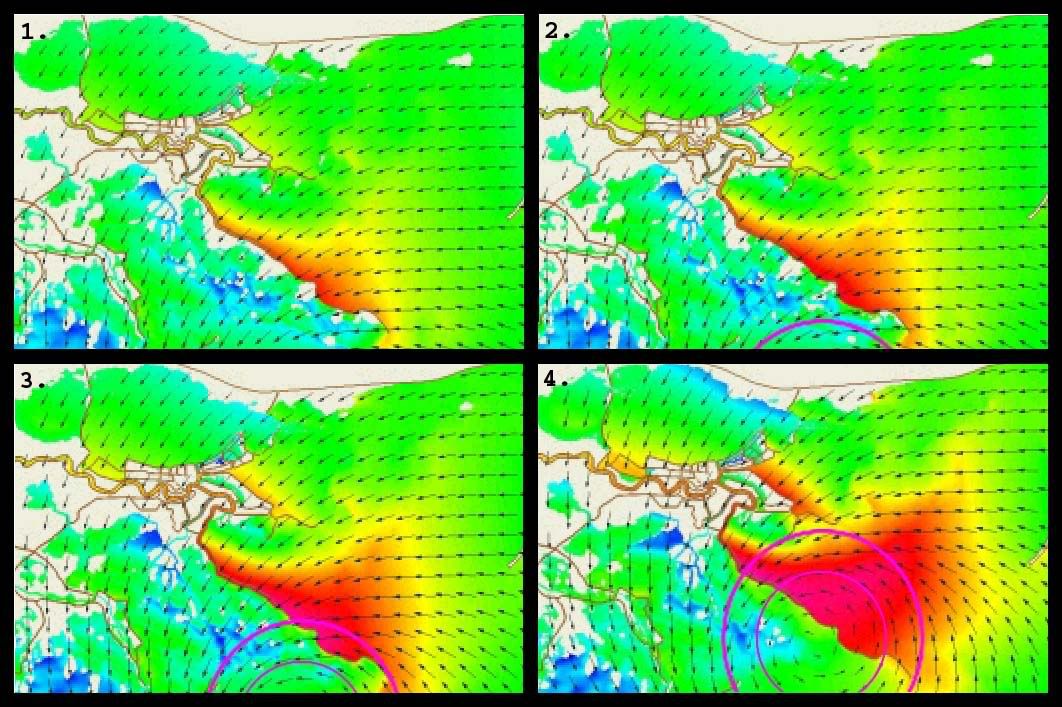
The above images are reproduced from the animated output of LSU's ADCIRC run simulating Katrina's storm surge as modelled by super-computer. For illustration, a scale representation of an eyewall with inner radius of 20 statute miles and outer radius of 30 statute miles has been overlaid where appropriate.
In panes 1, 2, and 3 of the first image, minor surge effects gather in the Borgne Lake basin, due to winds roughly perpendicular to the eastern reach of the Primary Protection Levee of St. Bernards Parish. The southeastern reach of the east Orleans levee is protecting the MRGO (Mississippi River Gulf Outlet)/Intercoastal Waterway junction from funneling effects, as discussed earlier.
In pane 4 of the first image, the surge begins to accumulate to deeper levels over time and with the approach of stronger winds nearer the eyewall. The wind direction is still perpendicular to the MRGO, and the east Orleans levee is still protecting the junction from direct surge effect.
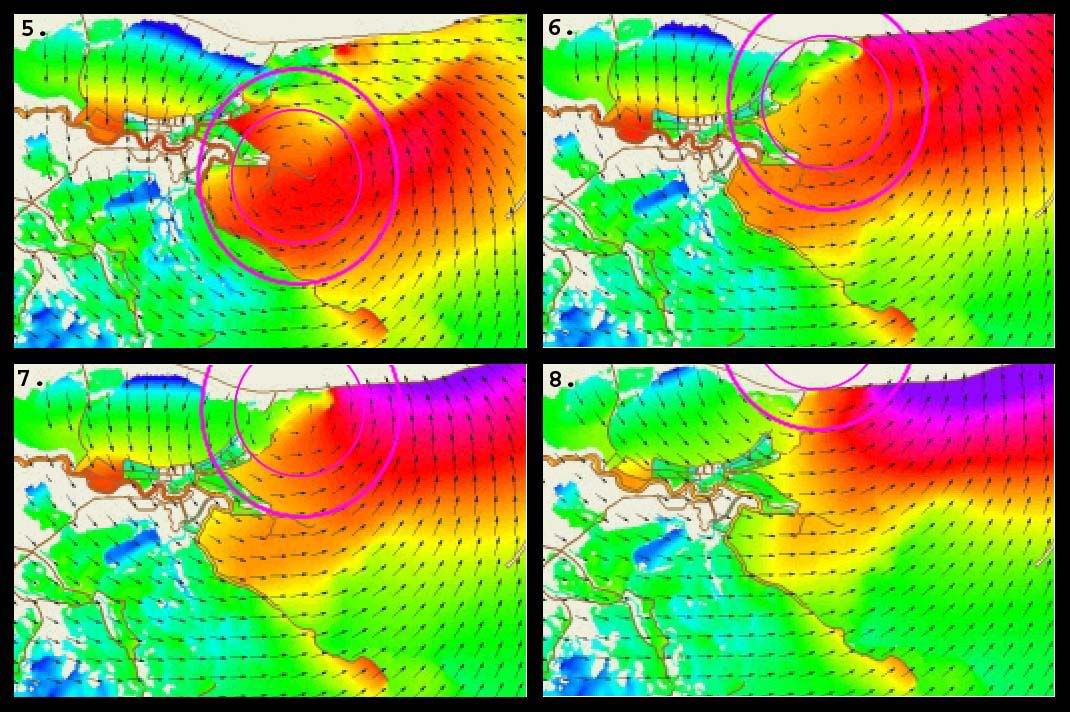
In pane 5 of the second image, the surge projection indicates that significant funneling is underway, a projection not substantiated by empirical data available after the storm. Ths appears to be from secondary effects as outlined below. One, the general trend over time as the storm's center approaches is for surge to accumulate in the Lake Boegne Basin. Two, tangential winds due north of Katrina's center are shown driving still more surge into Lake Borgne, pushing that surge already accumulated in Lake Borgne deeper into the Intercoastal Waterway, and this is where the model begins to diverge from reality. The model isn't "wrong" per se, any error is a matter of degree, not occurence.
While the ADCIRC code is generally reputed to represent the best available simulation software, it can only be as accurate as the components used to support it allow it to be. The primary supporting algorithms and data come from two other sources.
One:
The grid/topography/bathymetry that was used in the simulation was the S08 model run with the ADCIRC code. The S08 model was developed for the U.S. Army Corps of Engineers New Orleans District.
and two:
Atmospheric wind and pressure fields were generated with a U.S. Army Corps of Engineers version of Vince Cardone’s PBL Hurricane Simulator using 1.5 hourly interpolated track and storm information from NWS/NOAA and posted by Unisys at http://weather.unisys.com/hurricane/atlantic/2005/KATRINA/track.dat
ADCIRC/Katrina Source Information
Of these two supporting models, it is most likely that the windfield simulation generated output that to a certain degree, did not match reality well enough to account for the empirical evidence available only much later. Katrina was undergoing an eyewall replacement cycle as it came ashore, and the windfelds just inside the inner eyewall as represented in the model do not match well with anecdotal reports from persons who experienced passage of that eyewall over Poydras, south east of Chalmette, in St Bernards Parish. In the model the windfield continues inside the inner eyewall, ramping down in velocity slower than witnesses report. This would not be unexpected if the windfield modelling software was not perfectly aligned in tracking the vagaries of the eyewall replacement cycle. However, a calmer than depicted windfield within the inner eye would have significant effect on the surge model, especially in the secondary funneling effects under current discussion.
Looking closely at pane 5 in the second image, we see that a large percentage of the windfield driving surge directly west into Lake Borgne lies inside the eyewall. If the windfield simulation miscalculated velocity magnitudes in this area, if actual realtime velocities were lower than those modelled, much of the funneling effect depicted by the ADCIRC model would not have actually taken place.
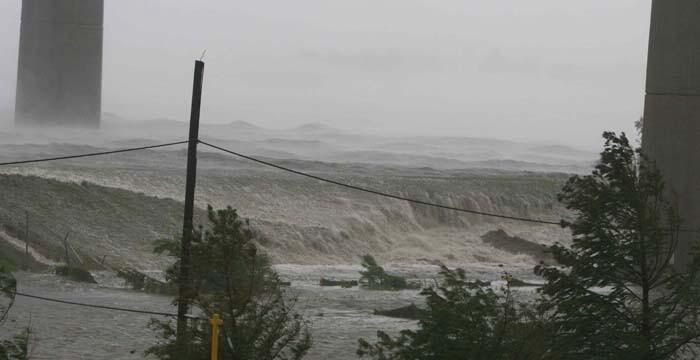
This means that at any given time, the maximum flow of water into the Industrial Canal basin was limited to the width of the Intercoastal Waterway, and by the heigth of those levees, generally 14 feet ASL. This is also corroborated by the image below, showing less than one foot of water spilling over the northern levee of the Intercoastal Waterway beneath the Paris Road bridge, a result of a storm driven wave, not general surge levels. The average water levels on the unprotected (Canal) side of the levee appear to be 2 to 3 feet below the levee, or at about 15 feet ASL.
 Subsection B - Industrial Canal Main Basin Surge 0745 - 0845 CDT
The image above is comprised of three main elements. Pane 1, at left, is rendered from a 3 meter per pixel National Elevation Database Digital Elevation Model (NED DEM). Pane 2, center, is a mosaic of 11 high resolution (4096 x 4096 pixels each) aerial photographs taken by NOAA shortly after the storm. Overlaid is a graphic representation of the Hurricane Protection Levee System, with sections that survived Katrina visibly intact displayed in green, levee sections which show visible evidence of being overtopped by storm surge displayed in yellow, and visibly breached sections displayed in red. The orange polygons indicate city blocks of structures shown by the DEM rendering, which have been erased by the storm, levee breaches, and subsequent flooding. This substantiates flood flow direction and sequencing, and also allows the viewer to evaluate for themself the validity of claims that the storm or political influences showed preference for any specific area. Pane 3 is a streetmap of the area, with the Hurricane Protection Levee System again overlaid using the same color coding system as Pane 2.
The earlier section which discussed storm geometry left off with a 14 foot surge proceeding west along the Intercoastal Waterway, towards the Industrial Canal, which runs generally north-south. The Intercoastal Waterway being a straight run between levees of generally similar distances apart, which imparted little in the way of dynamics or additional physical factors to the approaching storm surge, we now pick up the sequence as this water arrives at the western end of the Intercoastal Waterway and begins spilling into the Industrial Canal Basin.
Had this surge arrived as a wall of water entering the Industrial Canal Basin, the damage would have been catastrophic to all surrounding areas. Water weighs roughly 7.5 pounds per gallon, close to 70 pounds per cubic foot, and the cross section of the Intercoastal Waterway runs roughly 2000 feet wide. With a head of 14 feet ASL, such a flood translates to a mass on the order of roughly 1000 tons for just the leading one foot thickness. With the weight of the water extending behind the head of the flood 6.13 miles to the east entrance of the Intercoastal Waterway, the total mass involved rises to 31,719,072 tons. Had this flood arrived as a wall of water, much of downtown New Orleans would no longer exist. The damage that demonstrably did result, however, indicates that this flood arrived faster than a slow rise, perhaps what a beach tide might exhibit, but we currently do not have any way to estimate the slope of the advancing face of the flood. Therefore we settle for describing it as something between a wall and a tide.
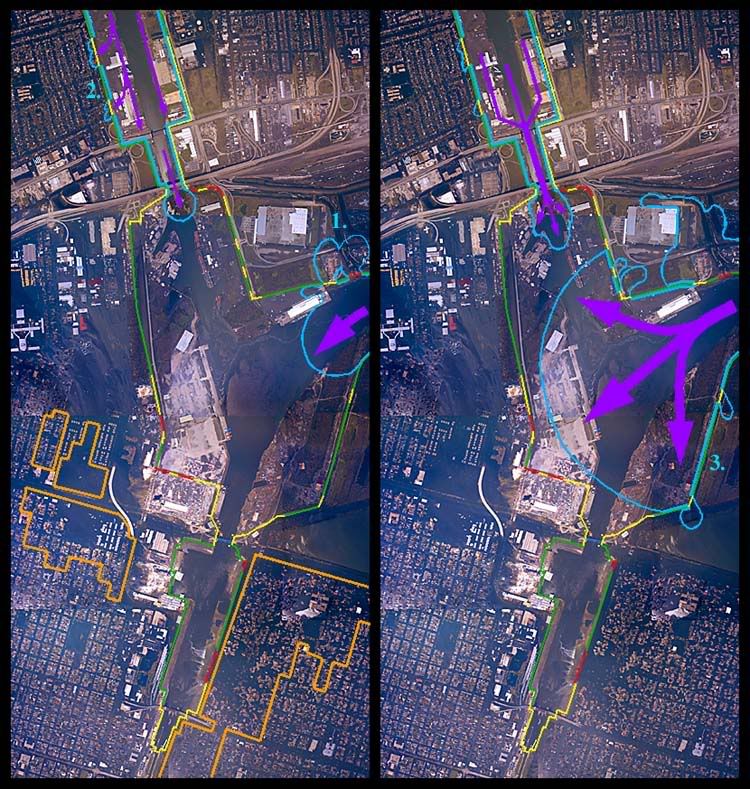
In Pane 1 (left) of the above image, the main surge from the Intercoastal Waterway is shown entering the Industrial Canal. A large white rectangular structure blocks some of its path along the northern flank and probably added to levee topping effect, a possible breach, and flooding indicated at point 1. It is unclear whether the red section of levee breached or was topped for a sustained period of time, but a significant amount of water entered the protected area here, enough to knock several railroad cars off their tracks and float Conex shipping containers several hundred yards from their original positions.
A combined effect of minimal surge well out ahead of Katrina, passing from the Gulf into Lake Pontchartrain, and Lake water driven southwest by winds on the far northwest quadrant of the storm, elevated Lake levels on the southern lakeshore, which then fed into the northern entrance of the Industrial Canal. On reaching the constriction formed by the abutments of the I-10 bridge (top center, Pane 1) this water began to back up, allowing minor topping to occur west of the Industrial Canal at location 2.
Possible standing waves created by the white rectangular structure, or causes unknown led to moderate levee topping north of location 3 in Pane two. A more serious topping occurred south of location 3 in the corner formed by the narrowing levee walls near the Florida Canal and Florida Canal bridge.
The main thrust of the surge, following the southwestward curving exit from the Intercoastal Waterway into the Industrial Canal moves towards the levee corner centered in Pane 2, setting the stage for the events depicted in Pane 3, below.
Floodwaters "clipping the corner" along the right flank of the main flow, northwest of the white rectangular structure topped, damaged, or destroyed a floodgate at this corner and soil transport from the overhead imagery indicates that minor flooding took place inside the protected area here.
Water continues spilling into the main Industrial Canal Basin from Lake Pontchartrain at reduced rates under the I-10 bridge.
Subsection C - Topping and Breaching in the Industrial Canal Main Basin 0755 - 0810 CDT
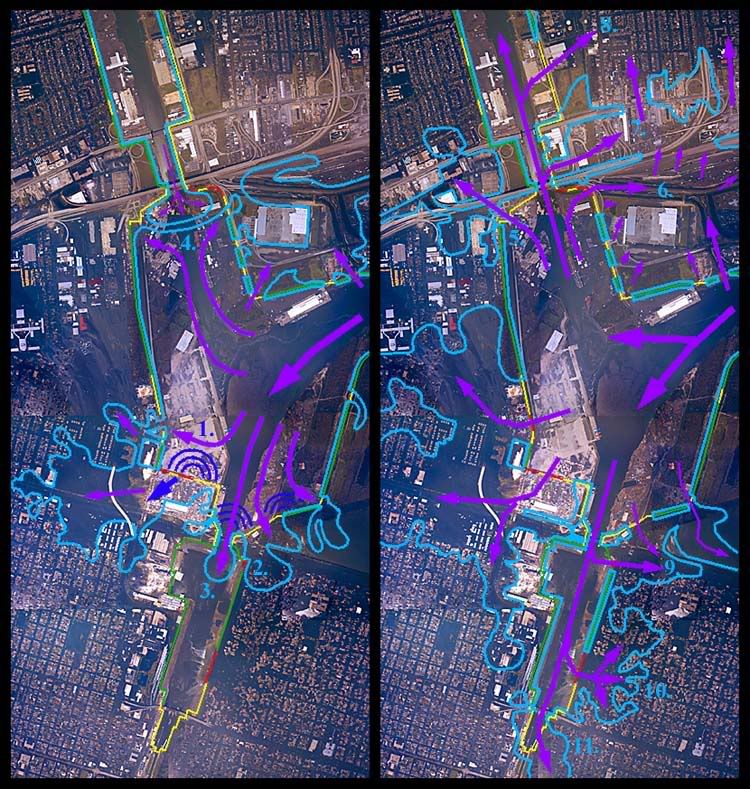
At this part of the sequence, events begin occurring rapidly. For simplicity, individual events are assigned a number and labelled below. Events 1 through 4 refer to depictions in Pane 3 (left) of the image above, and events 5 through 11 refer to depictions in Pane 4 of the above image.
1. As the large and rapidly spreading "front" of the advancing surge expands into the Industrial Canal Basin, it encounters an obstacle which essentially comprises a wall blocking its path. Though not continuous, or fully closed, the tiny opening beneath the Florida Street Bridge may as well not exist for all the force it is able to dissipate in allowing a miniscule portion of the main surge to pass through, south towards the Industrial Canal Lock.
Liquids in general, and water specifically, do not compress, as anyone who's ever smacked the top of a pop bottle full of water can attest. (This is not a recommended experiment.) The force is transmitted at high speeds through the liquid and transferred to any bounding material at the periphery of the liquid. In the example of the pop bottle, the bottom glass can easily shatter outward with high velocity. From Einsteinian physics we know that the results are the same whether the hand is moving and impacts the bottle, or whether the bottle, and therefore the water in it, are moving and impact a human palm.
In the case of a walled and floored container, open at the top, such as a cakepan or the Industrial Canal main basin, an impact to the outside of the container will transmit shockwaves into the liquid inside, some of which travel towards the surface, where they dissipate on reaching and being transmitted into the atmosphere above the surface of the liquid. The "container" effect is less, because even though the liquid still cannot be compressed, energy can escape at the surface, but under the surface, the shock waves still propagate, and movement of these shockwaves towards the surface is inhibited and slowed by the weight of the water above the main lines of shockwave propagation. Again, the Einstein/Lorentz Transforms demonstrate that it makes no difference whether a moving seawall strikes a still body of water, or a moving wall of water strikes a rooted seawall, the energy transfer effects remain the same.
For these reasons, when the head of the floodwaters smacked into the rapidly constricting levees north of the Florida Canal bridge, two things happened simultaneously. One, a tremendous amount of force was transferred to these levees, and two, (Newton's equal and opposite reaction), a "hydrostatic shock wave" was reflected back into the water, propagating generally in reverse of the current flow. Examples of these shockwaves are depicted in Pane 3 by the sets of dark blue concentric arcs.
The primary repercussion of this series of collisions was for floodwaters to almost immediately top all involved sections of the levees in this area, noted at locations 1 and 2 in Pane 3. The tremendous forces imparted to the levee caused nearly instantaneous breaching as shown by the red lines near location 1, and it would not be surprising if onsite analysis provided evidence that these two breaches occurred explosively, with levee material being embedded in structures at some distance from their original locations.
There has been a single, uncorroborated report that a floodgate allowing railroad access through the levee system had been damaged two to three weeks prior to Katrina's arrival, and left open as a result. If this report turns out to be true, then there are three locations where this might have happened. The most likely location is in the corner currently under discussion. Possibility two is in the "clipped corner" near the white rectangular structure discussed in the last section, and possible location three is just south of the east abutment of the I-10 bridge.
The results of such a floodgate being left open at location 1 are both hugely significant, and at the same time, inconsequential. I do not believe that this corner of the levee system would have survived the surge in any event, possible floodgate open or not. However, the closeup aerial imagery clearly demonstrates that the force of the floodwaters entering this breach was of a magnitude sufficient to level large areas of manmade structures, numerous entire city blocks. Even a floodgate that held for a minute or two before failing, allowing water to flow over the levee system at first, rather than through, could have reduced the impact of the ensuing rapid flooding.
At nearly the same time as the levee breached and/or was topped, the reflected shockwaves were being driven nearly head-on into the continuing current flowing from the mouth of the Intercoastal Waterway. This diverted enough of the current to the west as to cause breaching and scouring along the western reaches of the levee corner.
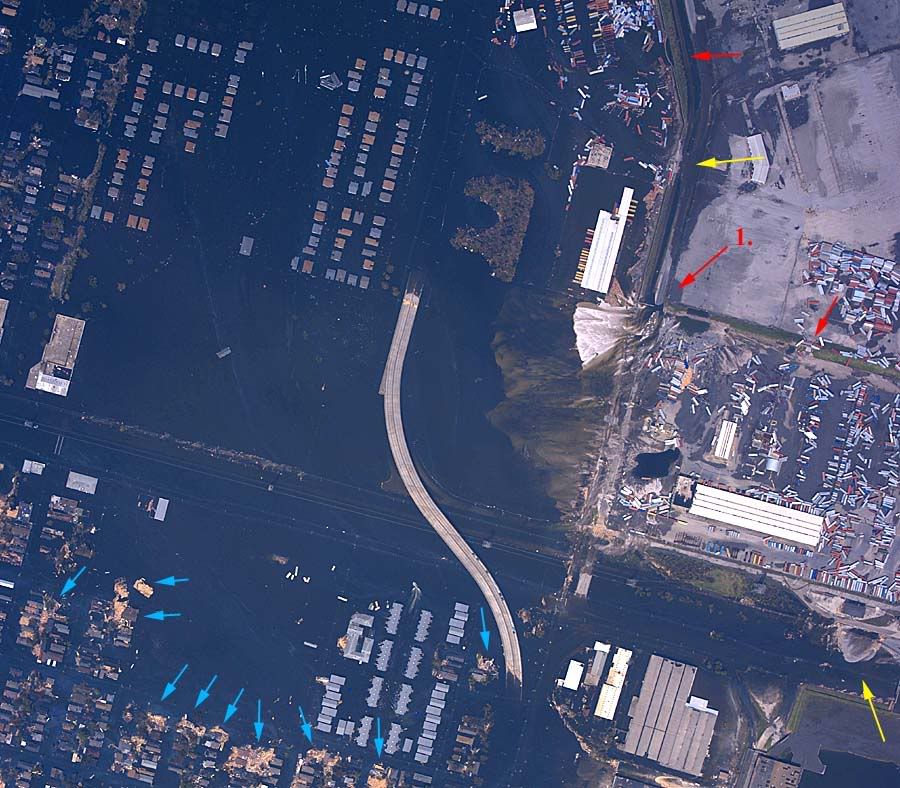
In the image above, the possibly open floodgate and certain corner breach is indicated by arrow 1. Two other breaches are indicated by the other red arrows, and significant scouring, topping, and subsequent flood flow damage effects are seen at the nearby yellow arrow. The yellow arrow in the lower right corner of the image points out another significant scour effect and soil transport from topping, which took place near a pumping facility there. Large quantities of wood frame structures destroyed or transported by the surge are indicated by blue arrows. One of the blue arrows points to a probable multi-unit residential structure transported nearly intact at least one city block in displacement. Behind it (downstream) is another probable multi-unit residential structure which is no more than 50% intact.
2. On the eastern side of the Industrial Canal near the Florida bridge (bottom center) the angle of the levee with respect to the primary current allowed that reach to largely survive, topped instead of breached. A significant quantity of water flowed into the protected area here, and close up inspections of the aerial images show scour marks and soil transport leading directly to the breach indicated near location 2 (Pane 3). It is highly likely that this breach actually occurred later in the sequence, but this scouring undoubtedly led to a weakened condition for the levee corner at this point, and probably was the deciding factor in that eventual breach.
3. In spite of reflected shockwaves and the constriction of the opposite side levees at the Florida bridge, quantities of surge water continued to flow into the next basin, adjacent to the Industrial Canal Lock.
4. 5. and 6.
At the northern end of the main Industrial Canal basin, the surge flowing north from the Intercoastal Waterway apparantly met a smaller surge flowing south from Lake Pontchartrain at location 4 in Pane 3. Three things most likely happened at this point, one, a standing wave of impressive proportions probably formed, (which no living human probably saw, and if he had, no-one would have believed him) before the much larger surge flowing north defeated the Lake surge flowing south, and two and three, substantial amounts of water were diverted left and right of the collision, as indicated at locations 5 and 6 of Pane 4. These lateral currents quickly impacted the levees on either side south of the I-10 bridge, with explosive or near explosive impacts (red arows on closeup image). To the west of the Industrial Canal, significant soil transport and scouring are evident, and this area probably would have breached except for the lucky fact that the levee here is part of the on/off ramp for the interstate exit, capped with pavement and much thicker in cross section than a typical earthen levee. East of the Industrial Canal, lateral flows did breach the levee in one location, and caused a near breach scour nearby (yellow arrows) that allowed large quantities of water into the protected areas. Near (slightly southeast) the numeral 6 in Pane 3, the floodwaters racing through this breach in a mostly easterly direction derailed 14 railway freight cars, with presumably 4 of them no longer in evidence in any imagery available (blue arrows on closeup image indicate derailed freight cars). Northeast of that location numerous Conex type railway containers were removed from their flatcars and transported east southeast into the scrub and woods there.
7. and 8. After passing northbound beneath the I-10 bridge, the surge waters topped levees east of the Industrial Canal, both north and south of the highway 90 bridge. Although no breaching is visible, scour patterns and soil transport indicate a considerable volume of water passed through this area. Between this flow and the flow through the breaches described in point six of this section, a significant percentage of the total east Orleans urban area flooding is probably accounted for. The remainder probably came through a topped floodgate/breach near the Lakeview Airport, with a possibly measurable amount coming over the Lake Pontchartrain levees along the northern extent of the Parish. It is possible that surge waters from other breaches east and south of east Orleans Parish contributed to the total, but the water in the urban areas seems to have risen slowly, as no scouring or soil transport is visible in the aerial images from the area. Therefore, precise analysis of the east Orleans Parish flooding sequence is not now, and may never be available.
9. A corner section of levee, probably severely undermined from surge that over topped a nearby earthen levee failed here, releasing water into New Orlean's 9th Ward. This may be the only true case of levee failure due to scouring at the base in the whole region affected by Katrina. Rebound from the northern lock gates may have been a contributory factor.
10. and 11. Three main factors involved here. One, rebounding shockwaves from the northern lock gate and associated levee reaches would have ramped up lateral loads on the failed section by an order of magnitude or more. Two, these sections probably suffered significant and prolonged topping. Some levee heigth maps show this area's levees to be only 13 feet ASL, while the main Industrial Canal Basin levees are 15 feet ASL. The earlier this section (10.) failed, the less that scouring was a contributing factor to the failure. The National Weather Service issued a flood warning containing the information that the levee was breached by a runaway barge at 0814 CDT, and all anecdotal accounts of flooding are referenced to times later than this. I've seen National Weather get tornado warnings out within a few minutes of receiving the information from the Skywarn network, so it is likely that this breach occurred between 0805 and 0810 CDT. That the first report available also includes information that the barge was at fault at the very least indicates that the barge couldn't have floated through the breach very long after it occurred, and indeed supports evidence that the barge itself was a major contributing factor to the breach. Exhaustive searching has failed to turn up any other barges of similar appearance in the Industrial Canal or Intercoastal Waterway, so attempting to find the pre-storm location of this barge's mooring or ownership has yet to yield results. Determining whether or not the barge caused the levee breach should be a simple matter to anyone with access to the site. Both the barge and the now exposed failed capwall sections should bear significant evidence to demonstrate any collisions which may have occurred.
The southern end of this basin, the lock gate, and the eastern wall of the lock itself suffered severe overtopping, with the resultant floodwaters exhibiting sufficient power to dislodge numerous residential and other structures from their foundations.
The water from the breaches referenced above, as well as the instances of topping probably were the main factors in the 9th Ward flooding, but probably not the main cause for flooding in Chalmette and Arabi. More detail on this subject in the St. Bernard section.