Skip to comments.
Don't Let Kids Grow Up ‘Red'
San Jose Mercury News ^
| 2/9/07
| Anonymous Editorial
Posted on 02/09/2007 8:08:06 PM PST by ProtectOurFreedom
Mamas, don't let your babies grow up in “red” states.
That's the compelling conclusion of author Michael R. Petit, whose new book, “Homeland Insecurity,” makes a strong case that children in red states are more likely to suffer from poor prenatal care, early death, child abuse and teen incarceration than children in “blue” states.
Petit's argument is that states with anti-tax, anti-government ideology are significantly harming their children's health. His book should be required reading for parents and lawmakers -- especially so in California, which is considering legislation that would significantly improve the health of its children. Petit, president of the Every Child Matters Education Fund and a former commissioner of Maine's Human Services Department, has been studying state government's impact on children for the past 25 years.
California ranks 19th on Petit's child vulnerability index, which is based on 16 different child-focused criteria. Ten of the top 11 states on the list are blue states. No fewer than 24 of the 25 bottom states are red states.
California would rank significantly higher in the overall rankings if it did a better job of insuring its children. More than 12 percent of California's kids -- roughly 800,000 -- have no health care coverage, ranking the state 42nd in the nation. The only states that are worse are all red states: Texas, Florida, New Mexico, Montana, Nevada, Arizona, Oklahoma and Colorado.
California ranks considerably better in the number of deaths of infants per 1,000 (No. 7), per capita child welfare expenditures (No. 5) and child abuse fatalities (No. 21).
(Excerpt) Read more at mercurynews.com ...
TOPICS: Culture/Society; Government; News/Current Events
KEYWORDS: marxist; puke; whowritesthiscrap
Navigation: use the links below to view more comments.
first previous 1-20, 21-40, 41-59 last
To: originalbuckeye
Depends on whether it's geography or demographics: the liberals are concentrated mostly in the coastal south and the Bay Area--the rest of the country is generally not as liberal; and demographically, California is very much a blue state.
41
posted on
02/10/2007 12:51:49 AM PST
by
Jedi Master Pikachu
( There are too many liberal, anti-American Wikipedians--and people in general.)
To: HiTech RedNeck
Even if you cut off the illegal aliens, many--if not all--of those states would still be poorer. This isn't so much an illegal immigration issue.
California has the largest amount of illegal aliens, and as other freeper(s) have pointed out, there is considerable crime compared to some states. However, it is not comparatively poor. And, of course, it is a blue state.
Texas is a red state, and also has a lot of aliens--and they aren't that poor, either.
42
posted on
02/10/2007 12:56:38 AM PST
by
Jedi Master Pikachu
( There are too many liberal, anti-American Wikipedians--and people in general.)
To: staytrue
Exactly! the blue states are only "blue" because they they have $hithole urban populations that overwhelm the conservative voters. This article is so insanely backwards. Crime and poverty IS the blue portion of states.
43
posted on
02/10/2007 2:54:22 AM PST
by
boop
(Now Greg, you know I don't like that WORD!)
To: boop
From the U.S. Census.... Current Population Survey The 2005 Current Population Survey Annual Social and Economic Supplement shows the following results: Income Overview 2004 marked the second consecutive year in which real median household income showed no change. Race and Hispanic Origin Real median household income did not change between 2003 and 2004 for non-Hispanic whites, blacks or Asians or for households with Hispanic householders. Black households had the lowest median income in 2004 ($30,134) among race groups. Asian households had the highest median income ($57,518). The median income for non-Hispanic white households was $48,977. Median income for Hispanic households was $34,241. Comparison of two-year moving averages (2002-2003 and 2003-2004) showed that the real median income for households with householders who reported American Indian and Alaska native as their race was statistically unchanged. The same was true for native Hawaiian and other Pacific islander households. Regions Real median household income remained unchanged between 2003 and 2004 in three of the four census regions — Northeast ($47,994), West ($47,680) and South ($40,773). The exception was the Midwest, where income declined 2.8 percent, to $44,657. The difference in income between the Northeast and West was not statistically significant. The South continued to have the lowest median household income of all four regions. The Northeast and West had the highest incomes among regions. Nativity Real median income remained unchanged for native as well as for foreign-born households between 2003 and 2004. Native and foreign-born households had a median income in 2004 of $45,319 and $39,421, respectively. Earnings Real median earnings of men age 15 and older who worked full-time, year-round declined 2.3 percent between 2003 and 2004, to $40,798. Women with similar work experience saw their earnings decline by 1.0 percent, to $31,223. Reflecting the larger fall in the earnings of men, the ratio of female-to-male earnings for full-time, year-round workers was 77 cents on the dollar, up from 76 cents in 2003. Poverty Overview There were 37.0 million people in poverty (12.7 percent) in 2004, up from 35.9 million (12.5 percent) in 2003. There were 7.9 million families in poverty in 2004, up from 7.6 million in 2003. The poverty rate for families remained unchanged at 10.2 percent. The poverty rate and the number in poverty showed no change for the different type of families. As defined by the Office of Management and Budget and updated for inflation using the Consumer Price Index, the average poverty threshold for a family of four in 2004 was an income of $19,307; for a family of three, $15,067; for a family of two, $12,334; and for unrelated individuals, $9,645. Race and Hispanic Origin (Race data refer to people reporting a single race only.) In 2004, the poverty rate declined for Asians (9.8 percent in 2004, down from 11.8 percent in 2003), remained unchanged for Hispanics (21.9 percent) and blacks (24.7 percent) and rose for non-Hispanic whites (8.6 percent in 2004, up from 8.2 percent in 2003). The poverty rate of American Indians and Alaska natives did not change when comparing two-year averages for 2002-2003 and 2003-2004. The same was true of native Hawaiians and other Pacific islanders. Age For all children under 18, both the 2004 poverty rate (17.8 percent) and the number in poverty (13.0 million) were unchanged from 2003. The poverty rate increased for people 18 to 64 years old (from 10.8 percent in 2003 to 11.3 percent in 2004), but declined for those age 65 and older (from 10.2 percent in 2003 to 9.8 percent in 2004). Nativity The native-born population had increases in both their poverty rate (from 11.8 percent in 2003 to 12.1 percent in 2004) and their number in poverty (from 30.0 million in 2003 to 31.0 million in 2004). Foreign-born naturalized citizens had a 2004 poverty rate of 9.8 percent, compared with 21.6 percent for those who had not become citizens; both rates were unchanged from 2003. Regions The Midwest was the only region to show an increase in their poverty rate – 11.6 percent in 2004, up from 10.7 percent in 2003. In 2004, the poverty rates for the Northeast (11.6 percent), South (14.1 percent) and West (12.6 percent) were unchanged from 2003. The South continued to have the highest poverty rate. Health Insurance Coverage Overview The percentage of the nation’s population without health insurance coverage remained unchanged, at 15.7 percent in 2004. The percentage of people covered by employment-based health insurance declined from 60.4 percent in 2003 to 59.8 percent in 2004. The percentage of people covered by government health insurance programs rose in 2004, from 26.6 percent to 27.2 percent, driven by increases in the percentage of people with Medicaid coverage, from 12.4 percent in 2003 to 12.9 percent in 2004. The proportion and number of uninsured children did not change in 2004, remaining at 11.2 percent or 8.3 million. Race and Hispanic Origin (Race data refer to those reporting a single race only.) The uninsured rate in 2004 was 11.3 percent for non-Hispanic whites and 19.7 percent for blacks, both unchanged from 2003. The uninsured rate for Asians declined from 18.8 percent to 16.8 percent. The uninsured rate for Hispanics, who may be of any race, was 32.7 percent in 2004 — unchanged from 2003. Based on a three-year average (2002-2004), 29.0 percent of people who reported American Indian and Alaska native as their race were without coverage, higher than the rate for native Hawaiians and other Pacific islanders (21.8 percent) and for those of other race groups, but lower than that of Hispanics. Comparisons of two-year moving averages (2002-2003 and 2003-2004) showed that the uninsured rates for American Indians and Alaska natives and for native Hawaiians and other Pacific islanders did not change. Nativity While the proportion of the foreign-born population without health insurance in 2004 (33.7 percent) was unchanged from 2003, the rate for the native-born population increased (from 13.0 percent in 2003 to 13.3 percent in 2004). Regions The Midwest had the lowest uninsured rate in 2004 (at 11.9 percent), followed by the Northeast (13.2 percent), the West (17.4 percent) and the South (18.3 percent). American Community Survey The national findings regarding median income and poverty rate are consistent between the CPS and the ACS. When examining localities of 250,000 or more residents, the 2004 American Community Survey shows the following results concerning income, poverty and earnings: Income For counties of 250,000 or more people in 2004, median household income ranged from $88,133 in Fairfax County, Va., to $24,778 in Hidalgo County, Texas. For cities of similar size, median household incomes ranged from $71,765 in San Jose, Calif., to $24,031 in Miami, Fla. Among the 37 counties with populations of 1 million or more in 2004, 32 experienced no statistically significant change in median household income from 2003 to 2004. Three counties (King, Wash.; Palm Beach, Fla.; and Philadelphia, Pa.) experienced declines; two counties (Fairfax, Va.; and Orange, Calif.) showed increase. Poverty Among counties with 250,000 or more people in 2004, poverty rates ranged from 2.6 percent in Johnson, Kan., to 43.6 percent in Hidalgo, Texas. Among places of a similar size, the poverty rates ranged from 7.4 percent for Anchorage, Alaska, to 33.6 percent for Detroit. Among the 37 counties with 1 million or more people in 2004, seven experienced changes in their poverty rates between 2003 and 2004. Of those seven, Broward, Fla., and Oakland, Mich., showed decreases, while Allegheny, Pa., Bronx, N.Y.; King, Wash.; Nassau, N.Y.; and Wayne, Mich., had increases. Among the nine cities of this size, New York, N.Y., saw its poverty rate rise, while poverty in the other places remained unchanged. Earnings Connecticut, Maryland, Massachusetts, New Jersey and the District of Columbia had among the highest median earnings for both men and women who worked full-time, year-round. In each of the 50 states and the District of Columbia, women’s earnings were less than men’s in 2004. The District of Columbia was the area with the greatest parity between men’s and women’s earnings. There, women earned 91 cents for every dollar that men earned. Earnings by Industry Among the 20 major industry sectors, men earned the most in 2004 in the management of companies and enterprises sector ($77,754). For women, there were five sectors where median earnings were about $40,000 or more: management of companies and enterprises ($41,608); mining ($41,516); professional, scientific and technical services ($41,398); utilities ($40,981); and information ($40,447). In each of the major industry sectors, men earned more than women. The sectors where the earnings gap between men and women was the largest were management of companies and enterprises, where women earned 54 cents for every dollar that men earned; finance and insurance (57 cents); and professional, scientific and technical services (60 cents). Earnings by Occupation Among the 22 major occupational groups, men earned the most in legal occupations, such as lawyers, judges and law clerks (more than $100,000). Among women, those in computer and mathematical occupations had the highest median earnings ($56,585). Among the major occupational groups, women’s earnings as a percentage of men’s earnings were about 90 percent or higher for the following groups: installation, maintenance and repair; community and social services; construction and extraction; and healthcare support. In contrast, women’s earnings as a percentage of men’s earnings were about 65 percent or less for legal occupations, sales and related occupations and healthcare practitioner and technical occupations. Estimates from the CPS ASEC may not match the estimates from the ACS because of differences in the questionnaires, data collection methodology, reference period, processing procedures, etc. Both are surveys and are subject to sampling and nonsampling errors. All comparisons made in the report have been tested and found to be statistically significant at the 90-percent confidence level, unless otherwise noted. For additional information on the CPS data, visit . For additional information on ACS data, visit . -X-
44
posted on
02/10/2007 2:58:42 AM PST
by
durasell
(!)
To: durasell
Short (more current) version:
In 2005, the poverty rates in the Northeast (11.3 percent) and the Midwest (11.4 percent) were not statistically different from each other. However, they were lower than the other two regions. Poverty rates for the South and the West were 14.0 percent and 12.6 percent, respectively. Both the poverty rate and the number in poverty remained stable in all regions between 2004 and 2005.
45
posted on
02/10/2007 3:01:18 AM PST
by
durasell
(!)
To: sauropod
46
posted on
02/10/2007 3:02:19 AM PST
by
hellinahandcart
(Rudy is so far to the left that we can pick up votes in Blue states)
To: darkangel82
No, don't you understand? They all so much smarter then us, and we's all hicks!
Arrogant liberal know-it-alls are pretty much indistinguishable from the Communist elite who were supposed to be so much better than the masses that they were the rightful leaders. No voting necessary.
If they could apply the Burger court's "one man, one vote" decision on State legislatures to the US Congress, we'd all be in Kulak re-education camps.
47
posted on
02/10/2007 4:39:16 AM PST
by
Cincinnatus.45-70
(Patriotism to DemocRats is like sunlight to Dracula.)
To: ProtectOurFreedom
I hate this whole red state and blue state bs. You know there might be the most conservative people in the blue state but they are already hated here because of the state they are frome. It does not make sense. We need to stop following this media desire to split conservatives. They cntinue to try. I could care less where someone is from as long as they are decent, conservative and nice people.
To: DuncanWaring
Yes, if the study had looked at counties rather than states, he would have come to a completely different conclusion. But then, that wouldn't have made his point.
49
posted on
02/10/2007 4:49:23 AM PST
by
TN4Liberty
(Sixty percent of all people understand statistics. The other half are clueless.)
To: napscoordinator
The blue states happen to be more prosperous at this point (and see a large percentage of their fed tax dollars sent to red states). So there is bound to be natural tension.
50
posted on
02/10/2007 4:51:01 AM PST
by
durasell
(!)
To: the808bass
I don't believe abortions was included in this number... Abortions are practices of a right, not a death of a child...to a Blue Stater.
Here's a good idea. In a Blue Dictatorship, what would be crimes and what wouldn't? Drug overdoses would be natural death. Perjury would be rewarded, as would adultery...ad nauseum.
51
posted on
02/10/2007 4:54:37 AM PST
by
Loud Mime
(“War’s very object is victory, not prolonged indecision." Gen Douglas Mac Arthur)
To: TN4Liberty
To: confederatetrappedinmidwest
I spent six months last year in Grand Rapids working, and the non-Detoilet part of the state actually seemed like a fairly decent place.
Didn't make it to Detoilet, but considering that they celebrate winning an NBA championship by trying to burn the city down, it's gotta be an absolute hellhole.
Too bad you can't just move to the UP and seceed.
53
posted on
02/10/2007 6:56:51 AM PST
by
DuncanWaring
(The Lord uses the good ones; the bad ones use the Lord.)
To: Nomad817
This is slightly off, but didn't they used to switch the state colors in elections like in '96 Dole was blue and Clinton was red etc, seems like we've really been stuck on the '00 election colors especially the media and thats how we're identifying them, will they ever change again?The colors never switched: blue always represented the incumbent and red always represented the challenger.
What switched was the party in office -- Gore was blue in 2000 because the Democrat party was incumbent as Clinton was the outgoing president.
But I still remember Reagan's re-election map.

54
posted on
02/10/2007 7:10:19 AM PST
by
libravoter
(Live from the People's Republic of Cambridge)
To: libravoter
Dennis Miller was reminiscing about the 1984 election and said, "I mean, Walter Mondale made George McGovern look like William the Conqueror."
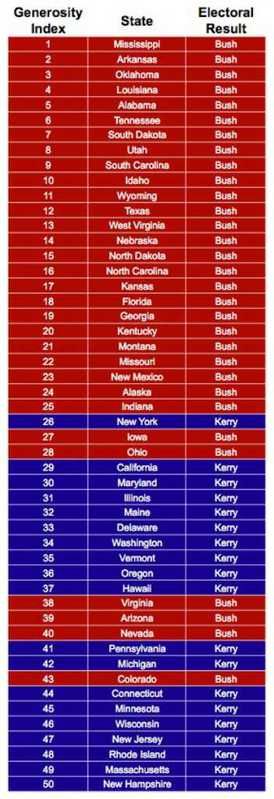
To: ProtectOurFreedom
Here is how the red/blue states rate as to how charitable they are.
56
posted on
02/10/2007 7:30:15 AM PST
by
Vision
("Delight yourself in the Lord; and he will give you your heart's desires." Psalm 37:4)
To: Jedi Master Pikachu; HiTech RedNeck
This isn't so much an illegal immigration issue. WHAT ? NOT AN IMMIGRATION ISSUE. EVERY ISSUE IS AN IMMIGRATION ISSUE.
57
posted on
02/10/2007 8:55:35 AM PST
by
staytrue
To: durasell
As defined by the Office of Management and Budget and updated for inflation using the Consumer Price Index, the average poverty threshold for a family of four in 2004 was an income of $19,307; for a family of three, $15,067; for a family of two, $12,334; and for unrelated individuals, $9,645. for unrelated individuals, a minimum wage $5.25 an hour job is above the poverty level.
58
posted on
02/10/2007 9:05:04 AM PST
by
staytrue
To: Vision
If you want to talk cheap, washington DC people are the cheapest.
59
posted on
02/10/2007 9:07:38 AM PST
by
staytrue
Navigation: use the links below to view more comments.
first previous 1-20, 21-40, 41-59 last
Disclaimer:
Opinions posted on Free Republic are those of the individual
posters and do not necessarily represent the opinion of Free Republic or its
management. All materials posted herein are protected by copyright law and the
exemption for fair use of copyrighted works.
FreeRepublic.com is powered by software copyright 2000-2008 John Robinson