Free Republic
Browse · Search
News/Activism
Topics · Post Article

Skip to comments.

BBC: 50 years on: The Keeling Curve legacy - ( CO2 -- Global Warming?)
BBC ^ | Sunday, 2 December 2007, 20:13 GMT | Helen Briggs Science reporter, BBC News

Posted on 12/02/2007 5:53:04 PM PST by Ernest_at_the_Beach

50 years on: The Keeling Curve legacy

By Helen Briggs


Science reporter, BBC News


Mauna Loa Curve (BBC)

It is a scientific icon, which belongs, some claim, alongside E=mc2 and the double helix.

Its name - the Keeling Curve - may be scarcely known outside scientific circles, but the jagged upward slope showing rising carbon dioxide (CO2) levels in the atmosphere has become one of the most famous graphs in science, and a potent symbol of our times.

It was 50 years ago that a young American scientist, Charles David Keeling, began tracking CO2 in the Earth's atmosphere at two of the world's last wildernesses - the South Pole and the summit of the Mauna Loa volcano in Hawaii.

His very precise measurements produced a remarkable data set, which first sounded alarm bells over the build-up of the gas in the atmosphere, and eventually led to the tracking of greenhouse gases worldwide.

The curve set the scene for the debate over climate change, and policies, sometimes controversial, that address the human contribution to the greenhouse effect.

Without this curve, and Professor Keeling's tireless work, there is no question that our understanding and acceptance of human-induced global warming would be 10-20 years less advanced than it is today

Dr Andrew Manning, UEA

"It wasn't until Keeling came along and started measuring CO2 that we got the evidence that CO2 was increasing from human activities," says Professor Andrew Watkinson, director of the Tyndall Centre for Climate Change Research at the University of East Anglia (UEA), UK.

"The graph is iconic from a climate perspective."

Dr Alistair Manning of the UK Met Office agrees. "It was the first real indication that CO2 levels were rising," he says. "That therefore started scientists thinking about the impact such a change would have on the climate."

'Tireless work'

Back in the 1950s, when Keeling began his experiments, no-one knew whether the CO2 released from the burning of fossil fuels (coal, oil/petroleum and natural gas) would end up in the atmosphere or be fully absorbed by oceans and forests.

Charles David Keeling at the Scripps in the 1990s (SPL)
Keeling had to work hard to justify his work

"The goal behind starting the measurements was to see if it was possible to track what at that time was only a suspicion: that atmospheric CO2 levels might be increasing owing to the burning of fossil fuels," explains biogeochemist Dr Andrew Manning, also from the UEA, who worked with Professor Keeling in the 1990s.

"To do this, a location was needed very far removed from the contamination and pollution of local emissions from cities; therefore Mauna Loa, high on a volcano in the middle of the Pacific Ocean was chosen.

"Without this curve, and Professor Keeling's tireless work, there is no question that our understanding and acceptance of human-induced global warming would be 10-20 years less advanced than it is today," adds Dr Manning.

Sleepless nights

Professor Keeling discovered that carbon dioxide was rising continuously and that there were annual fluctuations in carbon in the atmosphere (the little squiggles on the line), caused by seasonal variations in plant growth and decay.

When he started his measurements in 1958, CO2 levels were around 315 ppmv (parts per million by volume - that is 315 molecules of CO2 for every one million molecules in the air); by the year 2005 they had risen to about 378 ppmv.

Yet despite the importance we place on climate change research today, Professor Keeling, known as Dave to friends and colleagues, struggled to secure funding for his monitoring efforts.

Artist's rendition of greenhouse gases (SPL)
The work focussed attention on the impact of greenhouse emissions

"Dave Keeling suffered many sleepless nights, even as late as in the 1990s, being forced again and again to justify continued funding of his programme," recalls Dr Manning.

"The fact that we are celebrating 50 years now is due purely to his incredible perseverance, courage and optimism."

He says the technical, analytical and logistical challenges of the work are enormous.

"To measure such tiny changes in the composition of the air, high on a remote mountain top in the middle of the Pacific Ocean is extremely challenging even today in the 21st Century," he explains.

"That Dave Keeling was able to successfully begin and continue such highly demanding measurements in the 1950s is a tribute to his brilliance."

Detailed monitoring

Today, carbon dioxide levels are sampled weekly at about 100 sites around the world.

Flasks filled with air are taken to a laboratory, where they are analysed for carbon dioxide, other greenhouse gases and pollutants.

Aircraft collect similar samples at higher altitude, while space-borne sensors detect some gases remotely throughout the atmosphere.

Mauna Loa (Noaa)

Monitoring efforts continue atop the Mauna Loa volcano

"Without the fifty-year carbon dioxide record, we wouldn't understand the cause of the climate change we are observing today," says James Butler, deputy director of The National Oceanic and Atmospheric Administration (Noaa) Earth System Research Laboratory.

"The carbon dioxide record has allowed us to connect the dots between increasing fossil fuel emissions and a warmer world."

Charles Keeling died in 2005, aged 77. He continued his research into carbon dioxide at the Scripps Institution of Oceanography in San Diego, US, until his final day.

By then he had authored nearly 100 research articles and had received the National Medal of Science - the US's highest award for lifetime achievement in scientific research.

His son, Professor Ralph Keeling, also a geochemist at Scripps, continues his work.

TIMELINE: carbon monitoring

1957: Charles David Keeling starts work monitoring CO2 at the South Pole and Mauna Loa Observatory, Hawaii

1958: Keeling starts first direct continuous atmospheric measurements of CO2

Early 1970s: Noaa, the US federal agency, starts monitoring CO2 worldwide

1995-2003: Noaa's Earth System Research Laboratory (ESRL) at Boulder, Colorado, develops and maintains the world's standard references for CO2 and other greenhouse gases


TOPICS: Extended News; News/Current Events
KEYWORDS: agw; climatechange; globalwarming
Navigation: use the links below to view more comments.
first previous 1-2021-4041-52 next last
To: Enchante
Also worth pointing out is that the energy forcing effect of CO2 (in W/m^2) is proportional to the logarithm of the concentration.
21 posted on 12/02/2007 8:12:42 PM PST by chipengineer
[ Post Reply | Private Reply | To 19 | View Replies]

To: Ernest_at_the_Beach

ALL The while ignoring the fact that all mammals exhale CO2 when they breathe. How clever Ethyl! Way to go!


22 posted on 12/02/2007 8:57:50 PM PST by Waco
[ Post Reply | Private Reply | To 1 | View Replies]

To: BOBTHENAILER
Goron's Crazy Loony Tune's Club Band

LOL!!!

23 posted on 12/02/2007 9:05:18 PM PST by Ernest_at_the_Beach (No Burkas for my Grandaughters!)
[ Post Reply | Private Reply | To 12 | View Replies]

To: Enchante
That graph is MANIPULATED to make the change appear extremely steep, .... That graph is a piece of political propaganda, not science.

'zactly

24 posted on 12/03/2007 12:08:12 AM PST by TheFreeperFormerlyKnownAs
[ Post Reply | Private Reply | To 19 | View Replies]

To: E. Pluribus Unum

The current average global temperature is around 17 degrees, C, right?


25 posted on 12/03/2007 7:32:07 AM PST by dangus
[ Post Reply | Private Reply | To 6 | View Replies]

To: NDNBill

your link is bad. Can you fix it?


26 posted on 12/03/2007 7:36:20 AM PST by dangus
[ Post Reply | Private Reply | To 20 | View Replies]

To: Diogenesis

Seems dust leads both the temp and CO2.

The nore dust, the less CO2 and the lower the temp.

Should we add more dust in the wind


27 posted on 12/03/2007 8:10:57 AM PST by Old Professer (The critic writes with rapier pen, dips it twice, and writes again.)
[ Post Reply | Private Reply | To 3 | View Replies]

To: Ernest_at_the_Beach

“Though Mauna Loa is an active volcano, Keeling and collaborators made measurements on the incoming ocean breeze and above the thermal inversion layer to prevent local contamination. In addition, measurements at many other isolated sites have confirmed the long-term trend, though no sites have a record as long as Mauna Loa.”
http://en.wikipedia.org/wiki/Keeling_Curve


28 posted on 12/03/2007 8:11:07 AM PST by chessplayer
[ Post Reply | Private Reply | To 1 | View Replies]

To: ClearCase_guy
1) Human activities are the cause.

There is little room for doubt about this fact. There are multiple types of data, and analyses of such data, that indicate it is an accurate statement.

29 posted on 12/03/2007 9:11:51 AM PST by cogitator
[ Post Reply | Private Reply | To 9 | View Replies]

To: Nathan Zachary
Brilliant. Put a measuring station on top of a volcano that spews millions of tons of co2 into the air, then blame it on humans burning "fossil" fuels.

Volcanoes don't product that much CO2, and degassing events that affect the ongoing monitoring are easily diagnosed based on meteorological factors and the actual record of the event.

30 posted on 12/03/2007 9:13:37 AM PST by cogitator
[ Post Reply | Private Reply | To 11 | View Replies]

To: cogitator
There is little room for doubt about this fact.

I think there is a huge amount of doubt about that statement!

31 posted on 12/03/2007 9:19:41 AM PST by Ernest_at_the_Beach (No Burkas for my Grandaughters!)
[ Post Reply | Private Reply | To 29 | View Replies]

To: cogitator
Look at Post #7, the last graph, showing levels of CO2 over time. It fluctuates in a consistent pattern that has nothing to do with human activity, as much of this graph covers time prior to man's industrialization.

Proof that the rise is not due to man? No.
Reasonable doubt? You bet.

32 posted on 12/03/2007 10:22:06 AM PST by ClearCase_guy (The broken wall, the burning roof and tower. And Agamemnon dead.)
[ Post Reply | Private Reply | To 29 | View Replies]

To: xcamel

Good article: Marxism at the core of global warming movement:

http://www.tennessean.com/apps/pbcs.dll/article?AID=/20071202/COLUMNIST0130/712020382/1007/OPINION


33 posted on 12/03/2007 10:30:04 AM PST by rightinthemiddle (Without the Media, the Left and Islamofacists are Nothing.)
[ Post Reply | Private Reply | To 2 | View Replies]

To: ClearCase_guy; Ernest_at_the_Beach
It's always surprising to me that some people think there is doubt about the anthropogenic cause of the currently-observed rise in atmospheric CO2 concentrations (what the Keeling curve displays). I don't even include this in my profile because there are so many other good sources on the Web that address this subject. Below are five different links on this subject. If you think there's doubt after perusing these links... well, then you could never be convinced that it gets darker at night based on arguments that the Sun is not visible then.

The first one, from 1996, dates back to the heyday of Usenet, and contains an itemized list of various types of evidence. I have used some of these points in different FR discussions.

Why does atmospheric CO2 rise ?

"The CO2 rise is natural"

How do we know that recent CO2 increases are due to human activities?

How Do We Know that the Atmospheric Build-up of Greenhouse Gases Is Due to Human Activity?

Ice Bubbles Reveal Biggest Rise in CO2 for 800,000 Years

Reasonable doubt? You bet.

Maybe O.J. didn't murder Nicole and Ronald Goldman, either.

34 posted on 12/03/2007 11:04:03 AM PST by cogitator
[ Post Reply | Private Reply | To 32 | View Replies]

To: BohDaThone
So, it's no good saying that man isn't causing the rise in the CO2 level in the atmosphere.

Actually one of the biggest problems for the AGW proponents is the rise in CO2 is too linear

As you can see, The rise has been steady at about +1.5 ppmv per year (15 ppmv per decade)

However, if you look at the world's CO2 output

the emissions have of course been increasing

So the question is why is the rise in CO2 levels per year staying linear? As emissions increased you should see the rate of the increase (the Slope) in CO2 levels per year in the atmosphere also increase.

For example, if pumping out 4000 million tons of CO2 1970 caused the rise of 1.5 ppmv atmospheric CO2, then you would expect that in the year 2000 when we pumped out 7000 million tons of CO2, the atmospheric level should have rose about 26 ppmv that year. But they didn't, it's been holding steady at +1.5ppmv

Here are the actual numbers on the change per year

From Baring Head in New Zealand where the results are nearly the same as Manua Kea they have a nice plot

as you can see there just isn't any trend or correlation between human emissions and rise in CO2. If humans were responsible, the trend would be every year having a bigger rise than the previous one, but instead the rise goes up & down randomly with no tread at all

The reason is obvious, 4000 million tons or 7000 million tons put out by man are both insignificant compared to natural emissions and the rise in CO2 has to be coming from somewhere else. Even 7000 million tons is barely a blip on the seasonal differences.

35 posted on 12/03/2007 12:23:39 PM PST by qam1 (There's been a huge party. All plates and the bottles are empty, all that's left is the bill to pay)
[ Post Reply | Private Reply | To 13 | View Replies]

To: Nathan Zachary
Well, the HI surveillance station is uphill and upwind of the lava flows down near the coast ...

What amazing is that the spring-summer and fall dips in CO2 from plant growth over the summer are so visible: Yes, CO2 is increasing.

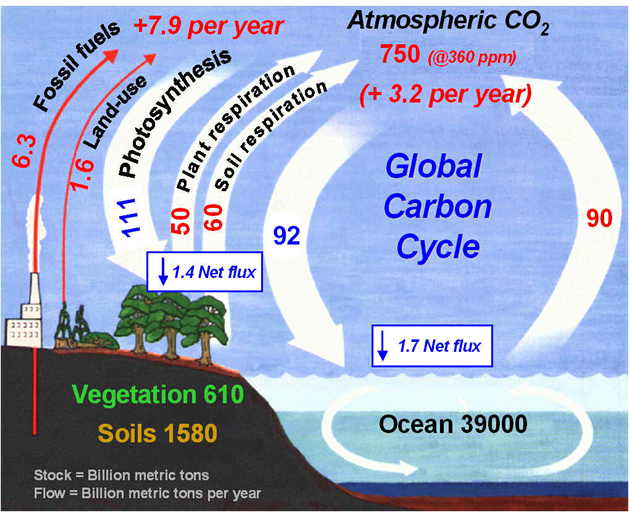
Now, where have they actually showed that the 8 billion tons of carbon (25-odd billion tons of CO2) are accounting for the minor change in CO2 in the earth’s atmosphere each year?

36 posted on 12/03/2007 12:24:09 PM PST by Robert A Cook PE (I can only donate monthly, but Hillary's ABBCNNBCBS continue to lie every day!)
[ Post Reply | Private Reply | To 11 | View Replies]

To: ClearCase_guy
I’m willing to concede CO2 is increasing from human activities, but absolutely have seen no evidence that increased CO2 is causing measurable temperature changes.

And, in fact, the evidence gets less each year that increased CO2 is affecting temperate.

37 posted on 12/03/2007 12:27:04 PM PST by Robert A Cook PE (I can only donate monthly, but Hillary's ABBCNNBCBS continue to lie every day!)
[ Post Reply | Private Reply | To 9 | View Replies]

To: Robert A. Cook, PE
Now, where have they actually showed that the 8 billion tons of carbon (25-odd billion tons of CO2) are accounting for the minor change in CO2 in the earth’s atmosphere each year?

The summary of several different methods for accounting for natural and anthropogenic fluxes is shown below. (Methods differ for measuring fluxes on land and in the ocean, for example.) There are other versions of this type of diagram, from various sources and with minor alterations of the numbers. In essence, natural sources and sinks operating alone would add up to a net sink. So the reason for the increase is human activities. Evaluation of insignificance requires non-naive understanding of the interaction of dynamically-linked parameters.

The diagram below is half-size; if you really need to see it full-size, click on it.


38 posted on 12/03/2007 1:26:10 PM PST by cogitator
[ Post Reply | Private Reply | To 36 | View Replies]

To: qam1
Sharp rise in CO2 levels recorded

"The research indicates that 2005 saw one of the largest increases on record - a rise of 2.6ppm."

7000/4000 x 1.5 = 2.6

You may have dropped a decimal point.

As you can see, The rise has been steady at about +1.5 ppmv per year.

Apparently this has changed recently.

"The chief carbon dioxide analyst for NOAA says the latest data confirms a worrying trend that recent years have, on average, recorded double the rate of increase from just 30 years ago."

39 posted on 12/03/2007 1:35:11 PM PST by cogitator
[ Post Reply | Private Reply | To 35 | View Replies]

To: Robert A. Cook, PE
but absolutely have seen no evidence that increased CO2 is causing measurable temperature changes.

I started to make a snide remark, but stopped. The WG1 IPCC report is all about that evidence. It is, to phrase it legally, a cumulative body of evidence.

What type of data or evidential argument would influence you to accept that significantly changing the radiative adsorption/transmission properties of the atmosphere would likely affect the temperature at the surface of the Earth? Because that in essence is what is occurring. Increasing CO2 concentrations in the atmosphere must alter the radiative absorption/transmission properties of the atmosphere.

40 posted on 12/03/2007 1:41:24 PM PST by cogitator
[ Post Reply | Private Reply | To 37 | View Replies]


Navigation: use the links below to view more comments.
first previous 1-2021-4041-52 next last

Disclaimer: Opinions posted on Free Republic are those of the individual posters and do not necessarily represent the opinion of Free Republic or its management. All materials posted herein are protected by copyright law and the exemption for fair use of copyrighted works.

Free Republic
Browse · Search
News/Activism
Topics · Post Article

FreeRepublic, LLC, PO BOX 9771, FRESNO, CA 93794
FreeRepublic.com is powered by software copyright 2000-2008 John Robinson