Posted on 05/31/2010 7:16:45 AM PDT by SoFloFreeper
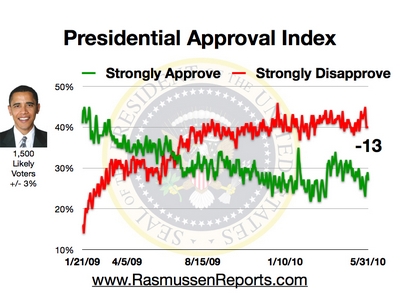
The Rasmussen Reports daily Presidential Tracking Poll for Monday shows that 27% of the nation's voters Strongly Approve of the way that Barack Obama is performing his role as president. Forty percent (40%) Strongly Disapprove, giving Obama a Presidential Approval Index rating of -13
(Excerpt) Read more at rasmussenreports.com ...
I didn't think Ras would do a poll today. Nice to see BO going back to where he belongs...
We’d be better off as a nation if 46% of voters were dropped in the Gulf of Mexico to plug the damn hole.
Still seems way too high in my opinion.
Interesting data on obamacare too:
“Sixty percent (60%) favor repeal of the nation’s new health care law. Sixty-two percent (62%) believe the law will increase the federal budget deficit, 58% say it will raise cost of care, and 51% think it will hurt the quality of care. “
Also — I don’t think Rasmussen is polling today. My guess is that the polls are conducted the previous day, since they tend to be posted first thing in the morning, so it’s posted on 5/31, but conducted on 5/30 — it’s only 7 am on the West Coast now.
“Still seems way too high in my opinion.”
I would agree with that.
Rassy must have got another phone call.
Still popular with people who in the last ten minutes said “Yo, bitch” or “Like, OMG, Lauren on ‘The Hills’ is like so amazin. Know what I mean? Like, I dunno.”
That makes 3 of us!
The “strongs” can be fickle. Basically, people are going from Strong Disapprove to Disapprove.
There’s a psychological aversion to Strong Disapprove which some people associate with “hate”, but I think the real story here is that Ras had a couple of off polling days that will roll off and Obama’ll be back around -16 soon enough.
Statistically speaking, both “strongs” are sensitive to even small errors in polling. It’s not Ras’s fault, one out of every twenty polls is a dud with big samples. With small samples, it’s even more frequent. The three-day rolling average is supposed to iron them out.
He had climbed back up to minus 10 or 11 so the current trend is in the right direction. I think a lot of people were sold on the top-kill working, and they helped his poll numbers. After that epic fail his numbers are heading lower once again. If this mess continues till August, I think he will be minus thirty, and the GOP will take the Senate as well as the House come November.
I’ll be satisfied when he hits -50 (African American & career welfare bots vs. workers). Something like 75% productive Americans disapprove vs. 25% food stamp gang approve.
Who pissed in your wheaties? Meaningful or not, I would rather see his poll numbers going down than up.
He was at -22 last week.
Damn, you are obsessed aren’t you?
I agree. As I interpret it, there are 27% of voters who are committed Leftist and 19% who are useful idiots. Sprinkled generously throughout each group are a number of people who don't know and don't care but just want their government-provided stuff.
>> Statistically speaking, both “strongs” are sensitive to even small errors in polling. It’s not Ras’s fault, one out of every twenty polls is a dud with big samples. With small samples, it’s even more frequent. <<
Good explanation! Needs to be pointed out time and again, since so many readers of the daily “Rasmussen thread” here on FR have no background in statistics.
>> The three-day rolling average is supposed to iron them out <<
Yeah, but I think “supposed” is the critical word:
We’ve seen time and again that unfortunately, just one night’s “severely out of range” poll results can contaminate Ras’s reports for three days’ running.
In this regard for example, last week there were three consecutive days’ worth of “Index” values that seemed too low for any logical explanation, followed by three days of numbers that were way too high. Therefore, I believe a ten-day moving average (or something like it) is a much more reliable indicator of the true state of public opinion.
Today, the ten-day average stands at -15.4. That’s higher than I had been expecting, since last week it got down to -17. At this point, it’s probably best to say only that the “true, underlying” value of the Rasmussen Index is in the range of -15 to -17. And in my book, such a value is just plain excellent!
By the way, speaking of averages, we can now see that the average for the month of May was -13.5, which is a marked improvement over the average value of -10.9 we suffered for the month of April. So the good news continues to roll in!
Thanks for the applied science. :)
Disclaimer: Opinions posted on Free Republic are those of the individual posters and do not necessarily represent the opinion of Free Republic or its management. All materials posted herein are protected by copyright law and the exemption for fair use of copyrighted works.