
Posted on 08/17/2010 10:42:34 AM PDT by Ernest_at_the_Beach
Just when you think it’s too dead to kill: along comes a new paper in a top ranking statistics journal by McShane and Wyner. It’s worth taking stock. It’s a damning paper:
…we conclude unequivocally that the evidence for a ”long-handled” hockey stick (where the shaft of the hockey stick extends to the year 1000 AD) is lacking in the data.
…
But in the big scheme of things the Hockey Stick Graph was already dead.
FIG 16. Backcast from Bayesian Model of Section 5. CRU Northern Hemisphere annual mean land temperature is given by the thin black line and a smoothed version is given by the thick black line. The forecast is given by the thin red line and a smoothed version is given by the thick red line. The model is fit on 1850-1998 AD and backcasts 998-1849 AD. The cyan region indicates uncertainty due to t, the green region indicates uncertainty due to β, and the gray region indicates total uncertainty.
It is not clear that the proxies currently used to predict temperature are even predictive of it at the scale of several decades let alone over many centuries.
As I said back in December, one of the landscape shifting forces about ClimateGate was that it suddenly motivated skeptics, imbuing them with conviction and energy, because it triggered off the universal warning lights that the freeloaders and parasites were at work, playing on our good intentions. Prior to this many smart incisive people were busy and otherwise occupied. Now these movers and shakers are being pulled into the debate, and the climate establishment can no longer get away with their schtick.
Because there were no Climate Science au Naturale Institutes that had an interest in busting the CAGW hypothesis, inept, inadequate work which supported the fashionable theory was allowed to stand for years. The institutes whose funding depended on the Big Scare Campaign did not hire expert statisticians to try to check their own work, and expert statisticians, for the most part, had other things to do than to check papers in an obscure branch of science. Determined volunteers like Steven McIntyre moved in, exposing major flaws, and now finally the world of expert statistics is waking up to the fact that there are nice openings thank-you-very-much for posting papers in top journals, just be redo-ing the work of climate scientists.
Who knows exactly what motivated McShane and Wyner, or when they started investigating, but the arrival of other science related experts into this debate is not a day too soon.
For ten years mediocre scientists have been able to get away with poor work, and have been given the red-carpet (and the odd Nobel Peace Prize). That time is over.
McShane:
“The panel found that the statistical tools that CRU scientists employed were not always the most cutting-edge, or most appropriate. “We cannot help remarking that it is very surprising that research in an area that depends so heavily on statistical methods has not been carried out in close collaboration with professional statisticians,” reads the inquiry’s conclusions.
So it goes, McIntyre, McKitrick,and now McShane: Perhaps one day someone will figure out why the Scottish Y chromosomal inheritance is so adept and determined at statistically destroying government funded science. (No doubt Monckton-the-Scot has a view on that.)
Mcshane, B.B. and Wyner, A. J.: A Statistical Analysis Of Multiple Temperature Proxies: Are Reconstructions Of Surface Temperatures Over The Last 1000 Years Reliable? Submitted to the Annals of Applied Statistics
As a mathematician, this one got my attention. This is just bad math all around. There is no reason to do this.
BREAKING: New paper makes a hockey sticky wicket of Mann et al 98/99/08 (RE:Global Warming Hoax )
Joanne does a terrific job of structing Headlines and Graphics to shed light on a story....
Do check out the comments at her website.
Everyone was so excited when the East Anglia CRU emails were released, because they provided immediate fodder for attacking the global warmists.
But some of us realized that the true power of the release was in the data and methodologies that were exposed.
Open to the light of day, it’s clear that these clowns were scamming us. Their “science”, not so much their emails, proves it. (The emails did prove how hard they worked to cover up their shoddy “science”.)
Great article. Thanks for posting it!
If I understand this correctly, they attempted to do principal component analysis with more covariates than independent observations. This isn't even possible unless you re-jigger your covariance matrix to make it positive semi-definite, which may throw off your results.
of structuring
Any way to reasonable explain or link to tutorials for anyone that might be interested?
bttt
Fraudulent hockey sticks and hidden data
*************************************EXCERPT***************************************
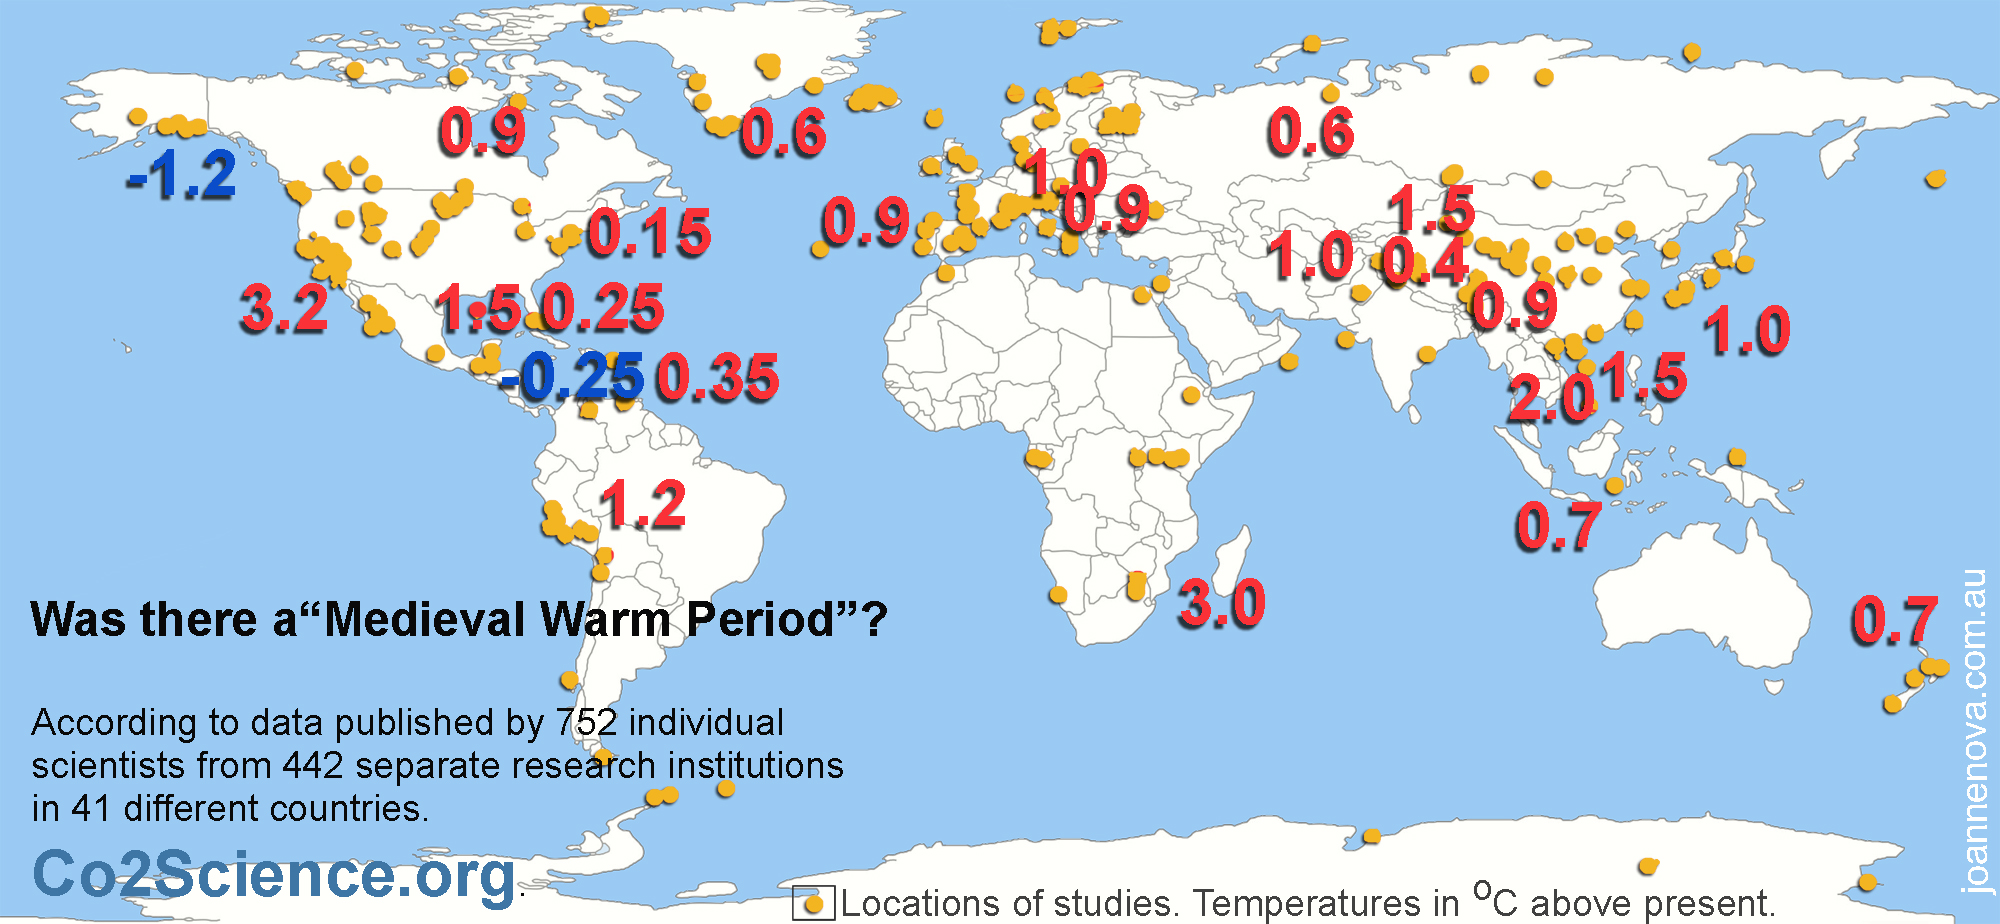
It’s clear that the world was warmer during medieval times. Marked on the map are study after study (all peer-reviewed) from all around the world with results of temperatures from the medieval time compared to today. These use ice cores, stalagmites, sediments, and isotopes. They agree with 6,144 boreholes around the world which found that temperatures were about 0.5°C warmer world wide.
What follows is a sordid tale of a graph that overthrew decades of work, conveniently fitted the climate models, and was lauded triumphantly in glossy publication after publication. But then it was crushed when an unpaid analyst stripped it bare. It had been published in the highest most prestigious journal, Nature, but no one had checked it before or after it was spread far and wide. Not Nature, not the IPCC, not any other climate researcher.
In 1995 everyone agreed the world was warmer in medieval times, but CO2 was low then and that didn’t fit with climate models. In 1998, suddenly Michael Mann ignored the other studies and produced a graph that scared the world — tree rings show the “1990s was the hottest decade for a thousand years”. Now temperatures exactly “fit” the rise in carbon! The IPCC used the graph all over their 2001 report. Government departments copied it. The media told everyone.
But Steven McIntyre was suspicious. He wanted to verify it, yet Mann repeatedly refused to provide his data or methods — normally a basic requirement of any scientific paper. It took legal action to get the information that should have been freely available. Within days McIntyre showed that the statistics were so flawed that you could feed in random data, like stock prices, and still make the same hockey stick shape nine times out of ten. Mann had left out some tree rings he said he’d included. If someone did a graph like this in a stock prospectus, they would be jailed.
Astonishingly, Nature refused to publish the correction. The correction was published elsewhere, and backed up by the Wegman Report, an independent committee of statistical experts.
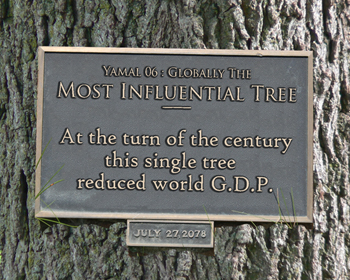
In 2009 McIntyre did it again with Briffa’s Hockey Stick. After asking and waiting three years for the data, it took just three days to expose it too as baseless. For nine years Briffa had concealed that he only had 12 trees in the sample from 1990 onwards, and that one freakish tree virtually transformed the graph. When McIntyre graphed another 34 trees from the same region of Russia, there was no Hockey Stick.
The sharp upward swing of the graph was due to one single tree in Yamal. Epic cherry-picking!
Skeptical scientists have literally hundreds of samples. Unskeptical scientists have one tree in Yamal, and a few flawed bristlecones…
It was an audacious fraud.
Climate models don’t know why it was warmer 800 years ago.
The models are wrong.
HOKEY SHTICK............
Dude! Is that even legal?
****************************EXCERPT**********************************
Principal component analysis (PCA) involves a mathematical procedure that transforms a number of possibly correlated variables into a smaller number of uncorrelated variables called principal components.
OK,...looking at the Wiki ...so nevermind on Explanation.
Thanks for posting. BTTT!
A good non-technical explanation is the book THE HOCKEY STICK ILLUSION by A. W. Montford. The author describes the efforts of McIntyre and McKitrick to get the data Mann used to create the "hockey stick," and their analysis of what's wrong with it.
I used to do a lot of work with Principal Components Analysis, so I was particularly fascinated by the discussion of how Man misused that technique.
Excellent article. She’s pretty sassy. In a smart way.
I really like what she does....with articles.
You summed it up best with your brief statement:
“Climate models don’t know why it was warmer 800 years ago.....The models are wrong.”
Ergo, how can the “models” be accepted as “evidence”. They can’t be.
Good work (bringing this new item of research onto FreeRep). Keep it up.
that’s gonna leave a mark - statistically that is....
Disclaimer: Opinions posted on Free Republic are those of the individual posters and do not necessarily represent the opinion of Free Republic or its management. All materials posted herein are protected by copyright law and the exemption for fair use of copyrighted works.
