Skip to comments.
About That "Expected" Drop In Labor Participation Rates
Townhall.com ^
| October 9, 2012
| Mike Shedlock
Posted on 10/09/2012 2:31:33 PM PDT by Kaslin
Calculated Risk had an interesting but misleading post A decline in the participation rate was expected due to the aging population.
This decline in the participation rate has been expected for years. Here are three projections (two from before the recession started). The key to these projections is that the decline in the participation rates was expected:
1) From BLS economist Mitra Toossi in November 2006: A new look at long-term labor force projections to 2050
2) From Austin State University Professor Robert Szafran in September 2002: Age-adjusted labor force participation rates, 1960–2045
3) BLS economist Mitra Toossi released some new projections for the participation rate as of January 2012: Labor force projections to 2020: a more slowly growing workforce.
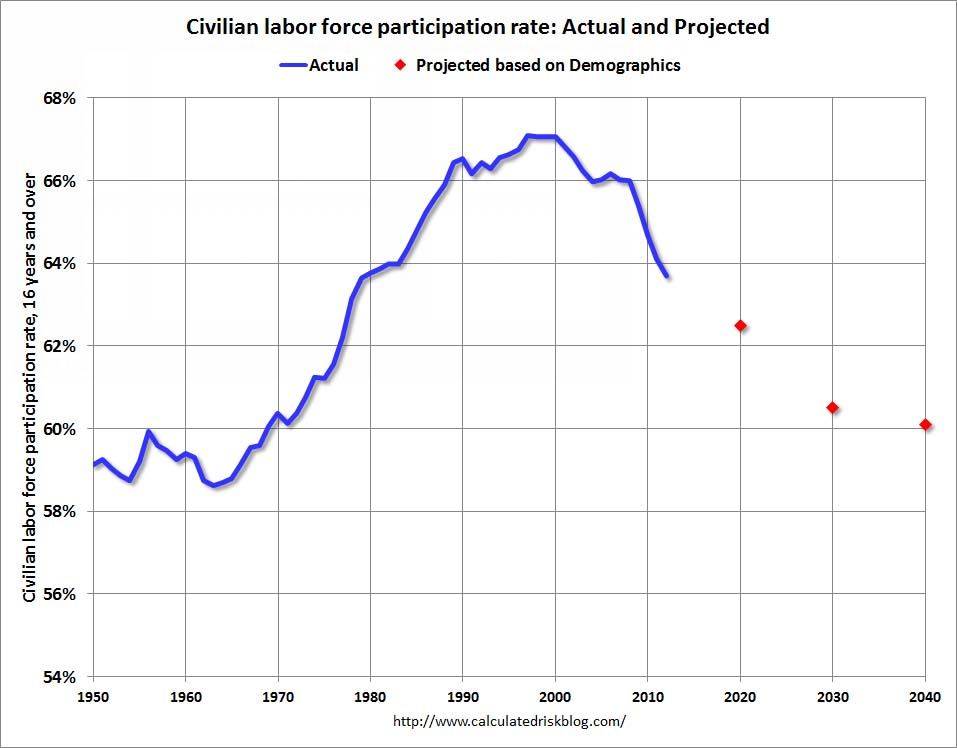
Misleading Chart
Yes, a decline in the participation rate was expected. My problem with his analysis regards the miss-portrayal of the rate at which the participation rate was scheduled to happen.
Calculated Risk posted this chart.

The above chart was created in 2012 and does not remotely match demographic projections made earlier.
For example, Robert Szafran estimated in September of 2002 the participation rate pattern would look like this.
| Year |
Participation Rate |
| 2005 |
66.8 |
| 2010 |
65.9 |
| 2015 |
64.6 |
| 2020 |
63.0 |
In September 2005 the participation rate was 66.1. In September of 2010, the participation rate was 64.6 which Szafran did not expect until 2015. The current participation rate is 63.6, a number Szafran expected in 2019 perhaps.
BLS analysis was much worse even though the BLS had more years of data to consider.
BLS Analysis
Let's take a look at BLS projections made in 2006.
| Year |
Participation Rate |
| 2010 |
65.9 |
| 2020 |
64.5 |
| 2030 |
61.7 |
Let's look at BLS labor force projections, also from 2006. Numbers in thousands.
| Year |
Labor Force |
Projected Increase |
| 2005 |
149,320 |
|
| 2010 |
156,511 |
7,191 |
| 2020 |
166,355 |
9,844 |
| 2030 |
172,910 |
6,555 |
Taking demographics into consideration, the BLS projected the labor force to grow by 7.19 million to 156.51 million in 2010. The actual labor force in September of 2010 was 153.92 million, a nice fat miss of 2.59 million.
Indeed, two years later, the labor force is still only 155.06 million.
So, the decline in participation rate was certainly not expected as Calculated Rick states in bold. It only appears that way, based on after-the-fact BLS analysis starting with chart that shows new baseline projections made in January of 2012.
By the way, if the current participation rate was 64.6 (the number Szafran expected in 2015, and essentially the the number the BLS originally estimated for 2020), the labor force would be roughly 157.44 million, not 155.06 million. The unemployment rate would be 9.2%.
In January 2008 the participation rate was 66.2. It is now 63.6 (a number way lower than Szafran expected for 2015).
Conclusion: While the Participation Rate trend is certainly down, and down was expected, most of the decline in participation rate since the start of the recession is due to economic weakness, not demographics.
For further discussion please see ...
TOPICS: Business/Economy; Culture/Society; Editorial; Politics/Elections
KEYWORDS: expected; expectedunexpected; unexpected; unexpectedexpected
1
posted on
10/09/2012 2:31:36 PM PDT
by
Kaslin
To: Kaslin
If true, the conclusion not the study, then we should have full employment as fewer people are available to fill more jobs.
2
posted on
10/09/2012 3:51:19 PM PDT
by
BillT
(If you can not stand behind our military, you might as well stand in front of them!)
To: Kaslin
Now wait just a moment, please explain to me, was this an unexpected labor participation rate event that was expected? Or was this an expected labor participation rate event which was unexpected??
/s
3
posted on
10/09/2012 3:54:52 PM PDT
by
SteveH
(First they ignore you. Then they laugh at you. Then they fight you. Then you win.)
To: SteveH
Did the population just suddenly “age” last quarter?
4
posted on
10/09/2012 3:59:52 PM PDT
by
uncitizen
To: uncitizen
After 4 years of Obama, I feel 10 years older and 15 years poorer.
5
posted on
10/09/2012 4:46:51 PM PDT
by
festusbanjo
(Nov 2012 is a battle between those who love freedom and those who love free stuff.)
To: festusbanjo
Hehe you make an rip excellent point!
6
posted on
10/09/2012 4:56:13 PM PDT
by
uncitizen
To: festusbanjo; uncitizen
Woops, I have no idea how that “rip” got in there. I swear it wasn’t me ;)
7
posted on
10/09/2012 4:57:36 PM PDT
by
uncitizen
To: festusbanjo
After 4 years of Obama, I feel 10 years older and 15 years poorer. Well the unspoken mission of the Death Panels is to fix Social Security and Medicare financials....
8
posted on
10/09/2012 5:03:39 PM PDT
by
nascarnation
(Defeat Baraq 2012. Deport Baraq 2013)
Disclaimer:
Opinions posted on Free Republic are those of the individual
posters and do not necessarily represent the opinion of Free Republic or its
management. All materials posted herein are protected by copyright law and the
exemption for fair use of copyrighted works.
FreeRepublic.com is powered by software copyright 2000-2008 John Robinson