
Posted on 10/29/2014 1:07:35 PM PDT by Kaslin
Here's an interesting article thanks to Jed Kolko, Chief Economist at Trulia Trends via Washington Post Wonkblog: The most expensive housing markets in the U.S. are also the most liberal.
The relationship between housing affordability and politics in the US is startlingly strong as these charts by Jed Kolko shows.
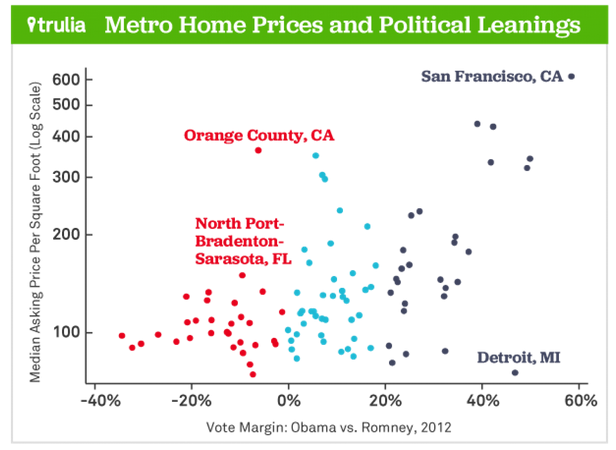
Median asking price in dollars per square foot is on the vertical axis. Margin for Obama over Romney in the 2012 election is on the horizontal axis.
With the exception of Orange County California, all of the high priced counties voted for Obama.
The Washington Post notes ....
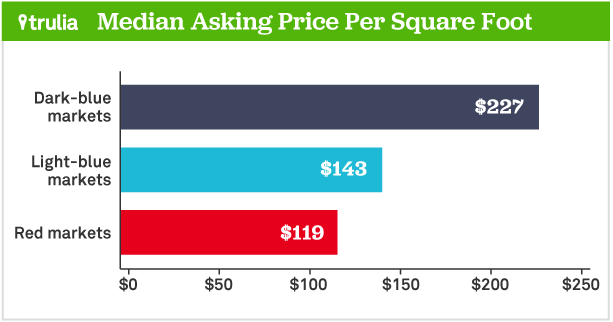
Nine of the 10 bluest markets had median home asking prices above $130 per square foot. All of the 10 reddest markets had prices below that. In the dark blue markets, housing cost almost twice as much ($227 per square foot) as in the red ones ($119). In metro Washington — this is not just the District — the average home asking price was about $177.
Trulia notes ...
Households in blue markets tend to have higher incomes. But those higher incomes are not enough to offset higher home prices. Our middle-class affordability measure, which reflects the share of homes for sale within reach of a median-income household, is significantly lower in bluer markets. Furthermore, blue markets have lower homeownership and greater income inequality than red markets.
Sorted Data
Trulia made the data available. I sorted by price per square foot high to low. Here are the results.
| U.S. Metro | Vote margin: Obama vs Romney, 2012 (positive #s = blue markets; negative #s = red markets) | Price decline in housing bust, peak to trough (FHFA) | Year-over-year price change, Sept. 2014 (Trulia) | Median asking price per square foot, $, Oct. 2014 (Trulia) |
|---|---|---|---|---|
| San Francisco, CA | 58% | -23% | 9.9% | 613 |
| Honolulu, HI | 39% | -11% | 4.1% | 439 |
| San Jose, CA | 42% | -26% | 8.6% | 430 |
| Orange County, CA | -6% | -33% | 4.8% | 363 |
| Long Island, NY | 6% | -20% | 2.9% | 350 |
| Oakland, CA | 50% | -39% | 11.9% | 342 |
| Los Angeles, CA | 42% | -35% | 6.9% | 334 |
| New York, NY-NJ | 49% | -18% | 4.3% | 320 |
| Ventura County, CA | 7% | -39% | 12.4% | 305 |
| San Diego, CA | 8% | -35% | 1.8% | 296 |
| Fairfield County, CT | 11% | -21% | -0.5% | 237 |
| Middlesex County, MA | 27% | -13% | 7.8% | 236 |
| Boston, MA | 25% | -17% | 4.5% | 229 |
| Peabody, MA | 16% | -18% | 4.0% | 212 |
| Seattle, WA | 35% | -26% | 8.9% | 197 |
| Bethesda-Rockville-Frederick, MD | 34% | -22% | 2.6% | 189 |
| Sacramento, CA | 9% | -48% | 10.1% | 188 |
| Edison-New Brunswick, NJ | 3% | -22% | 6.2% | 180 |
| Miami, FL | 24% | -47% | 14.0% | 180 |
| Washington, DC-VA-MD-WV | 37% | -25% | 3.2% | 177 |
| Riverside-San Bernardino, CA | 4% | -50% | 10.6% | 164 |
| Providence, RI-MA | 25% | -26% | 2.8% | 162 |
| Baltimore, MD | 18% | -22% | -1.1% | 161 |
| Portland, OR-WA | 23% | -25% | 7.5% | 157 |
| Denver, CO | 13% | -8% | 9.4% | 152 |
| North Port-Bradenton-Sarasota, FL | -10% | -50% | 9.6% | 150 |
| New Haven, CT | 22% | -21% | -0.6% | 146 |
| Worcester, MA | 9% | -23% | 4.9% | 146 |
| Philadelphia, PA | 31% | -11% | 4.3% | 146 |
| Fort Lauderdale, FL | 35% | -48% | 6.9% | 143 |
| Hartford, CT | 23% | -14% | -0.4% | 143 |
| West Palm Beach, FL | 17% | -49% | 11.7% | 138 |
| Springfield, MA | 32% | -14% | 2.5% | 137 |
| Albany, NY | 16% | -6% | -0.7% | 135 |
| Tacoma, WA | 11% | -32% | 7.5% | 134 |
| Charleston, SC | -5% | -21% | 7.7% | 134 |
| Cape Coral-Fort Myers, FL | -17% | -56% | 9.8% | 133 |
| Newark, NJ-PA | 21% | -20% | 1.9% | 133 |
| Fresno, CA | 2% | -49% | 8.5% | 133 |
| Austin, TX | 7% | -4% | 9.9% | 130 |
| Lake County-Kenosha County, IL-WI | 9% | -27% | 11.3% | 130 |
| Chicago, IL | 32% | -28% | 10.0% | 129 |
| Salt Lake City, UT | -21% | -22% | 4.7% | 129 |
| Virginia Beach-Norfolk, VA-NC | 11% | -19% | 4.4% | 129 |
| Bakersfield, CA | -17% | -52% | 8.2% | 126 |
| Minneapolis-St. Paul, MN-WI | 12% | -26% | 10.0% | 125 |
| Phoenix, AZ | -11% | -51% | 3.8% | 123 |
| Wilmington, DE-MD-NJ | 24% | -20% | 3.8% | 123 |
| Warren-Troy-Farmington Hills, MI | 3% | -37% | 7.8% | 117 |
| Camden, NJ | 24% | -23% | 0.6% | 116 |
| Richmond, VA | 5% | -20% | 2.7% | 116 |
| Milwaukee, WI | 5% | -15% | 5.8% | 116 |
| Pittsburgh, PA | -1% | -2% | 6.9% | 116 |
| Allentown, PA-NJ | 2% | -21% | 2.6% | 114 |
| Las Vegas, NV | 15% | -61% | 9.0% | 113 |
| Raleigh, NC | 6% | -9% | 4.2% | 113 |
| Dallas, TX | -10% | -6% | 7.7% | 112 |
| Tucson, AZ | 7% | -38% | 1.4% | 111 |
| Orlando, FL | 8% | -48% | 7.7% | 110 |
| Albuquerque, NM | 13% | -17% | 0.6% | 110 |
| Nashville, TN | -16% | -9% | 5.6% | 109 |
| Jacksonville, FL | -19% | -38% | 7.0% | 109 |
| Colorado Springs, CO | -21% | -12% | 4.0% | 107 |
| San Antonio, TX | -8% | -4% | 4.5% | 107 |
| Tampa-St. Petersburg, FL | 3% | -43% | 5.0% | 106 |
| Houston, TX | -12% | -4% | 10.7% | 106 |
| New Orleans, LA | 0% | -11% | 7.5% | 102 |
| Palm Bay-Melbourne-Titusville, FL | -13% | -50% | 13.1% | 100 |
| Cincinnati, OH-KY-IN | -16% | -10% | 9.0% | 100 |
| Baton Rouge, LA | -12% | -3% | 1.3% | 100 |
| Charlotte, NC-SC | 2% | -16% | 7.0% | 99 |
| Oklahoma City, OK | -27% | -3% | 4.0% | 98 |
| St. Louis, MO-IL | 7% | -12% | 4.3% | 98 |
| Knoxville, TN | -34% | -8% | 2.1% | 98 |
| Birmingham, AL | -20% | -13% | 11.5% | 96 |
| Buffalo, NY | 14% | -2% | 3.1% | 96 |
| Atlanta, GA | 1% | -26% | 11.1% | 95 |
| Louisville, KY-IN | -3% | -6% | 11.0% | 94 |
| Fort Worth, TX | -23% | -6% | 6.4% | 94 |
| Columbus, OH | 7% | -10% | 6.5% | 94 |
| Omaha, NE-IA | -10% | -5% | 5.4% | 93 |
| Greenville, SC | -30% | -8% | 5.9% | 92 |
| Kansas City, MO-KS | -3% | -12% | 6.6% | 92 |
| Lakeland-Winter Haven, FL | -7% | -46% | 11.1% | 92 |
| Gary, IN | 21% | -11% | 6.8% | 91 |
| Little Rock, AR | -11% | -4% | -6.0% | 90 |
| Tulsa, OK | -32% | -4% | 7.3% | 90 |
| Syracuse, NY | 17% | -3% | 4.1% | 90 |
| Memphis, TN-MS-AR | 12% | -14% | 4.6% | 89 |
| Greensboro, NC | 1% | -10% | 2.6% | 89 |
| El Paso, TX | 32% | -8% | -0.9% | 88 |
| Rochester, NY | 11% | -2% | 2.0% | 87 |
| Grand Rapids, MI | -9% | -22% | 9.1% | 87 |
| Cleveland, OH | 24% | -18% | 4.1% | 86 |
| Akron, OH | 13% | -16% | 6.9% | 84 |
| Columbia, SC | 2% | -11% | -0.9% | 83 |
| Toledo, OH | 21% | -20% | 12.5% | 81 |
| Indianapolis, IN | -8% | -7% | 7.8% | 80 |
| Detroit, MI | 47% | -40% | 11.4% | 75 |
| Dayton, OH | -7% | -13% | 8.8% | 74 |
| City Rank | City | Population | Cost per Sq Foot | Cost Ranking |
|---|---|---|---|---|
| 1 | New York, New York | 8,405,837 | 320 | 8 |
| 2 | Los Angeles, California | 3,884,307 | 334 | 7 |
| 3 | Chicago, Illinois | 2,718,782 | 129 | 42 |
| 4 | Houston, Texas | 2,195,914 | 106 | 66 |
| 5 | Philadelphia, Pennsylvania | 1,553,165 | 146 | 29 |
| 6 | Phoenix, Arizona | 1,513,367 | 123 | 47 |
| 7 | San Antonio, Texas | 1,409,019 | 107 | 64 |
| 8 | San Diego, California | 1,355,896 | 296 | 10 |
| 9 | Dallas, Texas | 1,257,676 | 112 | 57 |
| 10 | San Jose, California | 998,537 | 430 | 3 |
hmmm, vote liberal and you end up pricing yourself out of the housing market. Or your kids.
Liberals would say that they are more desirable neighbors.
“upscale” Marin County....north of Overpriced San Francisco....voted 90 percent for Barack Obama.....and the median priced home here costs..over a million bucks.
I live in an apartment by the way...
Liberals want to bankrupt us all so we’ll have to be dependent on them.
This is why liberals want to raise the minimum wage to $15 an hour. But it probably isn't enough to buy that million dollar home! So libs will up it again. If they raise the minimum wage to $100 per hour, then everyone can afford a million dollar home. Liberal mindthink solves another problem!
Liberals would say they are more intelligent and successful than the uneducated rubes in flyover country. Though I am fairly certain that a large percentage of their base is on welfare.
And BTW, they always like to whine about income disparity, but I’ll bet if you look at income disparity (and poverty) within the Democrat party it far exceeds the levels in the Republican party.

Las Vegas - Down 61%
Phoenix - Down 51%
Detroit - Down 40%
All the other cities with a 40% or higher price drop were in Florida or California.
Wow, you’re in the midst of the enemy.
Yup. There’s none more hypocritical or arrogant than a liberal.
Give me a bitter clinger any day.
Disclaimer: Opinions posted on Free Republic are those of the individual posters and do not necessarily represent the opinion of Free Republic or its management. All materials posted herein are protected by copyright law and the exemption for fair use of copyrighted works.