Skip to comments.
The Mythical Global Warming
Strata-sphere.com ^
| Feb 11, 2010
| AJStrata
Posted on 02/20/2010 11:21:17 AM PST by Ernest_at_the_Beach
Update Alert: New graphs up, updating text now. – new text is in red, silly mistaken old text is in strike out. Sorry for the lousy quality control, there is a reason I am not paid to do this! The fixes made my case stronger I think.
Update Alert: I have errors in the last four graphs (global averages) which I will fix as soon as I can. Sadly this one person shop is juggling too much right now – my bad. It only changes the magnitude of the results, not the contours. Now if I can keep MS Excel from bombing again! - end alert
There’s a very interesting post up at Musings by Chiefio, which focuses on actual temperature measurements and what they are saying about global climate over the last 130 years of the basic temperature record. Chiefio (sorry, should know the real name) and I share a severe skepticism about the global climate indexes since they are 99.99+% extrapolations and adjustments – not measurements! Only .01% of the data are measurements, and even then the alarmists do all sorts of unproven processing on the raw values.
What I appreciate Chiefio doing here is just staying with the basic data and asking a basic question – what was the accumulated change in Temp over time (what he calls dT/dt). He posted his data and did some graphs, but I wanted to do my own look at his results and did my own graphs of the data – hopefully Chiefio will not mind.
As far as I know Chiefio was using the raw data from GHCN, which is the basic data for GISS, CRU and NCDC before they do all their special ‘adjustments’. So here are the regional results in my own format with some additional information added.
Let’s begin with the Pacific Region:
Let me first highlight what is being shown. The blue line is the annual cumulative dT/dt produced by Chiefio. The black line is a 3rd power polynomial trend line that shows what the temperature is doing over time. The yellow bars are the one standard deviation range – I like to see where the data’s normal variance is when determining if there is any significance to trends. Note these are not error bars.
Most importantly is the red and green lines. The red lines are the number of stations (in thousands) use to generate the temperature for each year. It has a huge bearing on what we see in the graphs. The green line indicates when this region of the world went through a massive culling of stations – usually in rural and high altitude areas. This is something Chiefio notes over and over again in his analysis.
All graphs can be clicked to enlarge in a new window.
So what do we see in the Pacific region? We see that the region was warmer than today around the first World War, and about the same as today around World War II (+.2 vs +.4, which is insignificant and in the error bars). We also see massive station drop outs in 1997, after which the temperature finally breaks out of the standard deviation range and starts rising in true hockey stick fashion. The number of stations in this region began at around 30, peaked at around 710, and then dropped back to around 120-160.
Looking at this region alone it there is no clear indication of ‘global’ warming, human made or otherwise. Let’s move onto South America:
TOPICS: Crime/Corruption; Extended News; Foreign Affairs
KEYWORDS: climatechange; climatechangedata; globalwarminghoax
Navigation: use the links below to view more comments.
first 1-20, 21-40, 41-42 next last
*****************************************************
*********************This is an EXCERPT********************************
*********************************************************
To: Ernest_at_the_Beach; markomalley; Carlucci; grey_whiskers; meyer; WL-law; Para-Ord.45; Desdemona; ..
2
posted on
02/20/2010 11:21:59 AM PST
by
steelyourfaith
(FReepers were opposed to Obama even before it was cool to be against Obama.)
Conclusions:
- It is clear if we just use the temperature readings and give them equal weight there is little to no global warming detected over the last 130 years.
- Instead of being driven by man-made CO2, temperature seems to follow the number of stations in use, first showing a cooling planet as technology moved out of the large cities, and then showing a warmer planet as they were removed in recent years.
- Europe’s data is a mess and an outlier and should not be used to out weigh the Pacific and North America record. It is not by accident most or all of the warming disappears when you pull Europe out of the mix – which means there is something statistically wrong here.
To: Ernest_at_the_Beach
Instead of being driven by man-made CO2, temperature seems to follow the number of stations in use, first showing a cooling planet as technology moved out of the large cities, and then showing a warmer planet as they were removed in recent years.The correct term is Mann-Made Global Warming.
4
posted on
02/20/2010 11:24:34 AM PST
by
samtheman
To: All; neverdem; 353FMG; ConservativeMind
To: samtheman
LOL...but he had a lot of Help!
To: SunkenCiv; Marine_Uncle; Fred Nerks; steelyourfaith; NormsRevenge; onyx; BOBTHENAILER; ...
To: All
Link to :
Musings from the Chiefio
******************************EXCERPT**************************************
Is dT/dt a good way to kill the notion of AGW?
OK, so I’ve gone and built a new hammer… While this started off an an exploration of the “constant sample” technique of statistics (where each data item is compared to the prior time period, so you would always sample “this year vs last”) it has evolved into something more along the lines of a sloppy first derivative. Delta Temperature per Delta Time. Or dT/dt.
For each thermometer, and for each month, I simply find the degree to which the present reading is different from the last reading. How much did the temperature change during that time period?
That’s what we all want to know, after all. Isn’t it? IS the temperature changing, or not? So why not just go calculate that rather than going through all this other junk first?
Seemed reasonable to me, so I did.
To: All
From Chiefio:
NASA GISS Speaks – FOIA Emails********************************EXCERPTS****************************
February 18, 2010 by E.M.Smith
NASA has responded to a 2 year old FOIA request
These were released as a result of the FOIA request put in by Chris Horner as described on WUWT:
http://wattsupwiththat.com/2010/02/17/after-two-years-of-stonewalling-nasa-giss-foia-files-are-now-online/
It comes in four parts from this URL as pdf docs:
http://www.nasa.gov/centers/goddard/business/foia/GISS.html
Part one is:
http://www.nasa.gov/centers/goddard/pdf/415776main_NASA%20GISS%20Temperature%20Data%20(Part%201%20of%203).pdf
Part two:
http://www.nasa.gov/centers/goddard/pdf/415777main_NASA%20GISS%20Temperature%20Data%20(Part%202%20of%203).pdf
Part Three:
http://www.nasa.gov/centers/goddard/pdf/415778main_NASA%20GISS%20Temperature%20Data%20(Part%203%20of%203).pdf
Part Four:
http://www.nasa.gov/centers/goddard/pdf/417760main_part4.pdf
A scanned in OCR’d a searchable set is at:
http://www.neutralpedia.com/wiki/NASA_FOIA_Emails
An Example
Subject: Re: Your Reply to: GISS Temperature Correction Problem?
From: Gavin Schmidt gschmidt@giss.nasa.gov
Date: 19 Feb 2008 14:38:47 -0500
To: rruedy@giss.nasa.gov
I had a look at the data, and this whole business seems to be related to the infilling of seasonal and annual means. There is no evidence for any step change in any of the individual months.
The only anomalous point (which matches nearby deltas) is for Set 2005. Given the large amount of missing data in lampasas this gets propagated to the annual (D-N) mean – I think – with a little more weight then in the nearby stations. The other factor might be that lampasas is overall cooling, if we use climatology to infill in recent years, that might give a warm bias. But I’m not sure on how the filling-in happens.
Gavin
So as I read this, the folks at NASA responsible for GIStemp are saying that large data dropouts (i.e. Zombie Stations for a while or Dropouts for longer periods) “gets propagated” to the means (and thus the map products) and that if “we use climatology” (i.e. the way GIS uses the relationships between areas ‘climatology’ as it calculates ‘offsets’ – that’s the jargon for their process) that might “give a warm bias”.
Gee.
Maybe I don’t need to convince them that missing data can lead to climatology based infill giving a warming bias. Maybe I only need to get them to ADMIT it publicly… Oh, wait, this FOIA email looks like it does that… Though I’m sure we will get quibbling about it being only one swallow and not a whole spring…
And this one admires the way that you can make up yearly data with just a collection of months data… and that it might have issues. But he’s “pretty sure” it is “just a fluke”… unless, of course, you have a constantly shrinking number of thermometers with ever more gaps in the data to be “made up” from ever less real data…
But including one month of dropped data would “only” drop the temperature by 0.4 C for the annual mean of the cell in question…
Subject: Re: [Fwd: Re: Your Reply to: GISS Temperature Correction Problem?]
From: Gavin Schmidt
Date: 20 Feb 2008 15:01:26 -0500
To: rruedy
That works.
That implies that the missing months are assumed to have the same mean anomaly as the other two months, and that the missing seasons are assumed to have the same mean anomaly as the seasons present. Hence, one strong anomaly in a couple of months (ie. Sept and Nov 2005) can have a large impact on the annual mean.
I’m pretty sure that the Lampasas spike is just a fluke of the annual average construction. There are only eight months – of which only 7 are used to calculate the annual mean. The missing month (May) has the smallest anomaly, and so including it would bring down the annual mean by about 0.4 deg C.
There may be some improvements that could be made here. i.e. annual means could use as many months as there are available (rather than just whether the seasons are available), and it should be made clearer that this is a Dec-Nov mean, not the calendar year mean, Somewhere it should also be stated that the seas/ann values in the printout and figures are not used in the gridded data.
Thanks
Gavin
To: All
That last link...Hansen....refers to our Friend ...
Dr Hansen at NASA....*********************EXCERPTS********************************
from the last link at post #9.
********************************
FOIed Emails on Hansen Y2K
If anyone is wondering whether emails by U.S. government employees are “private” and “personal” – an assertion sometimes made in respect to emails at CRU, an institution subject to UK FOI – the answer in respect to NASA GISS appears to be no.
Link:
Judicial Watch announced today that it has obtained internal documents from NASA’s Goddard Institute for Space Studies (GISS) related to a controversy that erupted in 2007 when Canadian blogger Stephen McIntyre exposed an error in NASA’s handling of raw temperature data from 2000-2006 that exaggerated the reported rise in temperature readings in the United States.
To: Ernest_at_the_Beach
It’s one thing to gripe and complain about these things and disagree with it,
but it’s quite another to convince your friends and neighbors and relatives and coworkers...
THEREFORE..., it’s also absolutely necessary for people to know the information in the following documentary. If there were simply one video that you could see and/or show people you know... this would be the one...
The following is an excellent video documentary on the so-called “Global Warming” I would recommend it to all FReepers. It’s a very well-made documentary.
“The Great Global Warming Swindle”
If you want to download it, via a BitTorrent site (using a BitTorrent client), you can get it at the following link. Information about BitTorrent protocol and BitTorrent clients and their comparison at these three links (in this sentence). Some additional BitTorrent information here and here.
Download it here...
http://thepiratebay.org/torrent/3635222/The_Great_Global_Warming_Swindle
[This is a high-quality copy, of about a gigabyte in size. This link is the information about it, and you have to click the download link to get it on your BitTorrent client software. You'll also find users' comments here, too.]
It’s worth seeing and having for relatives, friends, neighbors and coworkers to see.
Also, see it online here...
http://www.moviesfoundonline.com/great_global_warming_swindle.php
[this one is considerably lower quality, is a flash video and viewable online, of course..., and also, you can download flash video on a website either yourself or some software doing it.]
Buy it on DVD here...
[this would be the very highest quality version, on a DVD disk, of several gigabytes in size...] At Amazon, it seems to be high-priced now and have only a few copies right now.
http://www.amazon.com/dp/B000WLUXZE
At WAGtv (a UK shop), but don't know about shipping. The price is reasonable, though.
https://www.wagtv.com/product/The-Great-Global-Warming-Swindle-322.html
[And..., some information from WAGtv about this item.]
Also, in split parts on YouTube...
The Great Global Warming Swindle (Part 1 of 9)
http://www.youtube.com/watch?v=6TqqWJugXzs
The Great Global Warming Swindle (Part 2 of 9)
http://www.youtube.com/watch?v=L5rGpDMN8lw
The Great Global Warming Swindle (Part 3 of 9)
http://www.youtube.com/watch?v=GzFL6Ixe_bo
The Great Global Warming Swindle (Part 4 of 9)
http://www.youtube.com/watch?v=mNQy2rT_dvU
The Great Global Warming Swindle (Part 5 of 9)
http://www.youtube.com/watch?v=5dzIMXGI6k8
The Great Global Warming Swindle (Part 6 of 9)
http://www.youtube.com/watch?v=6GjOgQN1Jco
The Great Global Warming Swindle (Part 7 of 9)
http://www.youtube.com/watch?v=VHI2GfbfrYw
The Great Global Warming Swindle (Part 8 of 9)
http://www.youtube.com/watch?v=7N9benJh3Lw
The Great Global Warming Swindle - Credits (Part 9 of 9)
http://www.youtube.com/watch?v=S_1ifP-ri58
11
posted on
02/20/2010 12:26:48 PM PST
by
Star Traveler
(Remember to keep the Messiah of Israel in the One-World Government that we look forward to coming)
To: Ernest_at_the_Beach
Until recently, global temperatures were more than a degree Fahrenheit warmer when compared to the overall 20th Century mean. From August of 2007 through February of 2008, the Earth’s mean reading dropped to near the 200-year average temperature of 57 degrees. Since that time, the mean reading has been fluctuating.
We, Cliff Harris and Randy Mann, believe that the warming and even the cooling of global temperatures are the result of long-term climatic cycles, solar activity, sea-surface temperature patterns and more. However, Mankind’s activities of the burning of fossil fuels, massive deforestations, the replacing of grassy surfaces with asphalt and concrete, the ‘Urban Heat Island Effect,’ are making conditions ‘worse’ and this will ultimately enhance the Earth’s warming process down the meteorological roadway in the next several decades.

From the late 1940s through the early 1970s, a climate research organization called the Weather Science Foundation of Crystal Lake, Illinois, determined that the planet’s warm, cold, wet and dry periods were the result of alternating short-term and long-term climatic cycles. These researchers and scientists also concluded that the Earth’s ever-changing climate likewise has influenced global and regional economies, human and animal migrations, science, religion and the arts as well as shifting forms of government and strength of leadership.
Much of this data was based upon thousands of hours of research done by Dr. Raymond H. Wheeler and his associates during the 1930s and 1940s at the University of Kansas. Dr. Wheeler was well-known for his discovery of various climate cycles, including his highly-regarded ‘510-Year Drought Clock’ that he detailed at the end of the ‘Dust Bowl’ era in the late 1930s.
During the early 1970s, our planet was in the midst of a colder and drier weather cycle. Inflationary recessions and oil shortages led to rationing and long gas lines at service stations worldwide. The situation at that time was far worse than it is now, at least for the time being.
The Weather Science Foundation also predicted, based on these various climate cycles, that our planet would turn much warmer and wetter by the early 2000s, resulting in general global prosperity. They also said that we would be seeing at this time widespread weather ‘extremes.’ There’s little doubt that most of their early predictions came true.
Our recent decline in the Earth’s temperature may be a combination of both long-term and short-term climate cycles, decreased solar activity and the development of a strong long-lasting La Nina, the current cooler than normal sea-surface temperature event in the south-central Pacific Ocean. Sunspot activity in the past 18 months has decreased to the lowest levels since ‘The Little Ice Age’ ended in the mid-to late 1800s. This "cool spell," though, may only be a brief interruption to the Earth’s overall warming trend. Only time will tell.
Based on these predictions, it appears that much warmer readings may be expected for Planet Earth, especially by the 2030s, that will eventually top 1998's global highest reading of 58.3 degrees. It’s quite possible we could see an average temperature in the low 60s. Until then, this ‘cooling period’ may last from just a few months to as long as several years, especially if sunspot activity remains very low.
We at Harris-Mann Climatology, www.LongRangeWeather.com, believe that our prolonged cycle of wide weather ‘extremes,’ the worst in at least 1,000 years, will continue and perhaps become even more severe, especially by the mid 2010s. We should see more powerful storms, including major hurricanes and increasing deadly tornadoes. There will likewise be widespread flooding, crop-destroying droughts and freezes and violent weather of all types including ice storms, large-sized hail and torrential downpours.
We are already seeing on virtually every continent an almost Biblical weather scenario of increasing droughts and floods. In both the southwestern and southeastern corners of the U.S, there are severe water shortage problems associated with chronic long-term dryness. In some cases, the water deficits are the worst in at least 400 years.
Dr. Wheeler also discovered that approximately every 102 years, a much warmer and drier climatic cycle affects our planet. The last such ‘warm and dry’ peak occurred in 1936, at the end of the infamous ‘Dust Bowl’ period. During that time, extreme heat and dryness, combined with a multitude of problems during the ‘Great Depression,’ made living conditions practically intolerable.
The next ‘warm and dry’ climatic phase is scheduled to arrive in the early 2030s, probably peaking around 2038. It is expected to produce even hotter and drier weather patterns than we saw during the late 1990s and early 2000s.
But, we should remember, that the Earth’s coldest periods have usually followed excessive warmth. Such was the case when our planet moved from the Medieval Warm Period between 900 and 1300 A.D. to the sudden ‘Little Ice Age,’ which peaked in the 17th Century.
By the end of this 21st Century, a big cool down may occur that could ultimately lead to expanding glaciers worldwide, even in the mid-latitudes. We could possibly see even a new Great Ice Age. Based on long-term climatic data, these major ice ages have recurred about every 11,500 years. Well, you guessed it. The last extensive ice age was approximately 11,500 years ago, so we may be due. Again, only time will tell.
12
posted on
02/20/2010 12:27:15 PM PST
by
Star Traveler
(Remember to keep the Messiah of Israel in the One-World Government that we look forward to coming)
To: Star Traveler
Well...nevertheless...NSAS continues on its quest to explain the Generally accepted Global Warming by the pollution of certain Green house Gases...
Agents of global warming
****************************
Molecules laid bare
February 9, 2010
posted by Dr. Amber Jenkins 5:33 PST
The Earth is a bit like the human body; its temperature is very finely balanced, and when it gets slightly out of whack big things can happen. In the case of our home planet, gases in the atmosphere play a vital role in maintaining this delicate equilibrium, by balancing the absorption and emission of all the electromagnetic radiation (microwaves, infrared waves, ultraviolet light and visible light, for example) reaching the surface of the Earth.
As we reported recently, the Earth is getting warmer. Scientists believe the main driver behind this warming trend is rising levels of man-made greenhouse gases; these gases, which we pump out into the air, act to trap heat radiation near the surface of the Earth that would otherwise be sent back out into space. Carbon dioxide (CO2) is the Paris Hilton of greenhouse gases, and gets a lot of face time because its concentration in the atmosphere has increased relatively rapidly since the Industrial Revolution. But methane, nitrous oxide, hydrofluorocarbons (HFCs), chlorofluorocarbons (CFCs) and perfluorocarbons (PFCs) are also important agents of global warming — some of them are actually much more potent than CO2 and they stick around for hundreds to thousands of years longer. This has some scientists concerned that these B-listers could actually impact global temperatures significantly more than CO2.
In a new paper, Partha Bera and colleagues at NASA Ames Research Center and Purdue University put these gases under the microscope to find out exactly why they are such powerful heat trappers. They focus on CFCs, HFCs and PFCs — all chemicals containing the atoms fluorine or chlorine — that are used in medicine, fridges and as solvents, among other things. By probing the molecular structure of these compounds, they have found that molecules containing several fluorine atoms are especially strong greenhouse gases, for two reasons. First, unlike many other atmospheric molecules, they can absorb radiation that makes it through our atmosphere from space. Second, they absorb the radiation (trap the heat) very efficiently, because of the nature of the fluorine bonds inside them. (In technical terms, fluorine atoms create a larger separation of electric charge within the molecule, and this helps the molecular bonds absorb electromagnetic radiation more effectively.) HFCs and other fluorine-based gases have been called “the worst greenhouse gases you’ve never heard of.” Now we know why.
Until now, scientists had not looked in detail at the underlying physical or chemical causes that make some molecules better global warmers than others. Bera and colleagues say that their work should help improve our “understanding [of] the physical characteristics of greenhouse gases, and specifically what makes an efficient greenhouse gas on a molecular level.” They hope their findings will be used by industry to develop more environmentally-friendly materials.
To: Star Traveler
14
posted on
02/20/2010 12:47:40 PM PST
by
Publius6961
(You can't build a reputation on what you are going to do)
To: Star Traveler; neverdem; SunkenCiv; Marine_Uncle; Fred Nerks; steelyourfaith; NormsRevenge; onyx; ..
Apparently NASA's Job is to show the earth is warming...see this:
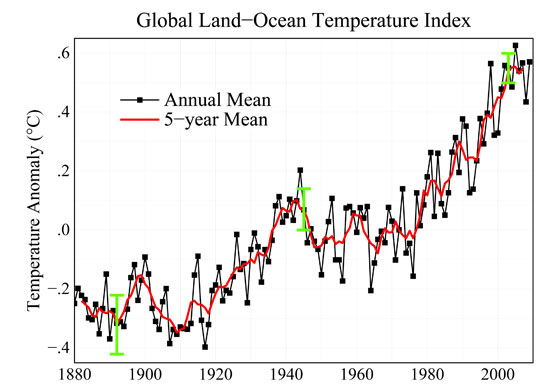
2009: Second warmest year on record; end of warmest decade
***************************************** Graphs at the website.........
***********************************
Except for a leveling off between the 1940s and 1970s, the surface temperature of our planet has increased since 1880. The last decade has seen global temperatures rise to the highest levels ever recorded. This graph illustrates the change in global surface temperature relative to 1951-1980 average temperatures. As shown by the red line, long-term trends are more apparent when temperatures are averaged over a 5-year period. The green error bars represent the uncertainty on measurements.
NASA
******************************************
01.23.10
By Adam Voiland,
NASA’s Earth Science News Team2009 was tied for the second warmest year in the modern record, a new NASA analysis of global surface temperature shows. The analysis, conducted by NASA's Goddard Institute for Space Studies (GISS) in New York City, also shows that in the Southern Hemisphere, 2009 was the warmest year since modern records began in 1880. Although 2008 was the coolest year of the decade — due to strong cooling of the tropical Pacific Ocean — 2009 saw a return to near-record global temperatures. The past year was only a fraction of a degree cooler than 2005, the hottest year on record, and tied with a cluster of other years — 1998, 2002, 2003, 2006 and 2007 — as the second warmest year since recordkeeping began. “There’s always an interest in the annual temperature numbers and on a given year’s ranking, but usually that misses the point,” said James Hansen, the director of GISS. “There's substantial year-to-year variability of global temperature caused by the tropical El Niño-La Niña cycle. But when we average temperature over five or ten years to minimize that variability, we find that global warming is continuing unabated."The hottest decade
January 2000 to December 2009 was the warmest decade on record. Throughout the last three decades, the GISS surface temperature record shows an upward trend of about 0.2°C (0.4°F) per decade. Since 1880 — the year that modern scientific instrumentation became available to monitor temperatures precisely — a clear warming trend is present, though there was a leveling off between the 1940s and 1970s.
This map, produced by scientists at the Goddard Institute for Space Studies, shows the 10-year average (2000-2009) temperature change relative to the 1951-1980 mean. The largest temperature increases are in the Arctic and the Antarctic Peninsula.
The near-record temperatures of 2009 occurred despite an unseasonably cool December in much of North America. High air pressures in the Arctic decreased the east-west flow of the jet stream (a fast flowing air current in the troposphere), while also increasing its tendency to blow from north to south and drag cold air southward from the Arctic. This resulted in an unusual effect that caused frigid air from the Arctic to rush into North America and warmer mid-latitude air to shift toward the north. "Of course, the contiguous 48 states cover only 1.5 percent of the world area, so the U.S. temperature does not affect the global temperature much,' said Hansen. In total, average global temperatures have increased by about 0.8°C (1.4°F) since 1880. “That’s the important number to keep in mind,” said Gavin Schmidt, another GISS climate researcher. “In contrast, the difference between, say, the second and sixth warmest years is trivial since the known uncertainty — or noise — in the temperature measurement is larger than some of the differences between the warmest years."Decoding the temperature record
Climate scientists agree that rising levels of carbon dioxide and other greenhouse gases trap incoming heat near the surface of the Earth and are the key factors causing the rise in temperatures since 1880. But these gases are not the only factors that can impact global temperatures. Three others key factors — changes in the sun’s irradiance (energy), changes in sea surface temperature in the tropics, and variations in aerosol levels in the atmosphere — can also cause slight increases or decreases in the planet's temperature. Overall, the evidence suggests that these effects are not enough to account for the global warming observed since 1880. El Niño and La Niña are prime examples of how the oceans can affect global temperatures. They describe abnormally warm or cool sea surface temperatures in the South Pacific that are caused by changing ocean currents. Global temperatures tend to decrease in the wake of La Niña, which occurs when upwelling cold water off the coast of Peru spreads westward in the equatorial Pacific Ocean. La Niña, which moderates the impact of greenhouse-gas driven warming, lingered during the early months of 2009 and gave way to the beginning of an El Niño phase in October that’s expected to continue in 2010. An especially powerful El Niño cycle in 1998 is thought to have contributed to the unusually high temperatures that year, and Hansen’s group estimates that there’s a good chance 2010 will be the warmest year on record if the current El Niño persists. At most, scientists estimate that El Niño and La Niña can cause global temperatures to deviate by about 0.2°C (0.4°F). Warmer surface temperatures also tend to occur during particularly active parts of the solar cycle, known as "solar maximums", while slightly cooler temperatures occur during lulls in activity, called "solar minimums". A deep solar minimum has made sunspots a rarity in the last few years. Such lulls in solar activity, which can cause the total amount of energy given off by the sun to decrease by about a tenth of a percent, typically spur surface temperature to dip slightly. Overall, solar minimums and maximums are thought to produce no more than 0.1°C (0.2°F) of cooling or warming. As Hansen explained, “In 2009, it was clear that even the deepest solar minimum in the period of satellite data hasn’t stopped global warming from continuing.”
Over the last two decades, temperature rise in the Northern Hemisphere has outpaced that seen in the Southern Hemisphere. As seen by the blue point farthest to the right on this graph, 2009 was the warmest year ever recorded in the Southern Hemisphere.
NASA
Small particles in the atmosphere called aerosols can also affect the climate. Volcanoes are powerful sources of sulfate aerosols that counteract global warming by reflecting incoming solar radiation back into space. In the past, large eruptions at Mount Pinatubo in the Philippines and El Chichón in Mexico have caused global dips in surface temperature of as much as 0.3°C (0.5°F). But volcanic eruptions in 2009 have not had a significant impact. Meanwhile, other types of aerosols, often produced by burning fossil fuels, can change surface temperatures by either reflecting or absorbing incoming sunlight. Hansen’s group estimates that aerosols probably counteract about half of the warming produced by man-made greenhouse gases, but he cautions that better measurements of these elusive particles are needed.Data details
To conduct its analysis, GISS uses publicly available data from three sources: weather data from more than a thousand meteorological stations around the world; satellite observations of sea surface temperature; and Antarctic research station measurements. These three datasets are loaded into a computer program, which is available for public download from the GISS website. The program calculates trends in terms of "temperature anomalies" — not absolute temperatures, but changes up or down relative to the average temperature for the same month during the period of 1951-1980. Other research groups also track global temperature trends but use different analysis techniques. The Met Office Hadley Centre, based in the United Kingdom, uses similar input measurements as GISS, for example, but it omits large areas of the Arctic and Antarctic, where monitoring stations are sparse. In contrast, the GISS analysis extrapolates data in those regions using information from the nearest available monitoring stations, and thus has more complete coverage of the Earth’s polar areas. If GISS didn't extrapolate in this manner, Schmidt explained, the computer software that performs the analysis would assume that areas without monitoring stations warm at the same rate as the global mean — an assumption that doesn't line up with the changes in Arctic sea ice that satellites have observed. Although the two methods produce slightly different results in the annual rankings, the decade-long trends in the two records are essentially identical. "There's a contradiction between the results shown here and popular perceptions about climate trends," Hansen said. "In the last decade, global warming has not stopped."
Related Links:
|
 |
 |
- 2009 is tied as the second warmest year since modern record keeping began
- 2000-2009 was the hottest decade on record
- The sun is currently in a period of abnormally low solar activity, yet global warming appears to be continuing
|
| |
|
|
|
| |
|
|
News Archive |
|
To: Publius6961
See #15....
Hansen’s Group is still working away!
To: Ernest_at_the_Beach
Where is the H**L are they getting this?
****************************************************EXCERPT from text at #15*****************************
Although 2008 was the coolest year of the decade — due to strong cooling of the tropical Pacific Ocean — 2009 saw a return to near-record global temperatures. The past year was only a fraction of a degree cooler than 2005, the hottest year on record, and tied with a cluster of other years — 1998, 2002, 2003, 2006 and 2007 — as the second warmest year since recordkeeping began.
To: Ernest_at_the_Beach
You were saying ...
Apparently NASA's Job is to show the earth is warming...
It might be, but people can look at the materials that I supplied and figure that one out... :-)
And..., there are other materials out there, but the "Great Global Warming Swindle" is probably the best one to show the average "man on the street" for getting into the issue.
Otherwise, if you throw big long lists of numbers and/or charts that they can't figure out right off the bat, then they're gonna throw up their hands and say, "I don't know!"
That's why something like the "Great Global Warming Swindle" is so good for what it does. :-)
18
posted on
02/20/2010 1:06:35 PM PST
by
Star Traveler
(Remember to keep the Messiah of Israel in the One-World Government that we look forward to coming)
To: Dr. Bogus Pachysandra
Just in case you haven’t seen this....ping.
To: Ernest_at_the_Beach
You were saying ...
Well...nevertheless...NSAS continues on its quest to explain the Generally accepted Global Warming by the pollution of certain Green house Gases...
That's why showing the "average Joe" the video documentary "The Great Global Warming Swindle" plus the graphic in Post #12 -- works so well...
20
posted on
02/20/2010 1:09:18 PM PST
by
Star Traveler
(Remember to keep the Messiah of Israel in the One-World Government that we look forward to coming)
Navigation: use the links below to view more comments.
first 1-20, 21-40, 41-42 next last
Disclaimer:
Opinions posted on Free Republic are those of the individual
posters and do not necessarily represent the opinion of Free Republic or its
management. All materials posted herein are protected by copyright law and the
exemption for fair use of copyrighted works.
FreeRepublic.com is powered by software copyright 2000-2008 John Robinson
