Posted on 05/04/2020 2:00:00 AM PDT by DoughtyOne
PING LIST - Please contact me as needed...
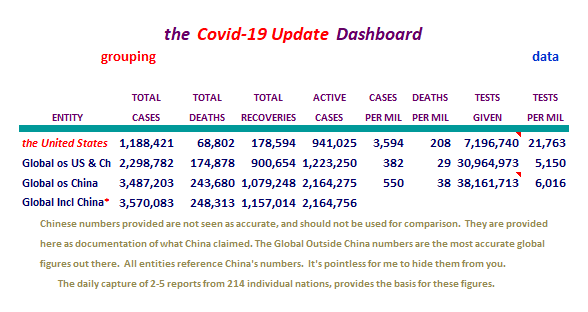
COVID-19 Update
As of 05/03/2020 23:45 PDST Johns Hopkins University - Capture Nations Informaton
As of 00/00/2020 23:45 PDST Johns Hopkins University - Capture Counties Informaton
As of 00/00/2020 23:46 PDST Johns Hopkins University - Process JHU Data
As of 00/00/2020 23:59 PDST WorldofMeters - Document Core Numbers
As of 00/00/2020 23:59 PDST WorldofMeters - Capture Nations Informaton
As of 00/00/2020 23:59 PDST WorldofMeters - Capture States Informaton
As of 00/00/2020 00:00 PDST WorldofMeters - Data Processing begins...
As of 00/00/2020 ??:?? PDST Publish COVID-19 Update - 00/00/00
Thank you for stopping by to check out the COVID-19 Update.
Here you can find...
Section: 01 Commentary, Special Reports, COVID-19 Update Info, & System Notes
Section: 02 the United States Situation
Section: 03 the Global Community Situation Outside China
Section: 04 the Global Community Situation Including China with reservations
Section: 05 the Mortality Report
Section: 06 Miscelanious Reports of Interest
Section: 07 the United States, Counties (alphabetical / case no descending)
Section: 08 the United States, States Ranked with the Other States Territories at Bottom
Section: 09 the United States, Ranked with Other Nations
Section: 10 the End of this COVID-19 Update
Section: 11 Data Sources and a Link to My Own Spreadsheet
Section: 12 Link to Spreadsheet: Our Counties, States, Territories, & Other Nations
Section: 13 Links to Other Resources
Section: 01
Commentary, Special Reports, and COVID-19 Update Information2
Interesting Tid-bits (hopefully)
Top Nations with the Big Numbers
Back in January / February, China was the dominant nation with the numbers of
COVID-19, even if they weren't declaring all of them.
Today China is number eleven on the list of nations with numbers. Again, just
going by what it has declared.
Here are those nations in order. The United States, Spain, Italy, the U. K.,
France, Germany, Russia, Turkey, Brazil, and Iran.
Links to Other Sources of Information
There are some new links down at the bottom of the report. Those that
link to articles on Free Republic, I would urge you to peek at the
comments below. Some of the comments on the Vitam D thread there are
helpful. They add further information.

Section: 02
The Following Addresses the Numbers Here in
the United States of America
Here we go...
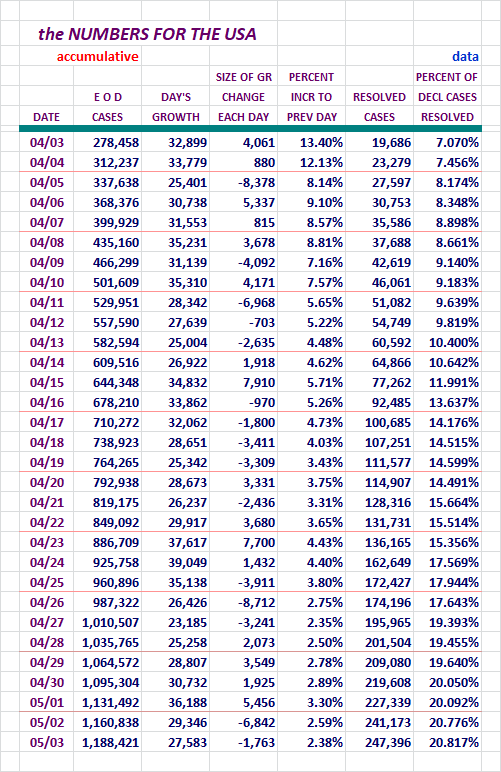
The volume of new Cases continues to go down after Friday. Glad we're in
this part of the week.
Tomorrow should be another good day. Hopefully we'll see another lower number.
Fatalities, Recoveries, Resolved, Active Cases, and
Serious/Critical Cases in the United States
Concept of adding in Active Cases and Serious Crital here, courtesy of amorphous
Here's more of our numbers...
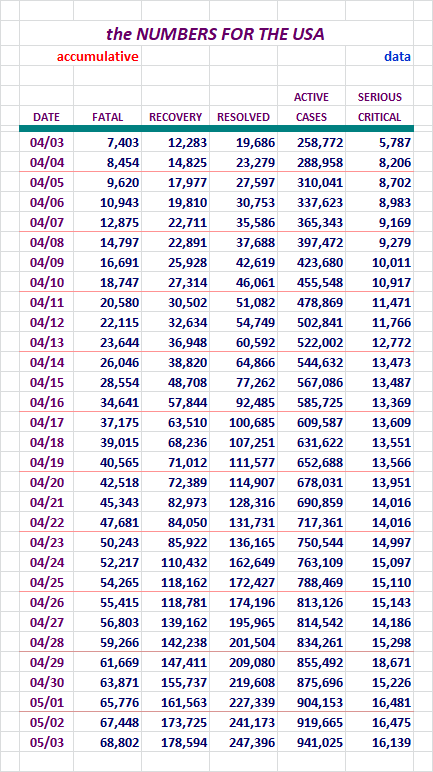
The growth of Fatalities was also down again, and this time the spread
was larger. We'll review down in the Mortality Section.
Our Slice of the COVID-19 Pie
The growth of our Slice of the Pie still keeps growing...
Here are the numbers I've been tracking, Globale Declared and Active Cases.
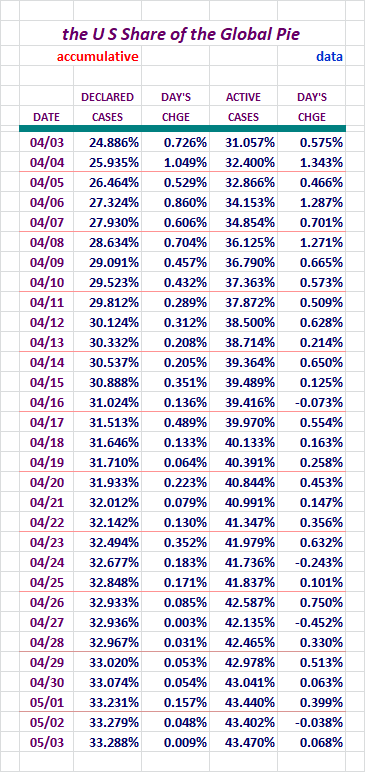
The growth was minimal, but all these "minimals" add up over the weeks.
Compared to what these were growing like, we're doing better.
Section: 03
The Following Addresses the Global Numbers
without Mainland China
Here is the first chart for the Global Outside China Territories
The Global New Cases reduced the rate of their increase again. This time of
the week, it's nice to be able to say some things that aren't all about worse
news.
Fatalities, Recoveries, Resolved, Active Cases, and
Serious/Critical Cases - Globally, Excluding M/L China
Concept of adding in Active Cases and Serious Crital here, courtesy of amorphous
Here we go...
Numbers in this area were not too bad. I guess that's not a good thing to
say with such ominious topics here, but I can't help thinking how things
grew so rapidly for a while there. Now we're still having big numbers, but
they aren't getting dramatically larger each day anymore.
How is the Global Community Outside China Doing,
Without U. S. numbers?
Well, a little better yesterday...
All in all, these numbers aren't too bad.
Yes, we had the same cyclical increase this week like the previous
two. You almost get the feeling you could accurately forcast what
the week's numbers would be inadvance based on the cycle, but once
in a while they surprise us.
For your review...
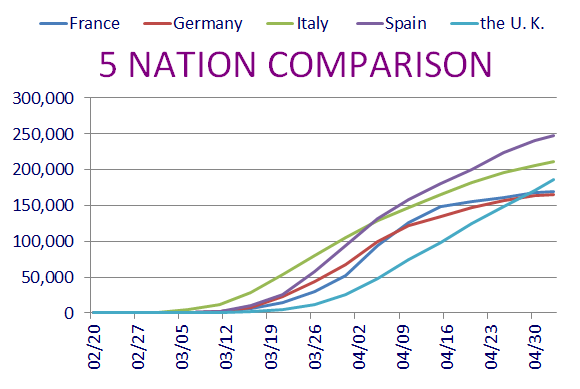
Special Section on France, Germany, Italy, Spain, and the U. K.
Case growth.
Lets Look at Some Numbers in Five Day Increments:
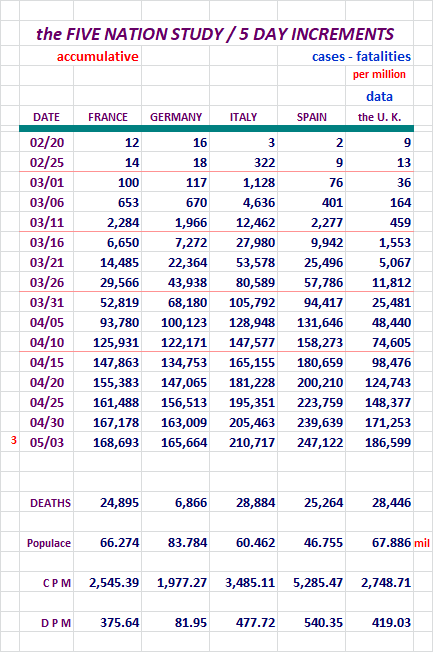
The same comments fit for about each day here.
Germany has been able to keep their deaths down. Nice job...
Both France and Germany have somehow altered thier trajectory
to a better outcome. As the indications seemed to predict, the
U. K. did pass France and Germany by. Over the last week or so,
it appeared that was likely to happen.
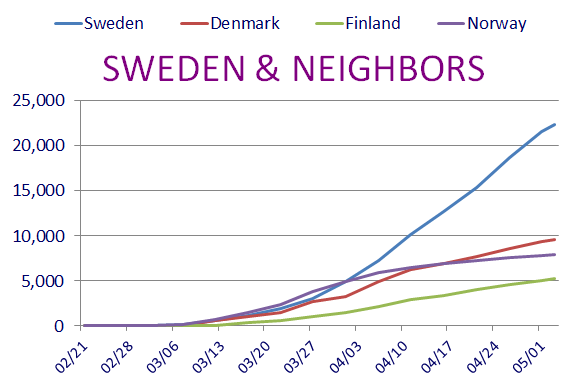
Sweden and It's Neighbors, Who Has the Best Tactic Againt COVID-19?
Sweeden is doing their own thing with regard to isolating. I think most people
are aware of it by now.
Here are some numbers to help us look at this issue.
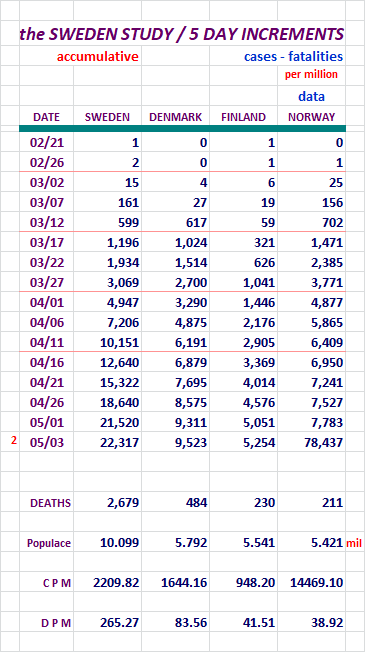
I think we've talked the Sweden situation to the point we all get it.
It's still interesting to watch. I'm not planning on ending this feature.
I just don't think I need to tell you again what you already know.
Section: 04
The Following Addresses the Global Numbers
including Mainland China*
Mainland China's numbers are 0.02% of today's total global numbers.
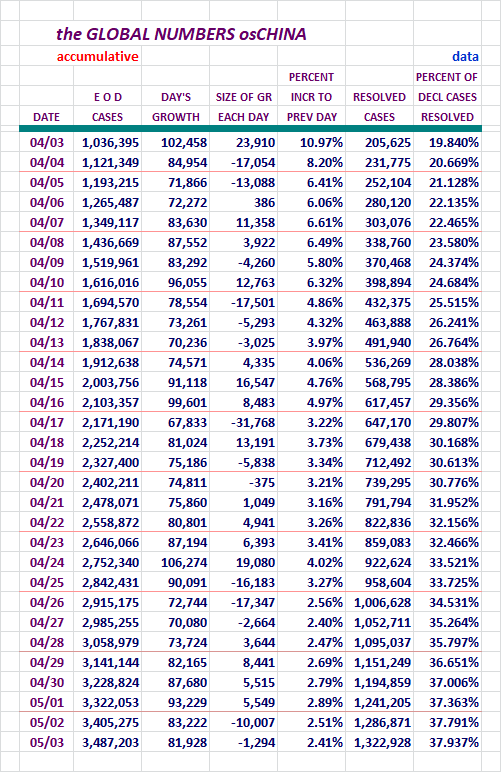
A Look at Declared, Resolved, and Active Cases, Includes M/L China
End of day figures follow:
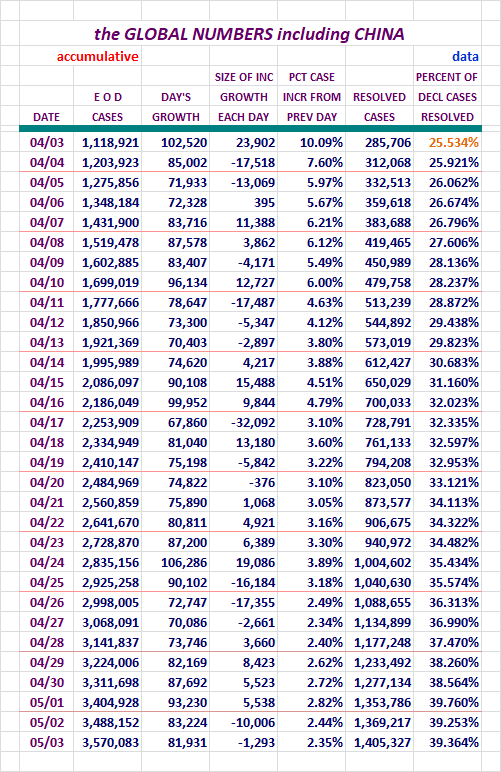
That recovery percentage continues to climb. It looks like we're headed to
40% and above in the next few days. The Recovery numbers hick-up yesterday
seemed to have affected it a bit, but it seems back on track today.
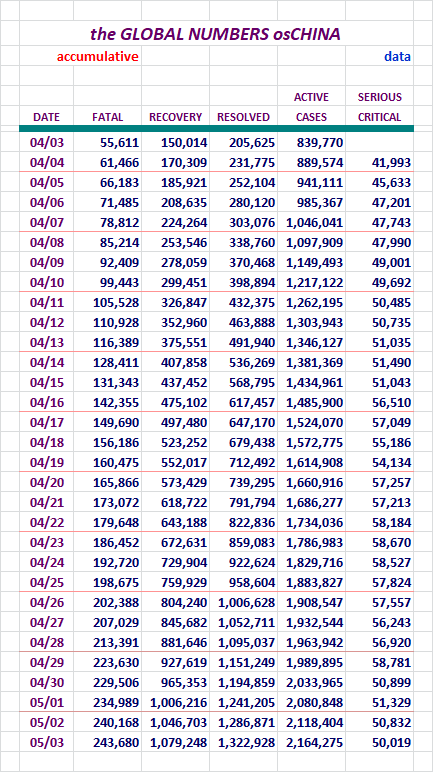
Fatalities, Recoveries, Resolved, Active, and Serious/Crical
Cases Globally, Including M/L China
Concept of adding in Active Cases and Serious Crital here, courtesy of amorphous
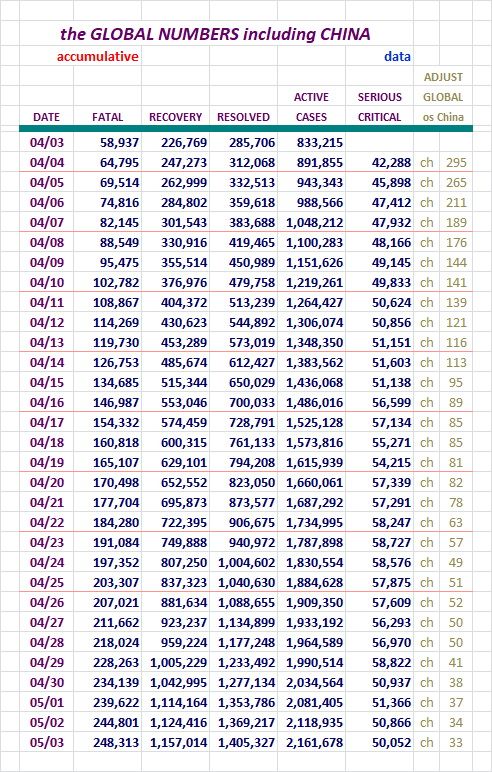
Not much to say here. Big numbers getting bigger...!
Section: 05
the Mortality Report
Making an effort to provide more mortality numbers these days.
Hopefully these upcoming numbers and charts will help with that.
Our numbers are big enough that they can hide the finer nuances of the
Global numbers outside China. For that reason, I strip our numbers off
that group and report them separately for this area of study.
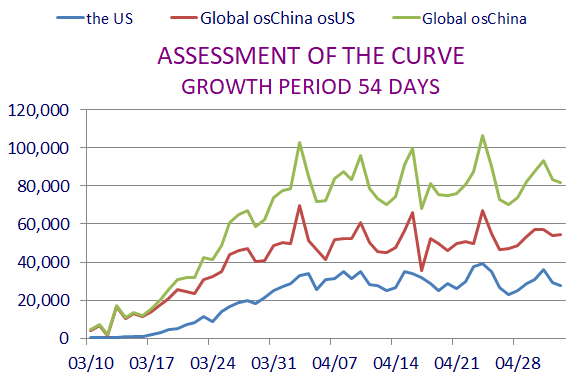
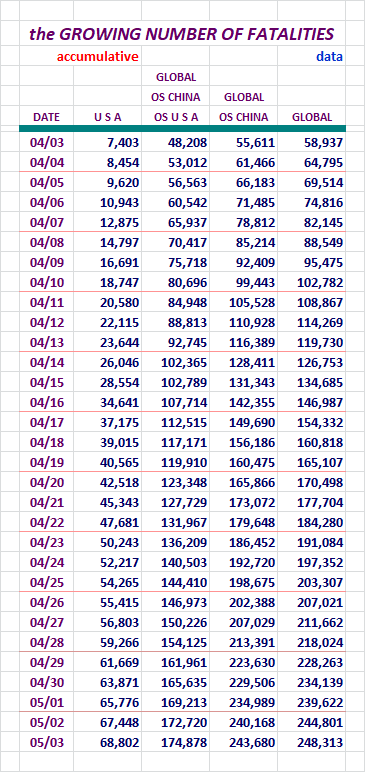
Here are the figures for the growing case totals for four entities.

Here's the chart to go along with those figures.
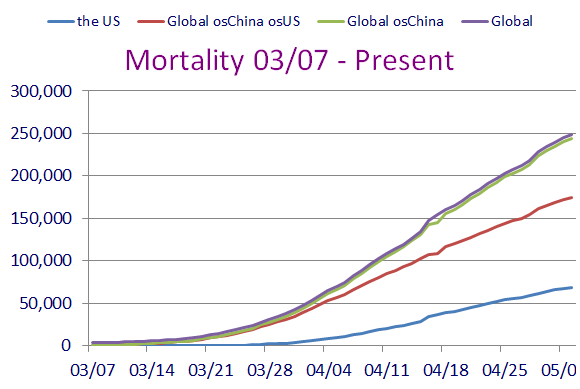
Looks pretty ominious there doesn't it.
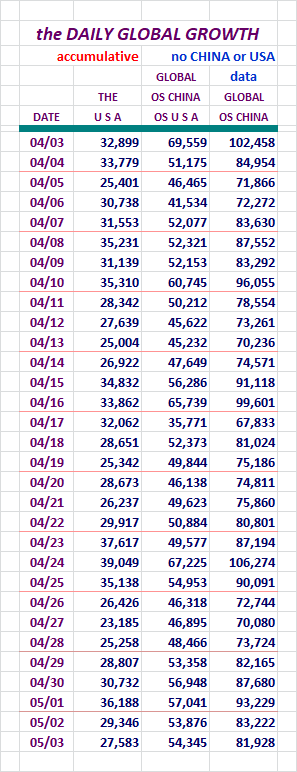
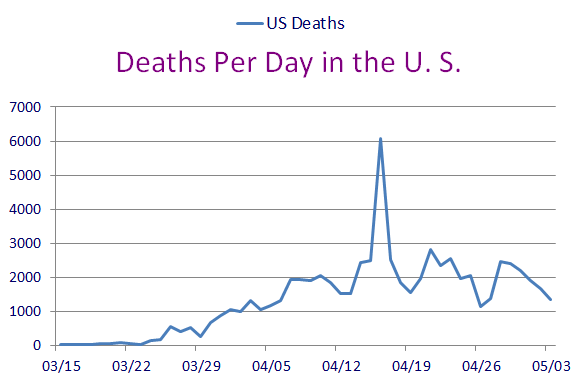
Here are figures revealing the daily growth for those four entities.
Our numbers are looking good here. We've been dropping for five days now.
On the Global scene, the numbers are looking better also. If we go back
ten days, we both were in a much worse place. There has been some
gradual improvement. (this will be more clear one date set below, after these
charts.
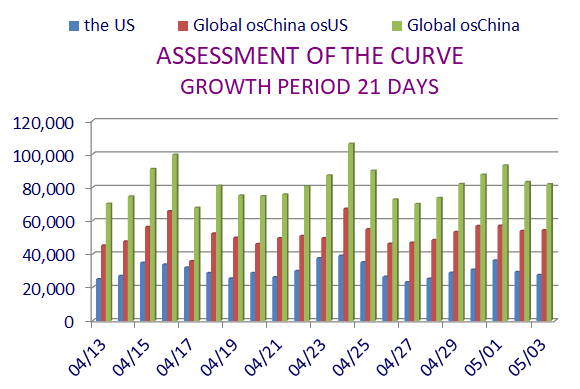
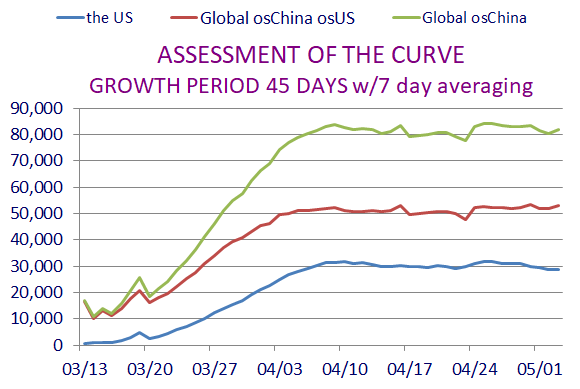
Here's two charts to go with the above data.
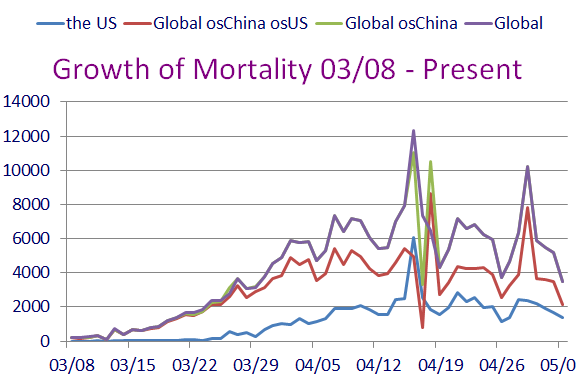
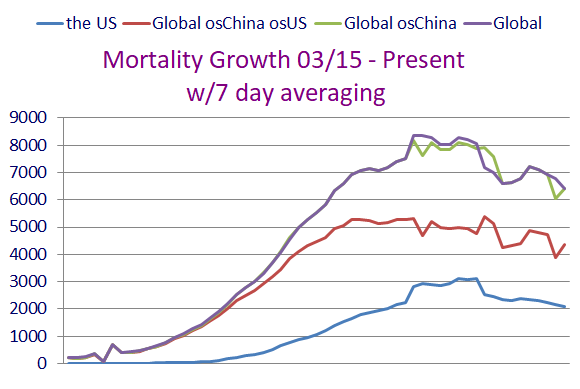
Each entity is showing progress there over the long haul. I will venture
to remark that this is not the prettiest back side of the curve I've seen.
Here, lets look at data for the U. S. broken out by itself.
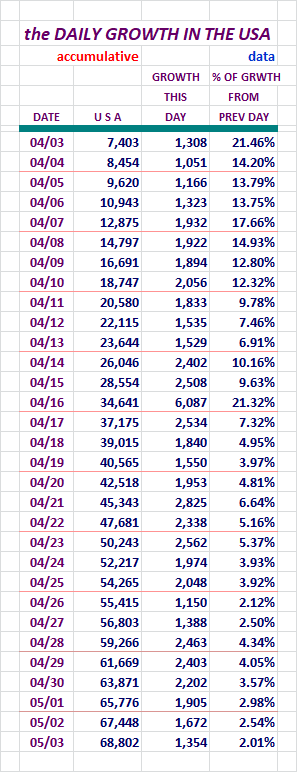
Our growth has decreased each day, down to 2.01% from 4.34% a few days ago.
Looking at it a different way, we've seen a 42.6% drop in growth
from four days ago.
While we seem to be repeating a pathway here, it is good to see us
moving lower in recent days.
Section: 06
Population Saturation
Here are figures revealing how many people in each population base represent one case.
I'm also showing what percent of each population base is infected at this time.
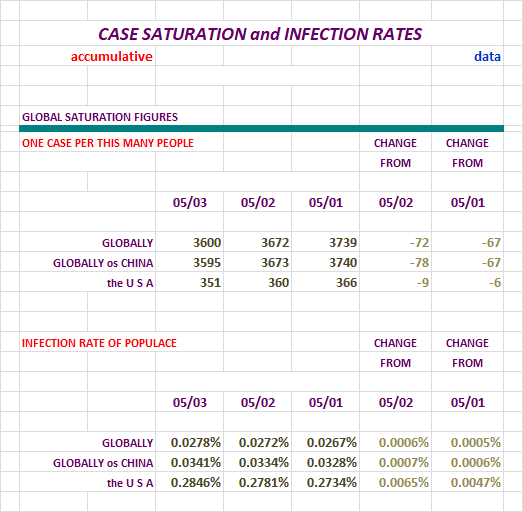
Things are not improving here. Each day we slip a bit more.
Nations With Lots of Cases
At the end of the day yesterday, there were:
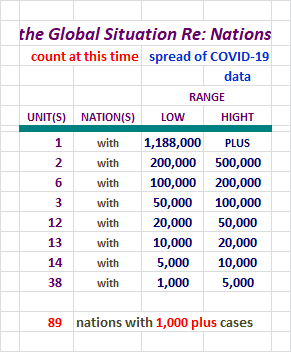
That's a whole lot of nations there. With over 1,000 in each one, we know
that over time they are potential declared cases time-bombs.
Daily Case Report Evaluation
I'll be keeping tabs on the daily tallies for days of the week for a while. Folks have
noticed some patterns of larger and smaller data entry on certaind days, and on Fridays
sometimes the numbers get noticably larger because of it.
And we now know Thurdays have potential to break out also. Yikes!
Let's check out the numbers and a chart.
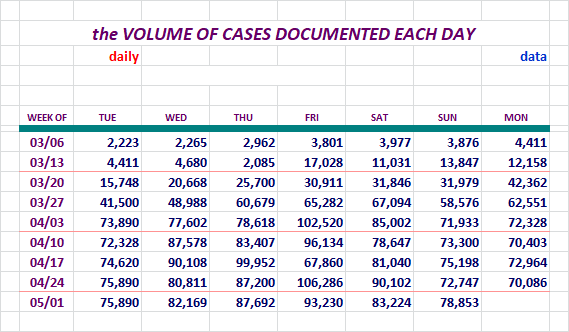
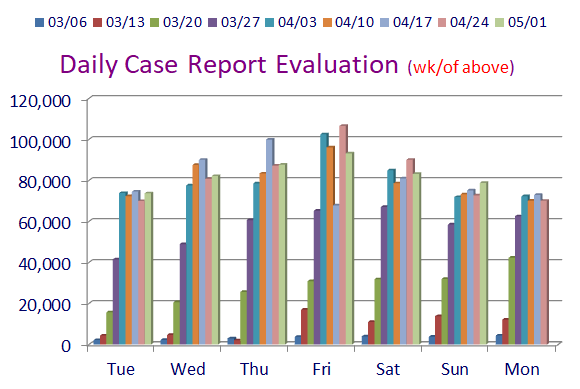
Well, the number of new cases added dropped again yesterday. Unfortunately it
was the highest Case day for a Sunday. Grrrrrrr.
Section: 07
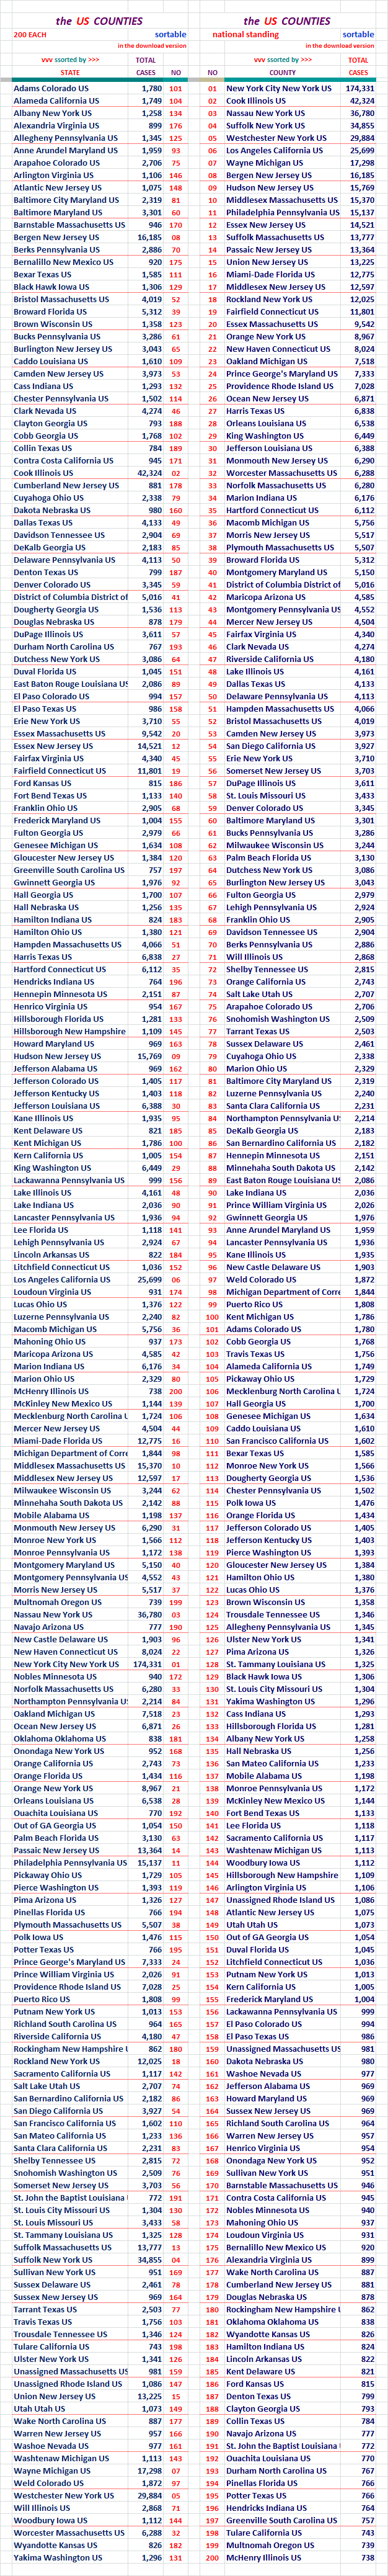
The Top 200 Counties in the U. S., by Number of Cases
This little report lists 200 Counties in the United States in declining Case numbers.
There is also a listing that is alphabetical. This report list only the entities
and the number of Cases in the two different sorts.
It will also be available as a downloadable Excel file in Section 12.
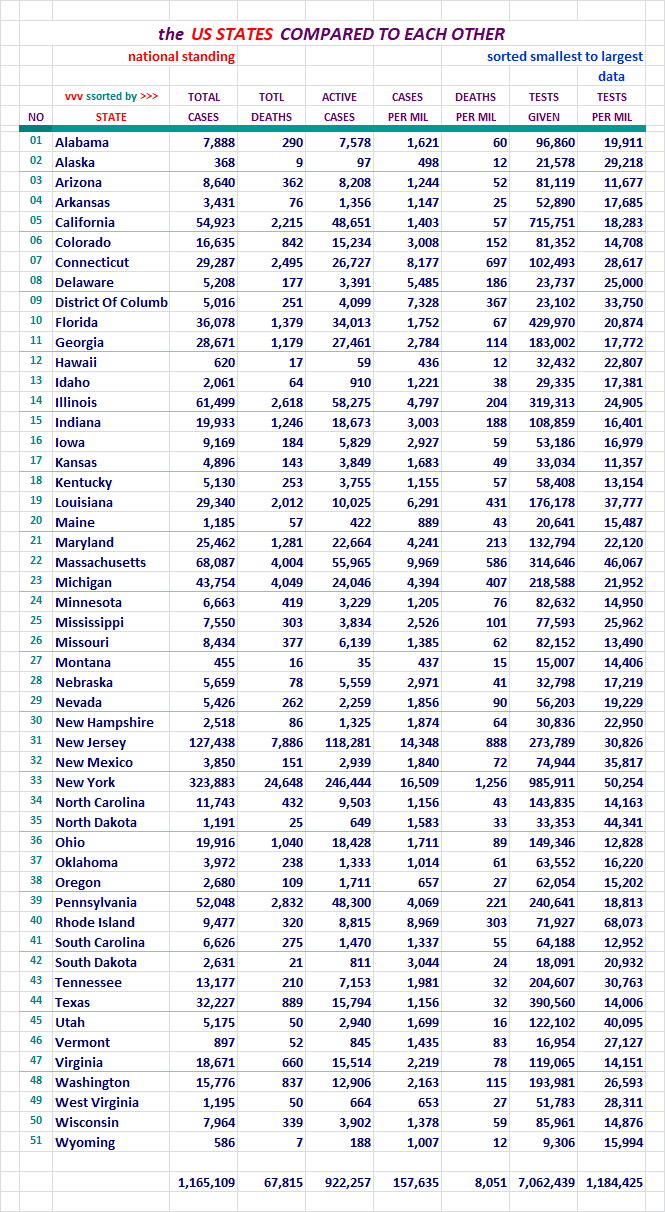
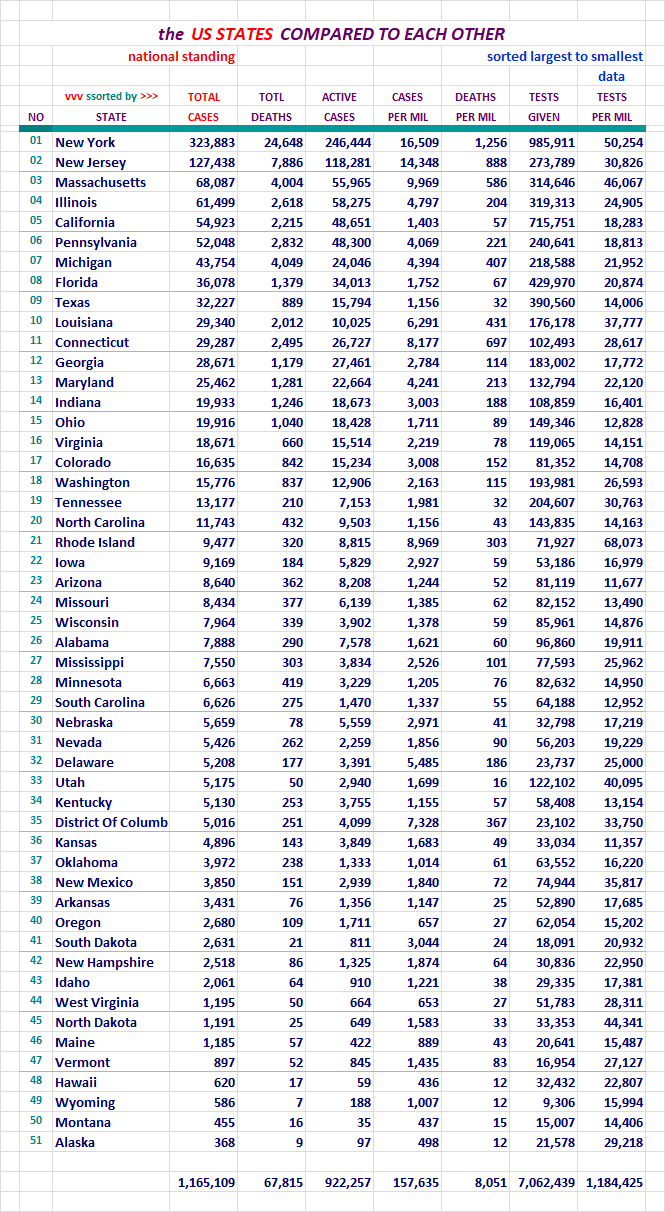
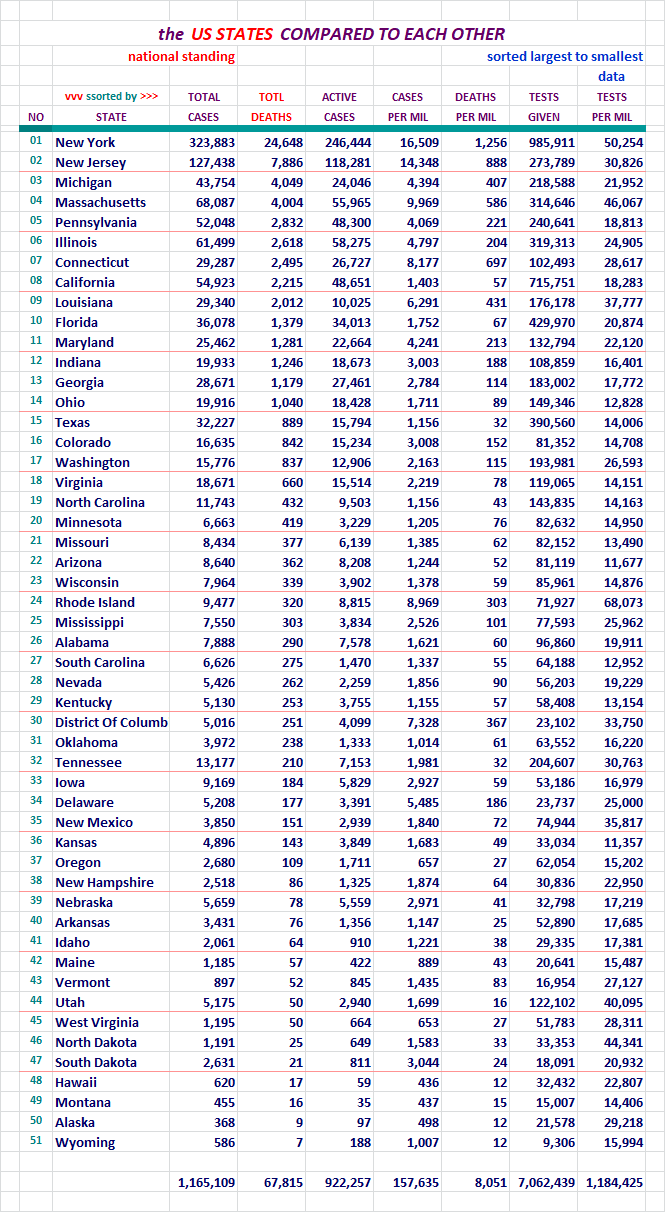
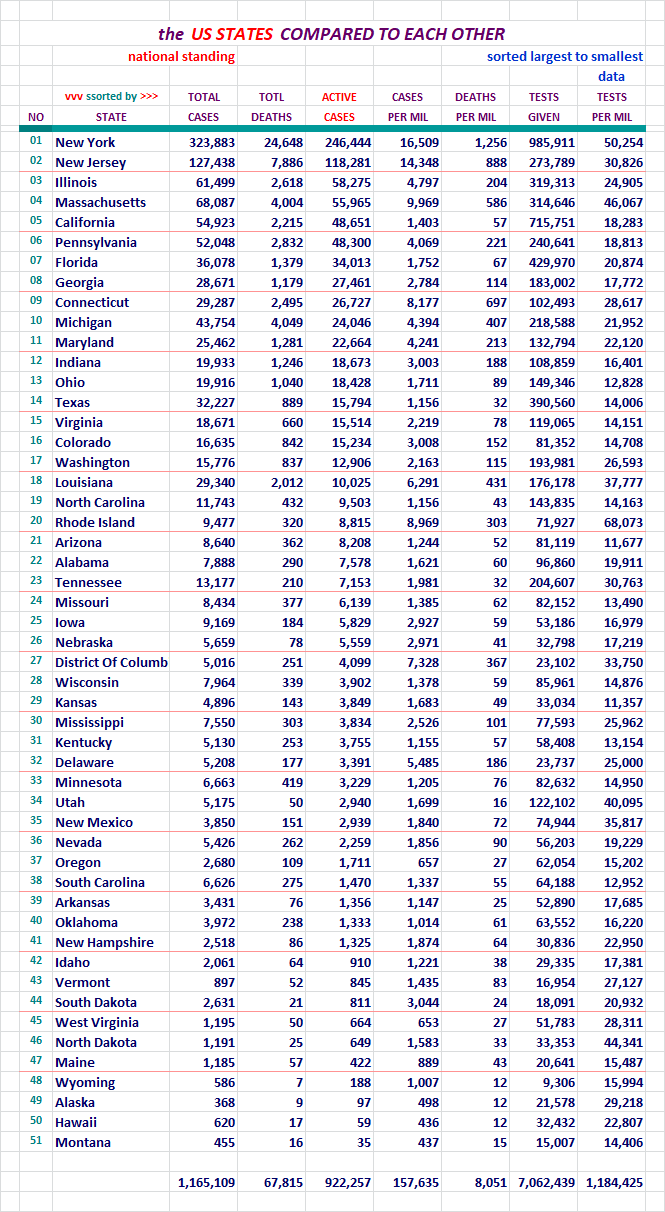
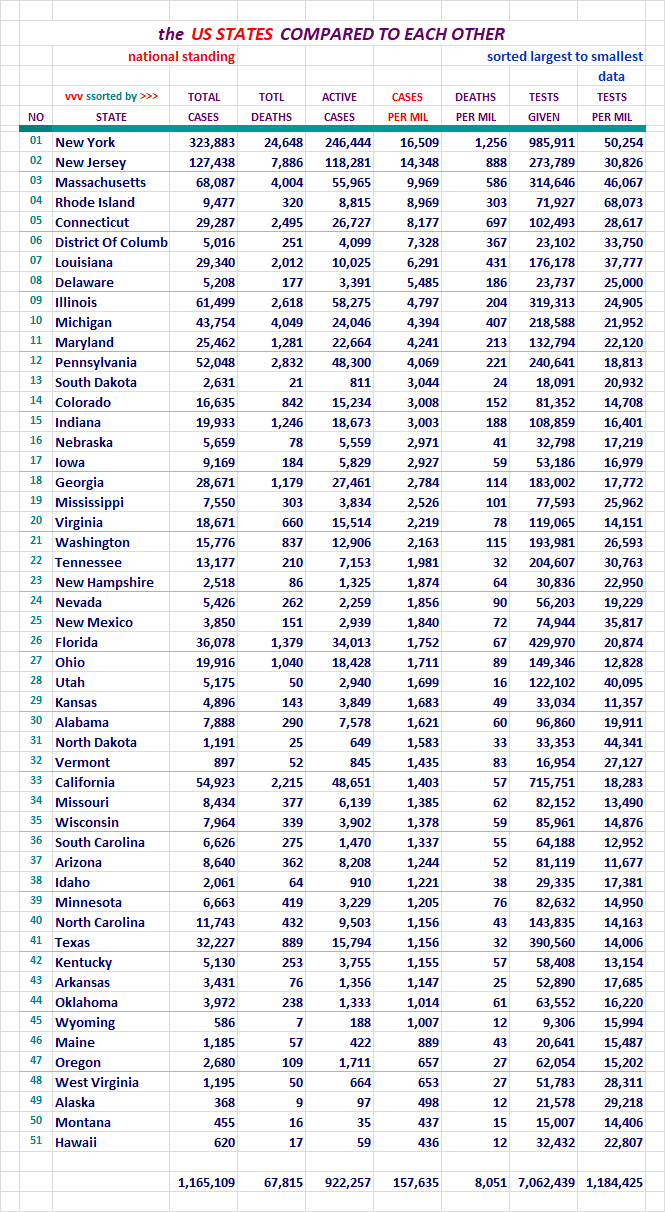
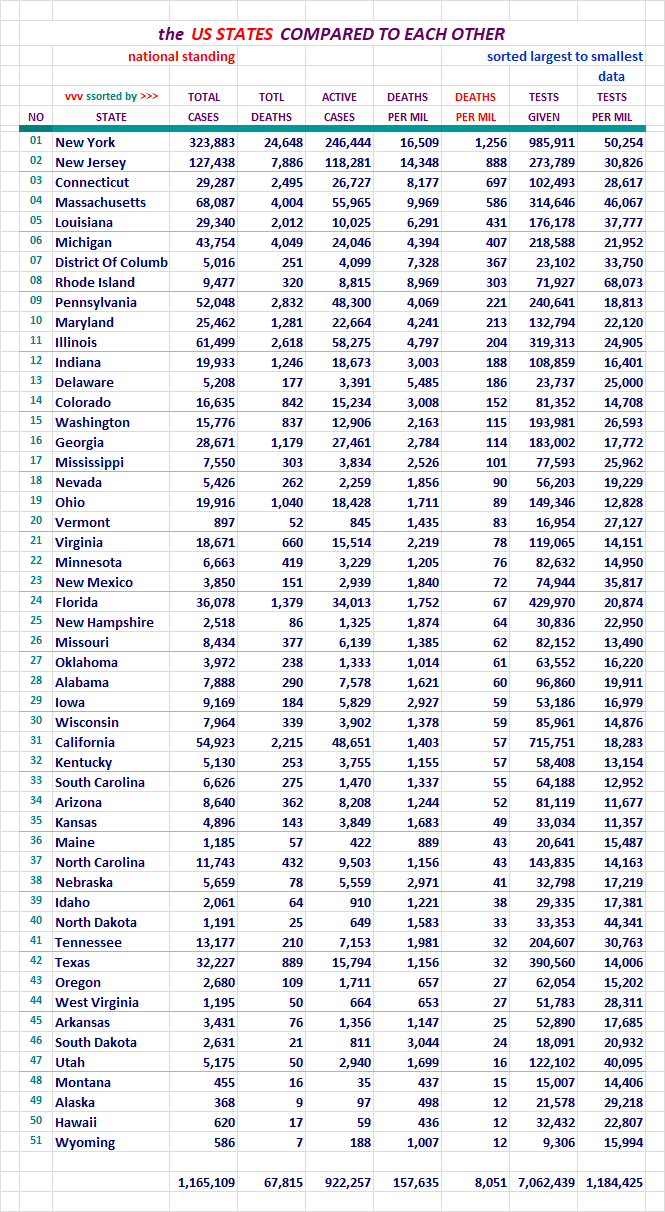
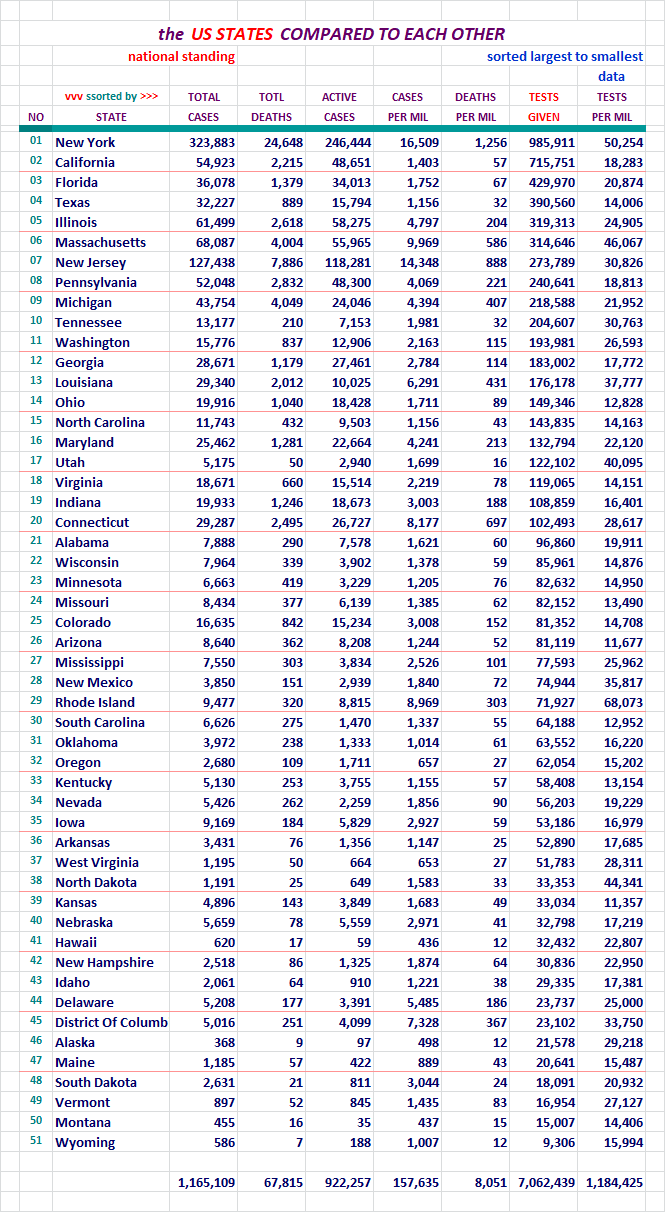
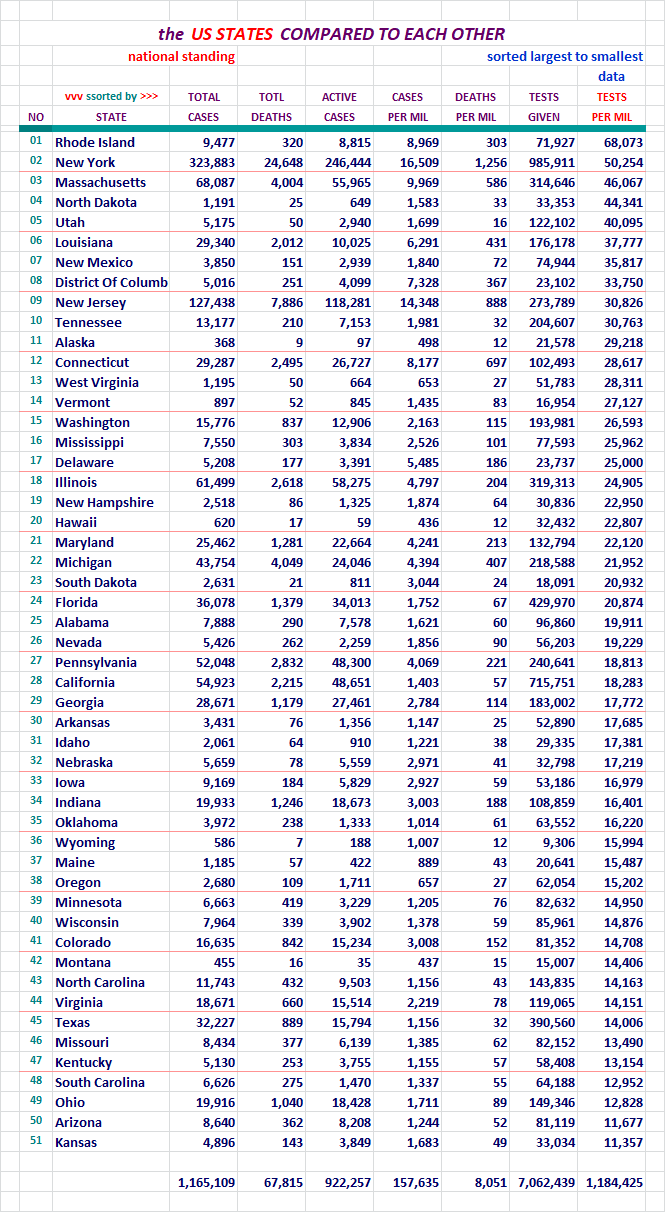
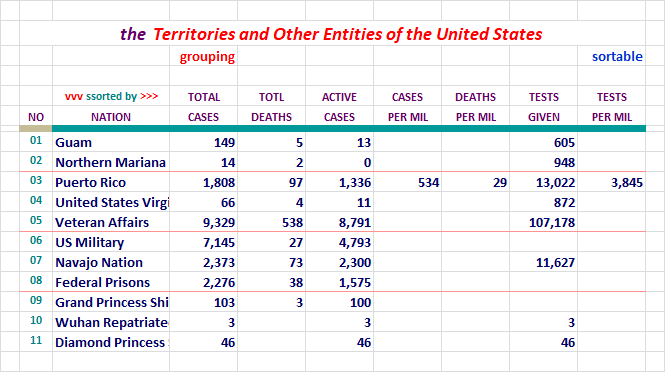
Section: 08
States of the Union and the District of Columbia, Compared to Each Other
Each of these pages is sorted differently. Look at the red header above
the columns to see which column was used for the sort on any given page.
For your review...
For your review...
For your review...
For your review...
For your review...
For your review...
For your review...
For your review...
Some interesting figures there for various segments.
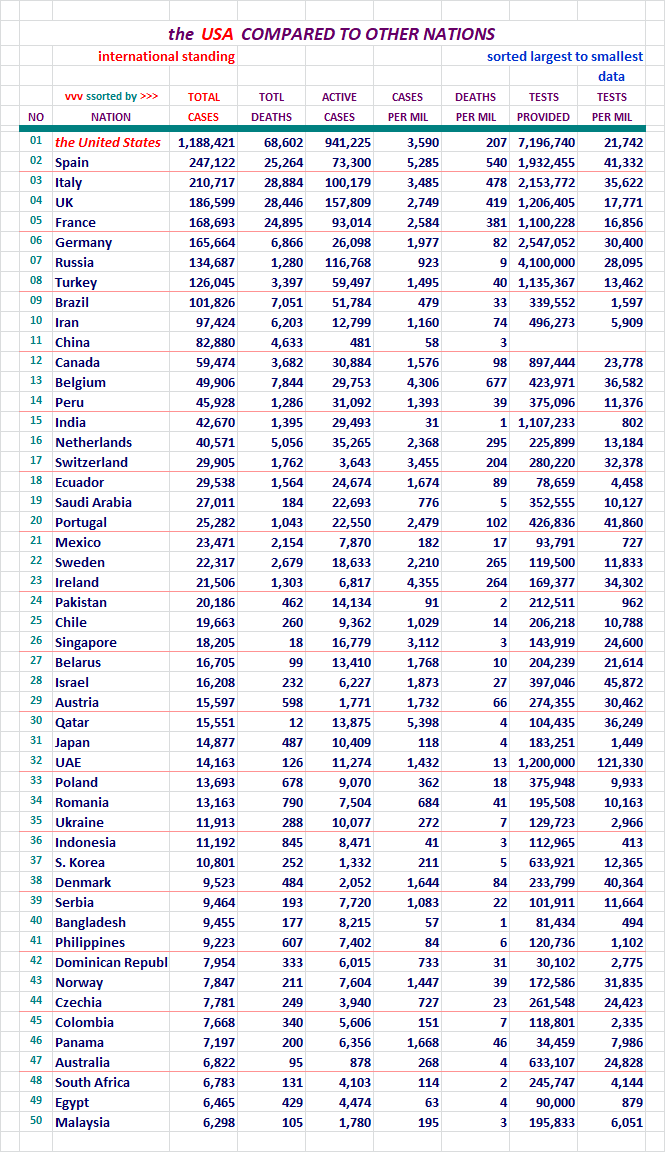
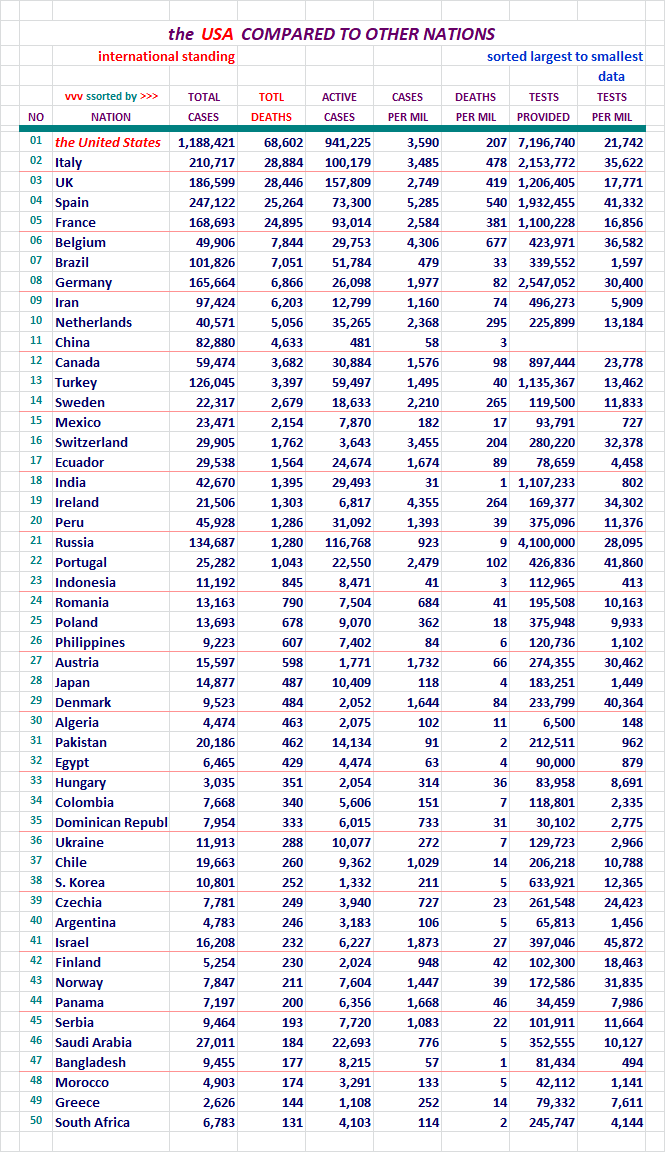
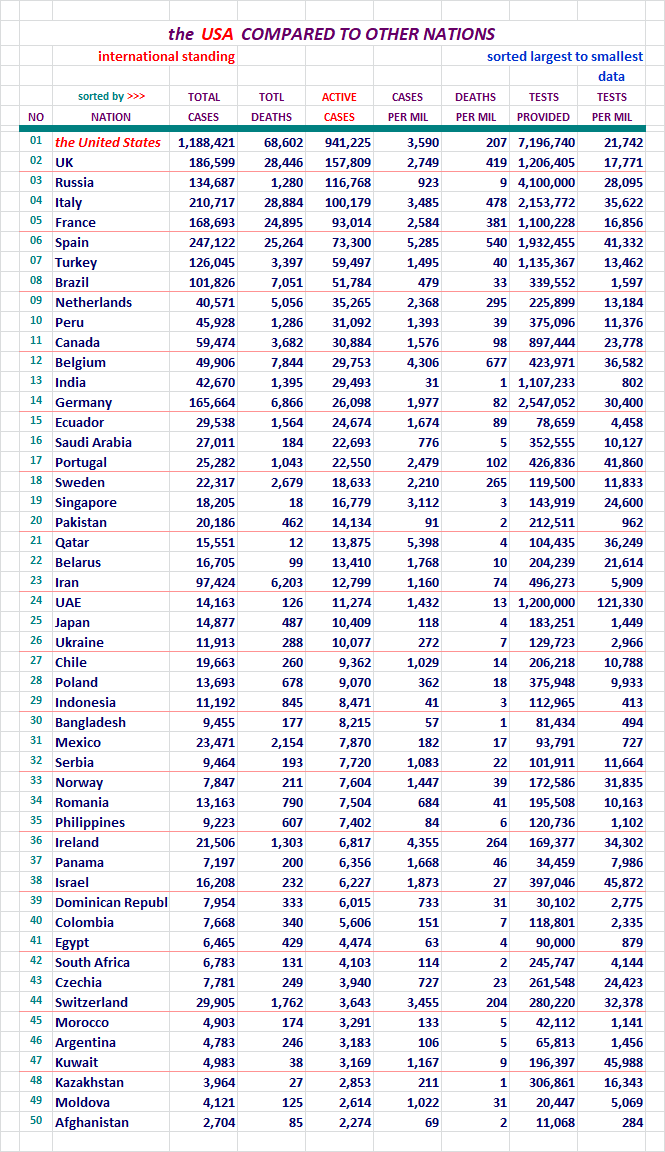
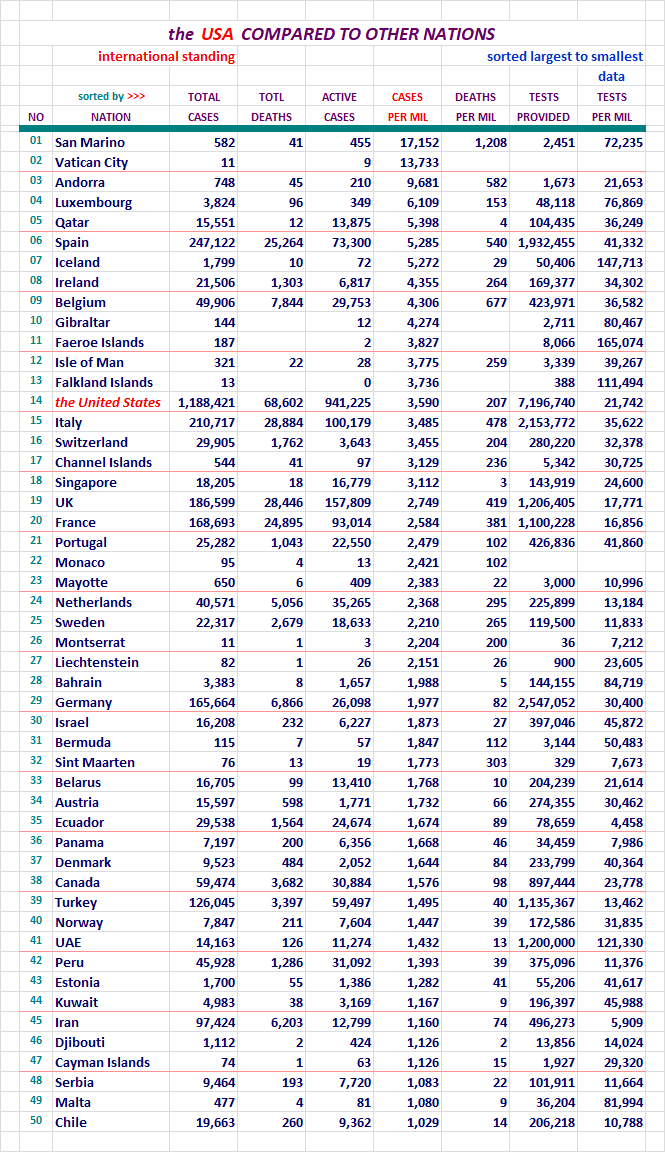
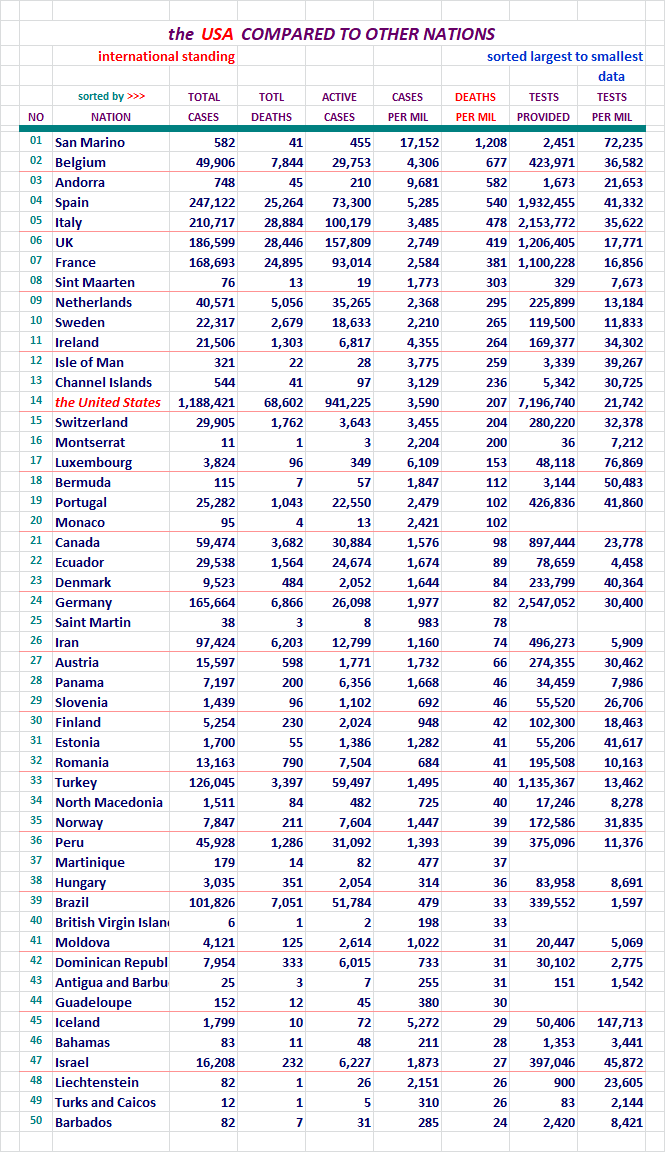
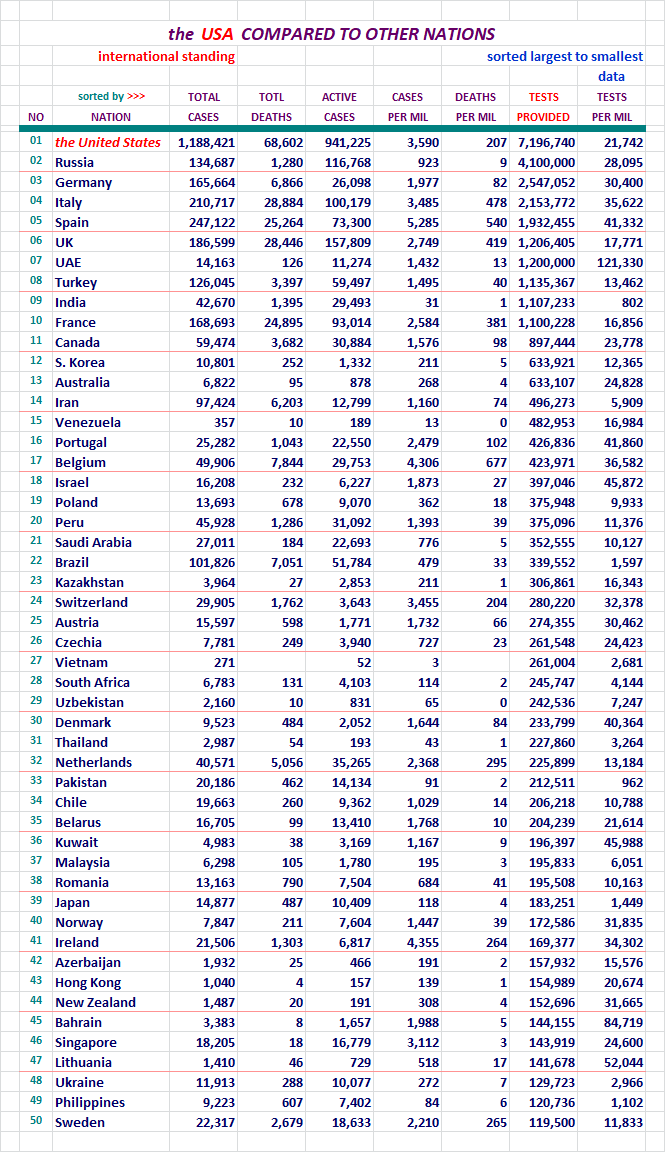
Section: 09
The United States, Where it Ranks With Other Natons?
Each of these pages is sorted differently. Look at the red header above
the columns to see which column was used for the sort on any given page.
The U. S. will be highlighted red here so we can find it easily in the list.
There were 212 nations on this list last night now. I didn't want to post
seven lists with 212 nations on it, so I picked the top 50. Coincidentally,
one report category has the U. S. at 41st, so it wasn't showing up on the
list with 31 top spots on it. That wasn't the reason why I extended the
list length, but it did work out well.
I work on the nations right next to the states on my spreadsheet. The
states with the Disctrict of Columbia come in at a total of 51 lines.
I decided to keep the international reports near that length, and 50
was good enough.
Here we go... for your review.
For your review...
For your review...
For your review...
For your review...
For your review...
For your review...
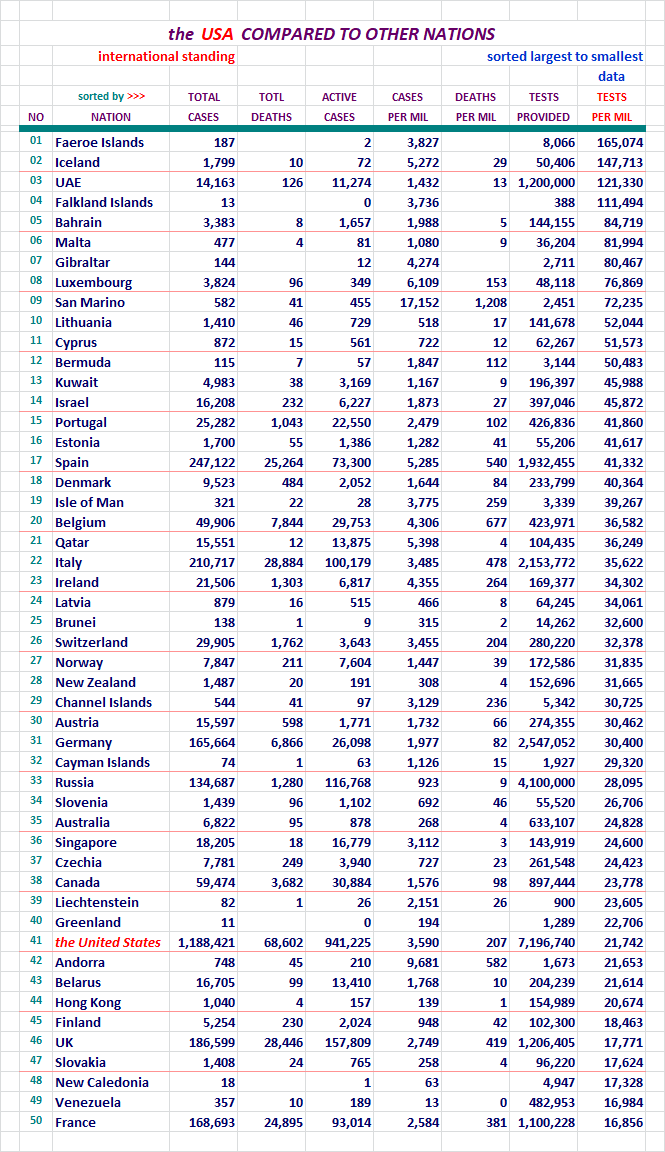
In the next day or two we'll have administered our seven millionth test.
We still can't seem to move up from the low 41st - 43rd position range. Drat!
Today we're sitting there at 42 with a big smile on our face.
Section: 10
Here's what it's all about. From January 20th to the present.
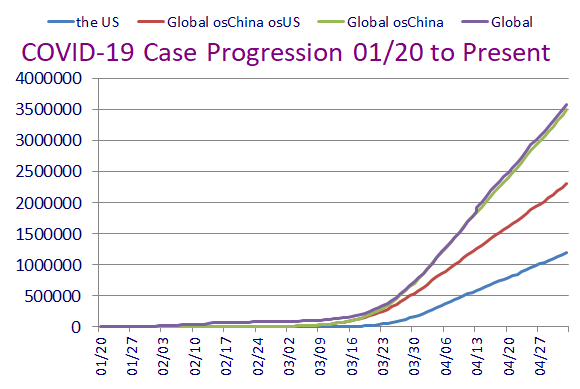
This concludes our look back at yesterday's data. Take care...

Section: 11
Data for this Report Sourced From:
LINK Johns Hopkins University
The Center for Systems Science and Engineering (CSSE)
LINK WorldoMeters
LINK You are Invited to Review My COVID-19 Spreadsheet (XLSX)
There is not an XLS version available for distribution at this time.
Section: 12
Other Features:
LINK US Counties200, States & DC51, Territories & Other Entities11, and Nations214
Four Excel Spreadsheet datasets you can sort for your own studies...
Section: 13
Links to other resources:
I cannot vouch for these sites. Please use your own discression.
LINK Adventist Health Coronavirus Resource Hub - Scroll down for useful info
LINK Antibiotic Vitamin, the (Vitamin D)
Good article on Vitamin D's likely role in prevention of infection. Thanks Blam.
LINK CDC Data for Download - Scroll down - Excel required. Includes death stats.
LINK CDC Secondary Data and Statistics - Portal Entry / Look around
LINK Coronavirus (COVID-19) Map
LINK Coronavirus infection risk may be reduced by Vitamin D
by Former CDC Chief Dr. Tom Frieden
LINK COVID-19 First U.S. Case, Treatment, features Remdesivir
New England Journal of Medicine article
LINK Cytokine Storm, med Actemra, Physician near death saved
LINK Diamond Princess Review at 634 Case Point of Eventual 712
LINK Hydroxychloroquine Article: International Poll
Daily Mail Reports, Most Effective Treatment According to 6,000 Physicians
LINK Hydroxychloroquine Has about 90 Percent Chance of Helping COVID-19 Patients
the Association of American Physicians and Surgeons, reports 91.6% of patients improved clinically
LINK IHME - Institute for Health Matrix and Evaluation
LINK National Institutes of Health - Cornavirus (COVID-19)
LINK Nazal Irrigation is the Key, COVID-19 Related
LINK New York City - interesting breakdown, burough, age, sex
LINK On the Origin of CCP Virus, A Documentary Movie (turn up the sound)
Epoch Times: I highly recommend this very well documented report.
LINK Rt COVID-19
Calculates and displays the Rt Factor for each state. Thanks FreedomPoster.
LINK World Health Organization

As of 5/3/2020, 47% of Covid deaths in NJ are nursing home related.
Unfortunately, there are still 21K active cases of Covid reported in NJ Long Term Care sites.
They are a very high risk and vulnerable population.
NJ.gov Covid dashboard for pdf on long term care reports.
Freegards.
new thread
Corona Virus Daily Thread #50 COVID-19 5/04/2020
http://www.freerepublic.com/focus/f-chat/3841483/posts
Looks like roughly half of US cases are NY & environs?
bttt
I have not posted graphs in a while, but someone was asking about my data. I think that your daily thread is a great place to find good data and analysis, so I will direct that person here.
On this image, I combined two graphs (and cut off the right side of the right graph, oops). These are graphed from worldwide numbers using the data compiled by Johns Hopkins. The left graph shows that numbers of cases, deaths, and recoveries continue to increase. As the pandemic is brought under control, I expect to see these numbers level out, with the cases leveling first. This particular graph will never show a downslope, since it is an accumulative graph. The right graph shows the daily change in cases, deaths, and recoveries. What I look for here is a decrease in the slope of the line that is drawn through the data. This graph shows that the daily numbers are not increasing as rapidly as they were a few weeks ago, which is good. This means that the infection control measures are working.
Other good trends are in the death and recovery rates. The death rate peaked at 7.137% on May 1 but has dropped slightly so that it is 7.032% today. Some of the change results from the weekly reporting cycle, in which data is not collected consistently every day. This is because laboratories have weekly schedules, which affects the analysis of samples and reporting of results. The good thing is that the death rate seems to have stabilized near the 7% mark; it is not steadily increasing as it had done up until Apr 24. The recovery rate continues to increase. Almost 1/3 (32.134%) of Covid-19 patients have now recovered.
 z
z
This graph is my modeling of disease growth, based on an R0 of 2.5 (this is how many people on average are infected by each sick person) and a round of infection lasting 9 days. The calculated numbers are in blue, and the real case numbers are in orange. Up until Apr 2, my model and the real case numbers matched quite well. However, by the next 9 day data point, the case numbers were falling off from what I had calculated. At the last data point collected on Apr 29, the difference between real and project had grown a lot, 14551915 projected vs. 3130191 actual. Or, the real number of cases was 21.5% of the projection. This is very good, since it shows how many cases would have resulted without quarantine measures, vs. how many are resulting now that quarantine policies have been in place for over a month. One of these days, I will revise the projections to highlight further changes in infection rates.
The reason I look at worldwide numbers rather than diving into details of specific places is because I am looking at the big picture. The pandemic is going to be problematic until it is controlled everywhere.
Disclaimer: Opinions posted on Free Republic are those of the individual posters and do not necessarily represent the opinion of Free Republic or its management. All materials posted herein are protected by copyright law and the exemption for fair use of copyrighted works.