New cases down today too. But too soon to see if daily new cases have peaked. Need to watch all week.
I don’t believe the count is in from many states.
But as for the log graph of the number of cases, the curve is definitely flattening.
Looks suspicous. Table of states has no increases and usually does. I usually wait for the next day to use these numbers. They change overnight sometimes.
Like I said, come Monday I have no idea. They were hanging crepe this evening and now this? It’s almost on the verge of statistical improbability. What was it yesterday? 525? Half of that? A Unicorn just flew over my house.
Looking at the entire country at once is silly in many ways. This thing is very local. In Eastern King County Washington we were the first to have cases noticed in this country. We have half a million Chinese immigrants living here and many of them go back to China frequently. Deaths in this part of the county appear to have peaked even while the rest of the state is having more. Our Hospital Intensive Care Units are back to normal. So even a look at the entire state gives a false impression about what we are experiencing in Eastern King County.
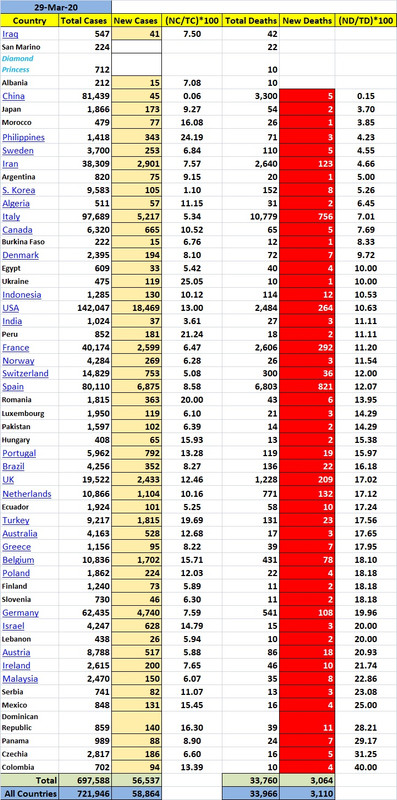
Deaths: 2,484
Recovered: 4,559
Active cases: 135,027
The number of Recovered cases is roughly two weeks behind the number of active cases because two weeks is the typical duration of the illness.
So, the number of Recovered cases should skyrocket accordingly while the number of Active cases plummets.
Any good news will be met with a stern rebuke, and new horror stories of suffering and mayhem from COVID-19!
It is truly a sight to behold! We have FReepers who will pour cold water on any and all reports on anything positive on the Coronavirus front. Even the positive reports on the drugs that are showing great results in fighting Coronavirus are met with skepticism and hopelessness. You’d think some here get their marching orders from the msm!
New York is way down. Last week they were posting 10k-12k new cases per day. Now they are well below 10k.
Bookmark.
Thanks for the post.
Incomplete data...”Worldometer” is kinda hit & miss on their sources of data...they eventually get the #’s close but are usually delayed (3/29 not over yet & certainly not reported by medical authorities yet). Better source of data here: https://covidtracking.com/us-daily/ They are showing 463 fatalities so far today (3/29).
Tell me this, why was the spread in Asia so limited? China’s per capita level is really low. It didn’t spread much beyond the epicenter it seems. South Korea is higher on the per capita level but below Europe, Iran and the U.S. We know they did have a great policy of testing and quarantine.
But also look at Hong Kong, Taiwan, Japan, Philippines, Singapore. Many below the per capita average of cases by country. No explosion in cases like we saw in Europe and are seeing in New York. And many of these are very densely populated countries. You can’t tell me Chinese people weren’t traveling around Asia as much as they were in Europe and the U.S.
So how did Asia at large escape what’s happening in Europe and New York? Is it possible something similar to this virus has existed in animals in Asia going back to pre-history, occasionally crossed over into humans, and that there may be some natural genetic immunity built into people of Asian descent?
Today’s numbers are not in until tomorrow!
While New York looks like the worst place to be, DC with it's massive rank differential may be a close second. The top of the bad are New York, New Jersey, Louisiana, Massachusetts, Washington, District of Columbia, Michigan and Connecticut. The best place to be seems like North Carolina, Texas, and Virginia due to their rank differential in a positive way (i.e., lower adjusted rank vs population rank). The best of the good are Nebraska, West Virginia, Texas, South Dakota, Minnestoa and Virginia.
| State | Population (MM) | Confirmed Cases Mar 27 | Cases per 100,000 people | Rank, Confirmed Cases | Rank, Cases per 100,000 people |
| Alabama | 4.9 | 720 | 14.7 | 25 | 27 |
| Alaska | 0.7 | 102 | 13.9 | 48 | 30 |
| Arizona | 7.4 | 773 | 10.5 | 22 | 39 |
| Arkansas | 3.0 | 409 | 13.5 | 31 | 33 |
| California | 39.9 | 5565 | 13.9 | 3 | 29 |
| Colorado | 5.8 | 2061 | 35.3 | 13 | 9 |
| Connecticut | 3.6 | 1524 | 42.8 | 14 | 8 |
| Delaware | 1.0 | 214 | 21.8 | 39 | 17 |
| District of Columbia | 0.7 | 342 | 47.5 | 34 | 6 |
| Florida | 22.0 | 4038 | 18.4 | 7 | 20 |
| Georgia | 10.7 | 2447 | 22.8 | 11 | 13 |
| Hawaii | 1.4 | 151 | 10.7 | 44 | 38 |
| Idaho | 1.8 | 261 | 14.3 | 37 | 28 |
| Illinois | 12.7 | 3547 | 28.0 | 8 | 11 |
| Indiana | 6.7 | 1232 | 18.3 | 17 | 21 |
| Iowa | 3.2 | 298 | 9.4 | 35 | 42 |
| Kansas | 2.9 | 271 | 9.3 | 36 | 43 |
| Kentucky | 4.5 | 394 | 8.8 | 32 | 45 |
| Louisiana | 4.6 | 3315 | 71.4 | 9 | 3 |
| Maine | 1.3 | 211 | 15.7 | 41 | 24 |
| Maryland | 6.1 | 1066 | 17.5 | 18 | 23 |
| Massachusetts | 7.0 | 4257 | 61.0 | 6 | 4 |
| Michigan | 10.0 | 4635 | 46.1 | 4 | 7 |
| Minnesota | 5.7 | 441 | 7.7 | 30 | 47 |
| Mississippi | 3.0 | 669 | 22.4 | 26 | 15 |
| Missouri | 6.2 | 838 | 13.6 | 21 | 31 |
| Montana | 1.1 | 147 | 13.5 | 45 | 32 |
| Nebraska | 2.0 | 122 | 6.2 | 46 | 51 |
| Nevada | 3.1 | 738 | 23.5 | 24 | 12 |
| New Hampshire | 1.4 | 214 | 15.6 | 39 | 25 |
| New Jersey | 8.9 | 11124 | 124.5 | 2 | 2 |
| New Mexico | 2.1 | 208 | 9.9 | 43 | 40 |
| New York | 19.4 | 53363 | 274.5 | 1 | 1 |
| North Carolina | 10.6 | 972 | 9.2 | 20 | 44 |
| North Dakota | 0.8 | 94 | 12.3 | 49 | 35 |
| Ohio | 11.7 | 1406 | 12.0 | 15 | 36 |
| Oklahoma | 4.0 | 377 | 9.5 | 33 | 41 |
| Oregon | 4.3 | 479 | 11.1 | 29 | 37 |
| Pennsylvania | 12.8 | 2815 | 22.0 | 10 | 16 |
| Rhode Island | 1.1 | 239 | 22.6 | 38 | 14 |
| South Carolina | 5.2 | 660 | 12.7 | 27 | 34 |
| South Dakota | 0.9 | 68 | 7.5 | 51 | 48 |
| Tennessee | 6.9 | 1373 | 19.9 | 16 | 18 |
| Texas | 29.5 | 2161 | 7.3 | 12 | 49 |
| Utah | 3.3 | 608 | 18.5 | 28 | 19 |
| Vermont | 0.6 | 211 | 33.6 | 41 | 10 |
| Virginia | 8.6 | 740 | 8.6 | 23 | 46 |
| Washington | 7.8 | 4311 | 55.3 | 5 | 5 |
| West Virginia | 1.8 | 113 | 6.4 | 47 | 50 |
| Wisconsin | 5.9 | 1042 | 17.8 | 19 | 22 |
| Wyoming | 0.6 | 84 | 14.8 | 50 | 26 |
Worldometer:
3/27 1696 +401
3/28 2221 +525
3/29 2484 +264
Wikipedia
3/27 1591 +432
3/28 2038 +438
3/29 2424 +385
Bttt
Sunday is always down, then there is a jump on Monday. Staffing. That’s happened the last 2 weekends.
It would be nice if that weren’t the case this weekend.
The problem is the death rate drop needs to follow the case rate drop. A drop in the death rate now tells us that the full data hasn’t been collected for the day.
If that’s true, we’ll see a big jump tomorrow. I’d like to be wrong, but I just don’t see it in the numbers.
The problem is the death rate drop needs to follow the case rate drop. A drop in the death rate now tells us that the full data hasn’t been collected for the day.
If that’s true, we’ll see a big jump tomorrow. I’d like to be wrong, but I just don’t see it in the numbers.
Same think happened on Mar 21.
One day is not a trend. Especially on a weekend.