Thanks for posting this!
I went back to re-post the graphic AZLiberty had posted earlier. It kind of got lost after the POTUS presser
Very important! This should help to bring some peace to those worried about the killer kung-flu. It's the flu, folks.
Be prepared to dispense red-pills. This is one of them.
Very important! This should help to bring some peace to those worried about the killer kung-flu. It's the flu, folks.
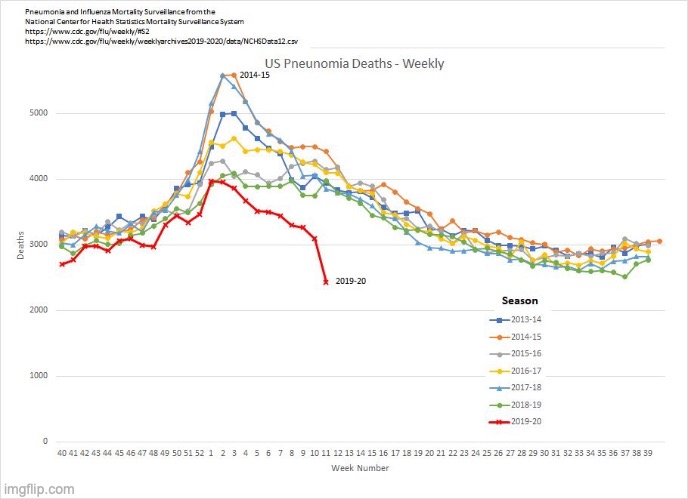
Be prepared to dispense red-pills. This is one of them I liked this chart and was curious to see if the number of pneumonia deaths went even lower the following week. Since this graph was made from a comma-separated Excel file located at https://www.cdc.gov/flu/weekly/weeklyarchives2019-2020/data/NCHSData12.csv, I downloaded it, and then changed the name of the file to read NCHSData13.csv, and downloaded that.
What I found was that apparently there is a lag in the data getting to the CDC, and as it comes in the previous weeks are updated. So in the Data12.csv file the week 11 value was a very low 2431, and the previous week (week 10) had a value of 3092, in the Data13.csv file the week 10 value was updated to 3404 and week 11 to 3203. The latest week (week 12) is added at a value of 2930.
My point is that the dropoff of the values is apparently normal, reflecting the amount of time for all pneumonia deaths to be reported to the CDC, and is not a proof that they are simply relabeling pneumonia deaths to CoViD-19 deaths.
I was hoping to see it had fallen even lower, but thought I would point this out before we are accused of cherry-picking the data to get a result we wanted. I don't know how to create the graph from the data, or I would have posted that, since it would be easier to see my point.