Free Republic
Browse · Search
General/Chat
Topics · Post Article

To: mass55th

13 posted on 04/10/2021 9:58:57 PM PDT by MinorityRepublican
[ Post Reply | Private Reply | To 9 | View Replies ]


To: MinorityRepublican

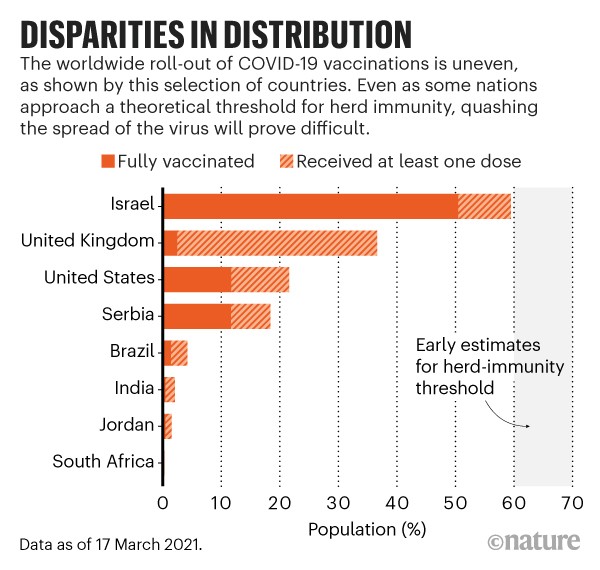
This chart would look considerably different if it were updated from the March 17th situation that it reflects. For example, as of 6:00am on April 11th, the percent of the total American population that had received at least the first vaccine dose was 35.3% instead of the slightly over 20% reflected in the March 17th chart. Things are improving VERY rapidly in America on the vaccination front.


28 posted on 04/10/2021 10:15:46 PM PDT by House Atreides
[ Post Reply | Private Reply | To 13 | View Replies ]

To: MinorityRepublican

That is a totally dishonest graphic as it completely ignores the many who have had Covid.


78 posted on 04/11/2021 1:53:21 AM PDT by FreedomPoster (Islam delenda est)
[ Post Reply | Private Reply | To 13 | View Replies ]

Free Republic
Browse · Search
General/Chat
Topics · Post Article


FreeRepublic, LLC, PO BOX 9771, FRESNO, CA 93794
FreeRepublic.com is powered by software copyright 2000-2008 John Robinson