Here are the breakdowns by age:


Here are the breakdowns by gender:


Posted on 05/02/2014 6:53:01 AM PDT by SeekAndFind
RE; The Chart of Civilian Labor Force Participation Rate.
What factor accounts for most of the drop?
Retirements (i.e., aging labor force ) or simple discouragement (i.e. inability to find a job )?
Of course, it would be helpful if there were another chart showing the increase/decrease of the AGE GROUP dropping out.
Amen bros….especially the part about which side of the cause/effect/solution process jobs to America is. Jobs here cannot solve anything, but solving a number of things will result in jobs here period, end of discussion. It’s the dyamic nature of liberty, freedom, human nature, in action.
The boomers weren’t supposed to all retire at the same time.
Here is a projection from 2005:
http://www.cse.sc.edu/~buell/References/BureauLaborStatistics/art3full2014.pdf
Using the data they had available in 2005, they predicted the civilian labor force to grow for 147.4 million to 162.1 million in 2004.
Current DOL stats show it only has grown to 154.8 million...fully 50% off their mark. Now remember, retiring boomers was not a secret in 2005 - that was factored into this projection.
I strongly suspect that projections that are made about the solvency of social security and medicare and pension funds are predicated on a participation model that does not drop off this sharply. So this is a big problem, and part of the employment picture that should be mentioned, alongside the cheerleading that the UE rate went down.
Use the map link at the top of the page, and go from there. State maps showing rates by county are available.
Well said sir, but some people don’t want to face the facts you laid out….
Here are the breakdowns by age:
Here are the breakdowns by gender:
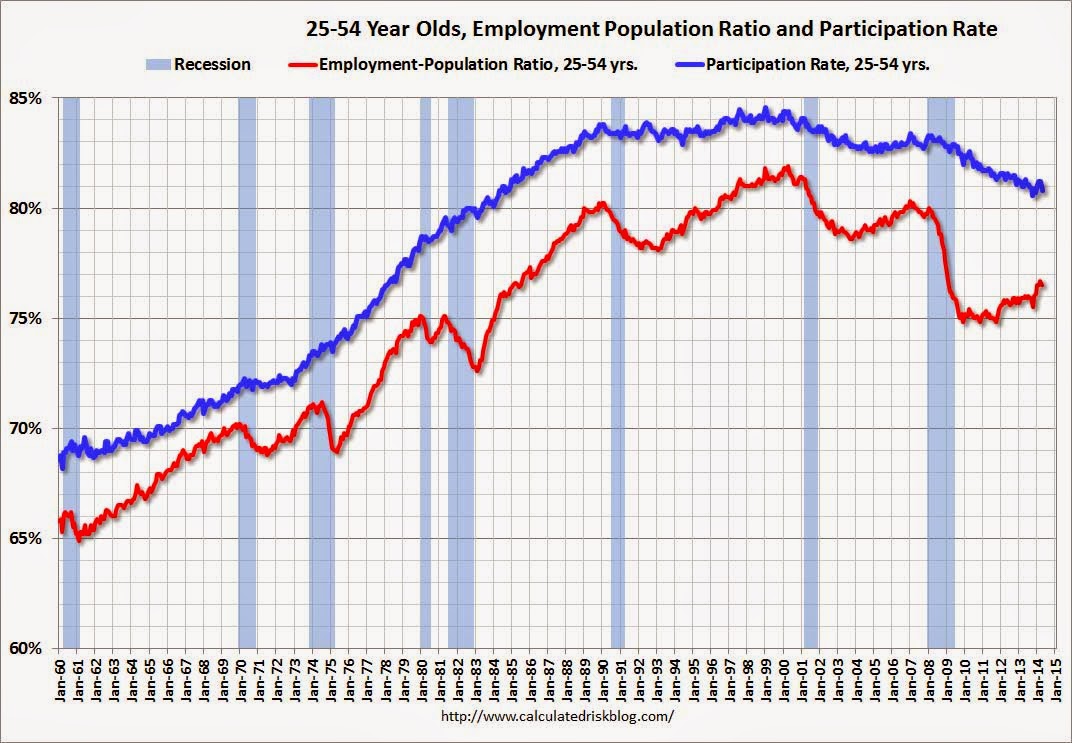
Employment-Population Ratio, 25 to 54 years old
Employment Population Ratio, 25 to 54Since the overall participation rate declined recently due to cyclical (recession) and demographic (aging population, younger people staying in school) reasons, an important graph is the employment-population ratio for the key working age group: 25 to 54 years old.
In the earlier period the employment-population ratio for this group was trending up as women joined the labor force. The ratio has been mostly moving sideways since the early '90s, with ups and downs related to the business cycle.
The 25 to 54 participation rate declined in April to 80.8% from 81.2% in March, and the 25 to 54 employment population ratio decreased to 76.5% from 76.7%. As the recovery continues, I expect the participation rate for this group to increase.
Read more at http://www.calculatedriskblog.com/2014/05/comments-on-employment-report.html#rymCZVJhceGum8Tc.99
That's a good trick. Jobs are growing in a shrinking economy.

I think many need a reminder:
http://www.laffercenter.com/supply-side-economics/
Supply-Side Economics
Supply-side economics emphasizes economic growth achieved by tax and fiscal policy that creates incentives to produce goods and services. In particular, supply-side economics has focused primarily on lowering marginal tax rates with the purpose of increasing the after-tax rate of return from work and investment, which result in increases in supply.
The broader supply-side policy mix points to the importance of sound money; free trade; less regulation; low, flat-rate taxes; and spending restraint, as the keys to real economic growth. These ideas are grounded in a classical economic analysis that understands that people adjust their behavior when the incentives change. Accordingly, the lower the regulatory and trade barriers, and the lower and flatter the tax rate, the greater the incentive to produce.
The supply-side approach stands in sharp contrast to economic theories that held sway from the 1930s through the 1970s which were preoccupied with boosting demand, ideas most closely associated with economist John Maynard Keynes and his publication of The General Theory. These ideas enjoy a resurgence today as growth in spending, along with growing government involvement in the economy, has given new life to Keynesian ideas. Indeed, the idea of government spending as a stimulus to help boost demand and consumption, is rooted in quintessentially Keynesian ideas.
Yet in the roughly 30 years from the 1980s through the first decade of the new century, supply-side ideas contributed to the longest boom in United States history and an incredible transformation of the world economy. According to the National Bureau of Economic Research, 1982-1999 was one continuous mega-economic expansion. In fact, as it stretched into 2007, this 25 Year Boom saw a tripling in the net wealth of U.S. households and businesses from $20 trillion in 1981 to $60 trillion by 2007. When adjusted for inflation, more wealth was created in this 25 year boom than in the previous 200 years.
This sustained economic growth is not only impressive on its own, but even more astonishing as it compares to the period immediately preceding it. In the 10 years from 1972-1982, recessions were deep and recoveries were short. In fact, throughout American history, the nation’s economy has been in recession or depression roughly one-third of the time. But from 1981-2005, the annual growth rate of real gross domestic product (GDP) in the U.S. was 3.4 percent per year, and 3.8 percent per year during the 1983-1989 Reagan expansion alone.

Dent explains the chart above....
The Dent Research Employment Index, a propriety system developed to gauge the quality of government-issued employment statistics, highlights the poor quality of the jobs created last month. Of the 273,000 private sector jobs created, most were skewed to the lowest rungs on the income ladder, which won’t help the economy grow.
“By emphasizing quality as well as quantity, we get a much better picture of the overall employment situation,” said Rodney Johnson, creator of the index and co-founder of Dent Research. “Most people focus solely on the total number of jobs added each month, but one or even two numbers can’t tell the whole story. In fact, looking at employment through such a narrow lens can be very misleading. That’s why we developed the Dent Research Employment Index.”
Dent Research examines all the private sector jobs added during a given month across 84 different employment categories by wage. These are then grouped into 12 larger buckets. By measuring those additions against the existing spread of wages in the economy, the Dent Index provides great insight into the quality of U.S. monthly job growth. In short, are we dragging the overall income of America down, or lifting it up?
For the month of April, 2014, the non-farm payroll, excluding government positions, added 273,000 jobs. While this far exceeded even the highest expectations, the Dent Index reveals that nearly 55% of the newly-added jobs were below the median wage, and a full 43% fell into the lowest three tiers of income. (See graphic below.) These jobs contribute less to economic growth and, therefore, are less indicative of improvement in the overall employment situation.
288k jobs does not cause employment nubers to go up, just to maintain an even number about 350k must gain employement weekly, the only reason the unemployment number is going down is because the folks that have been looking for work for so long have fallen out of the numbers.
Again, to just keep unemployment stable, you must hire about 300-350k a week, anything less than that and you are losing ground.
Apples and oranges... In short (and overly simplistic), the 320 initial claims are more than offset by hiring. As everyone knows, thousands and thousands of people are hired and fired every day. The +288K is the “net” job additions.
EXCEPT, we know they are lying, and should do all we can do to encourage conservative voters to turn out in droves!
We can do this, but we will have to work for it!
Like I said.
We badly need to return manufacturing to America.
Here...go to post #23 on this thread, and click on the URL he posted. The page will be non-responsive (we all know that now). In the upper right corner of the page is the BLS search box. Type in “labor participation rate” (without the quotes). This will produce a BLS search result page.
Click on the first one listed (it features the URL I gave you in my response).
Voila! There is the desired page!
But, boy - they're really making us work for it, aren't they?
CA....
How else could they get labor to participate?
Disclaimer: Opinions posted on Free Republic are those of the individual posters and do not necessarily represent the opinion of Free Republic or its management. All materials posted herein are protected by copyright law and the exemption for fair use of copyrighted works.