
Posted on 08/06/2014 5:34:42 PM PDT by Kaslin
Here's a look at some interesting demographics, comparing 2003 vs. 2013.
Number of Households by Age of Head of Household 2013 vs. 2003
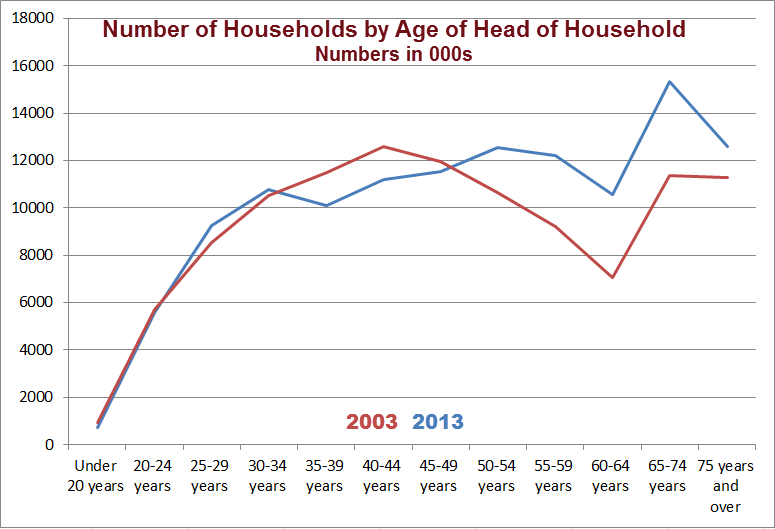
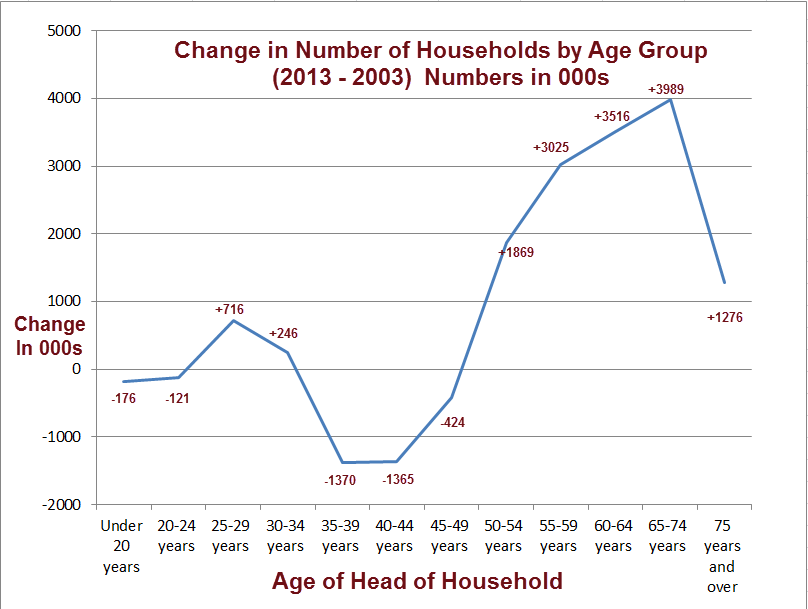
The next chart shows the change in number (in thousands), in the age of the head of household.
Change in Households by Age Group (2013 Minus 2003)
click on any chart for sharper view
I created the above charts from spreadsheet data reader Tim Wallace sent. The data is from the Census Department 213-page PDF 2013 Annual Social and Economic (ASEC) Supplement.
Two Key Points
And those are just heads-of-households, not individuals. The individual total would be much higher.
Aging boomers accounts for much but not all of the decline in labor force and participation rate. The recession made matters worse.
Finally, some of the semi-retired, only want to work part-time, explaining part of the surge in part-time employees.
We will have more charts of education levels, household wealth, and other items shortly.
bookmark bump
Interesting population data ping.
Disclaimer: Opinions posted on Free Republic are those of the individual posters and do not necessarily represent the opinion of Free Republic or its management. All materials posted herein are protected by copyright law and the exemption for fair use of copyrighted works.