I based that statement on the rise and fall of daily changes in case counts. It is a speculation meant to temper any excitement over a daily case increase that appears to have decreased by a large amount. A daily drop can reflect daily fluctuations in testing rather than an actual drop in the development of new cases. One reason there can be a drop is that weekends tend not to be as active as weekdays when conducting lab testing.
Anyway, below is my graph which shows the daily change in cases. The fact that daily fluctuations are seen in total and active cases, but not in deaths or recovered cases, is what leads me to believe that there are daily fluctuations in testing.
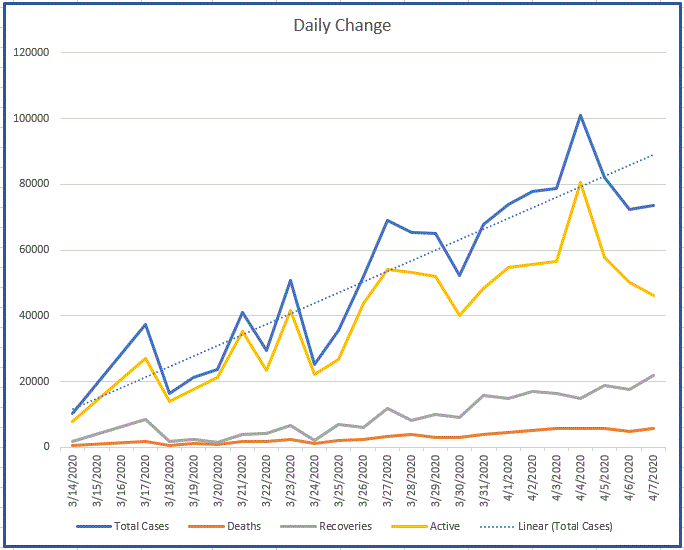
Notice that on the right side of the graph, that the diagnosis of new cases appears to be decreasing. It would be great if real, but I don't want to get hopes up. Hence, the caveat about weekend testing.
“Anyway, below is my graph which shows the daily change in cases.”
Thanks for the feedback. I’m not sure I understand, though. As an example, on the graph you posted it shows approximately 100,000 “Total Cases” and approximately 80,000 “Active Cases.” I don’t see those numbers anywhere on the chart I posted (here: https://bit.ly/2Xfs9s2 ). On the chart I posted on 4/4/20 I am showing a total of 311,357 total U.S. cases and 34,196 new cases for that day.
Maybe that is the disconnect.
Can you clarify?
Thanks.