Posted on 07/10/2020 2:18:32 AM PDT by DoughtyOne
PING LIST - Please contact me as needed...
COVID-19 Update # 114
As of 07/09/2020 23:15 PDST United States CDC - Provisional Numbers
As of 00/00/2020 23:45 PDST Johns Hopkins University - Capture Nations Informaton
As of 00/00/2020 23:45 PDST Johns Hopkins University - Capture Counties Information
As of 00/00/2020 23:46 PDST Johns Hopkins University - Process JHU Data
As of 00/00/2020 23:59 PDST WorldofMeters - Document Core Numbers
As of 00/00/2020 23:59 PDST WorldofMeters - Capture Nations Information
As of 00/00/2020 23:59 PDST WorldofMeters - Capture States Information
As of 00/00/2020 00:00 PDST WorldofMeters - Data Processing begins...
As of 00/00/2020 ??:?? PDST Publish COVID-19 Update - 00/00/00
Thank you for stopping by to check out the COVID-19 Update.
Here you can find...
Section: 01 Commentary, Special Reports, COVID-19 Update Info, & System Notes
Section: 02 the United States Situation
Section: 03 the Global Community Situation Outside China
Section: 04 the Global Community Situation Including China with reservations
Section: 05 the Mortality Report
Section: 06 Miscellaneous Reports of Interest
Section: 07 the United States, Counties (alphabetical / case no descending)
Section: 08 the United States, States Ranking, Provisional Numbers, & Territories
Section: 09 the United States, Ranked with Other Nations
Section: 10 the End of this COVID-19 Update
Section: 11 Data Sources and a Link to My Own Spreadsheet
Section: 12 Linked Spreadsheet: Counties, States, Provisional, Territories, & Nations
Section: 13 Links to Other Resources
Section: 01
Commentary, Special Reports, and COVID-19 Update Information2
Interesting Tid-bits (hopefully)
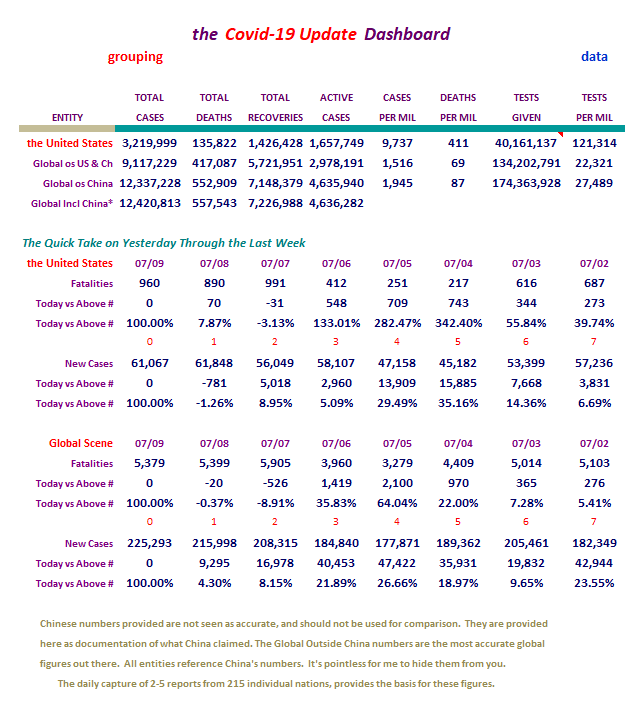
Higher Fatalities Observed Again Yesterday
I believe there is cause for concern about our rising Fatalities. Three days in a
row now, we have been pushing close to 1,000 per day. Yesterday was almost 40%
higher than the same day the week before, and nearly 56% higher than six days ago,
a Friday.
As long as New Cases were high, and the Fatalities remained low, we could rebut
attempts to make the case for clamping down again. If the cases head toward two to
three thousand per day, we can kiss good-bye the case for opening up.
At 1,500 per day, we'd be looking at 547,500 Fatalities per year.
2,000 = 730,000 / 3,000 = 1,095,000 / 4,000 = 1,460,000 / 5,000 = 1,825,000
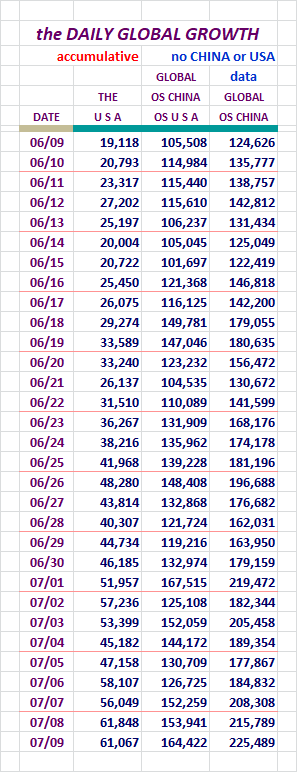
Highest Global New Cases So Far Yesteray
On the Global scene there were 225,293 New Cases declared yesterday. In the U. S.
the number fell of a bit to 61,067.

Section: 02
The Following Addresses the Numbers Here in
the United Staetes of America
Here we go...
As you can see, our New Cases fell off a bit yesterday. That's not much of a
claim when it's still the second highet day yet.
Concept of adding in Active Cases and Serious Critical here, courtesy of amorphous
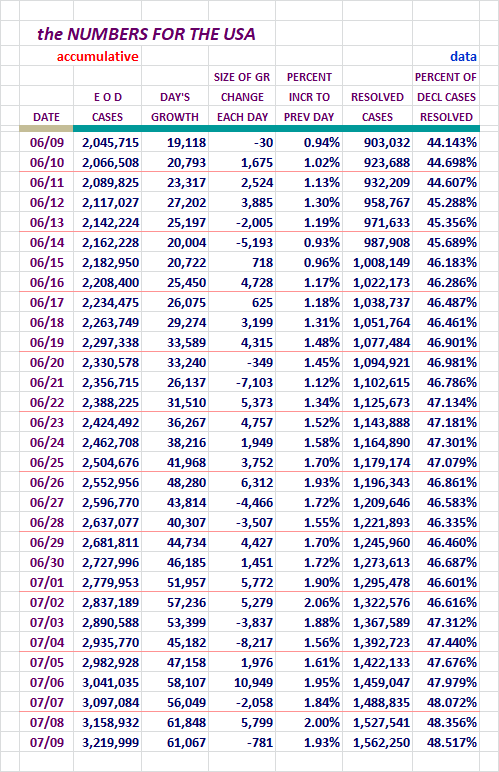
Here are more of our numbers...
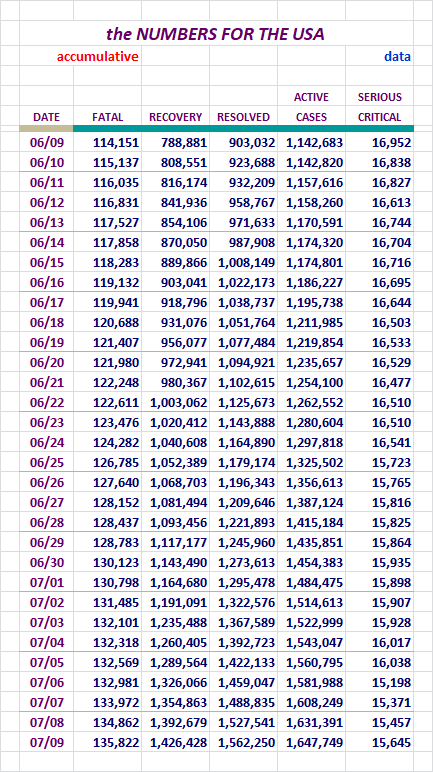
Active cases continue to climb.
Our Slice of the COVID-19 Pie
The growth of our slice of the pie has been dropping recently.
Here are the numbers I've been tracking, Globally Declared and Active Cases.
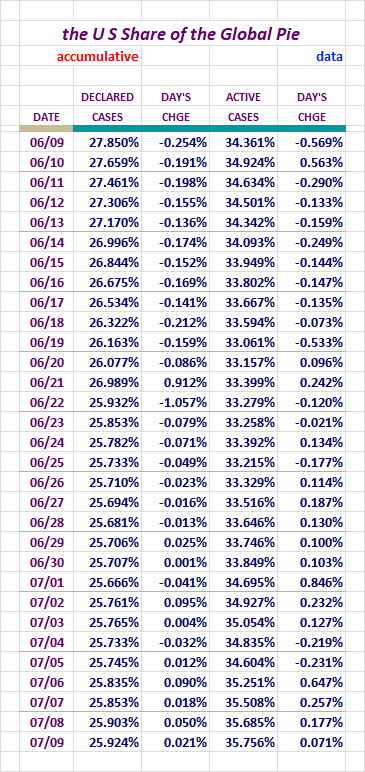
This is bouncing up and down as I predicted a few days back. Sadly the trend
seems to be upward. As long as we have as many daily New Cases as we have had
this area won't look good. As mentioned often, the number of Fatalities is what
it's all about right now.
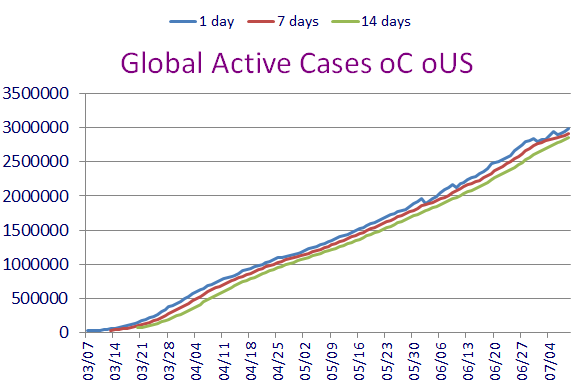
Active Cases in the United States / Chart
Unlike some of the other charts here, we should see a good rise and
fall at some point withone.
Note that this presents the one day and then 7 and 14 day averaging versions.
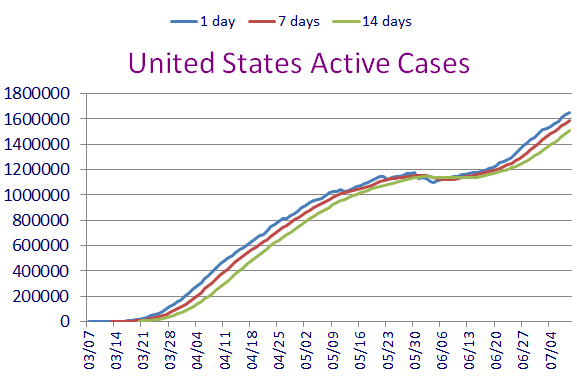
Remember, these are not new Declared Cases. These are remaing Active Cases.
Clearly the single, seven, and fourteen day lines are moving way up.
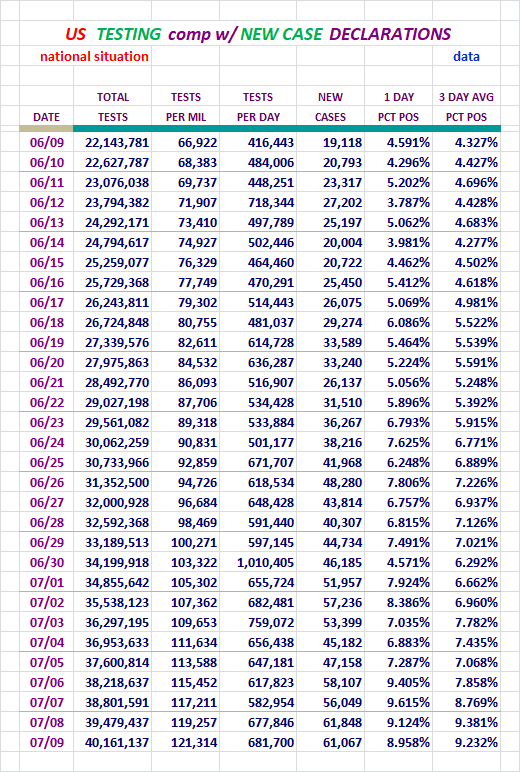
Testing and New Case Figures
Requested by stocksthatgoup
Some folks have shown an interest in seeing the COVID-19 Test figures compared
to the New Cases being declared. The following Data addresses that.
The postive percentage fell off a bit in the single day area there. It was a
small drop, and this metric bounces around considerably day to day.
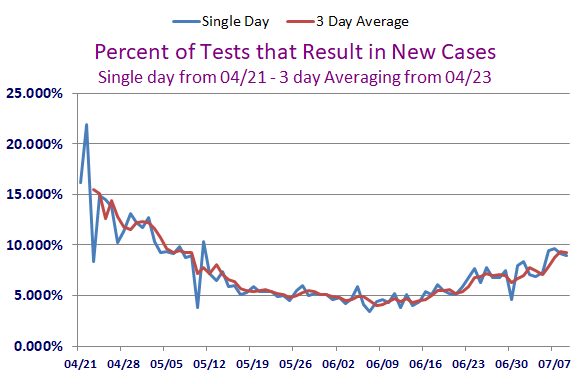
Hope this doesn't soon wind up looking like there is a morror involved when
looking at this chart.
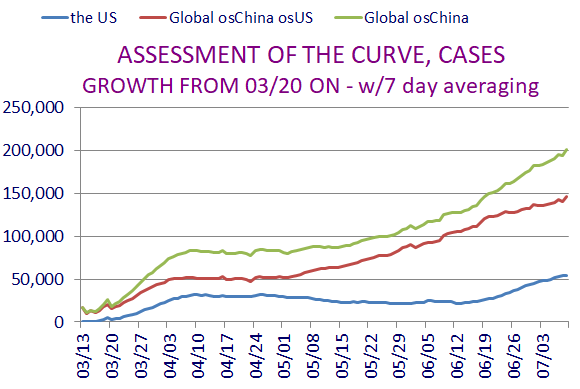
The U. S. Stats / w 10 Day Averaging / Fr: 03/17
Requested by: Texas Eagle
This data and chart presents things in a little different way. In the
chart it is easy to see the relationship of these numbers.
The Chart will use the data all the way back to 03/17, but the data displayed
here will only go back one month.
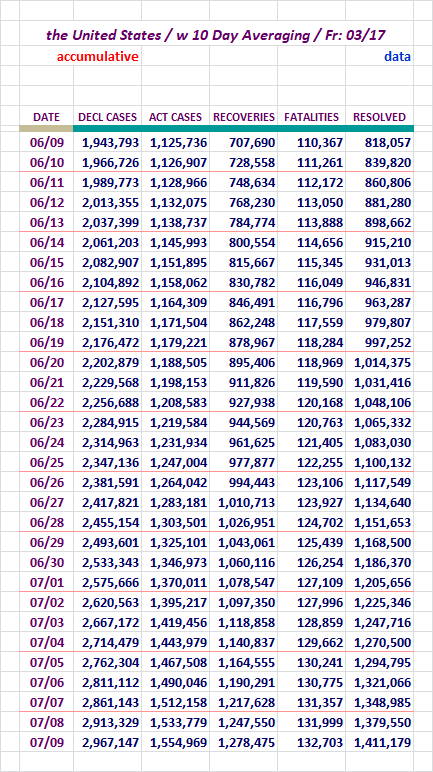
Here is the chart to match.
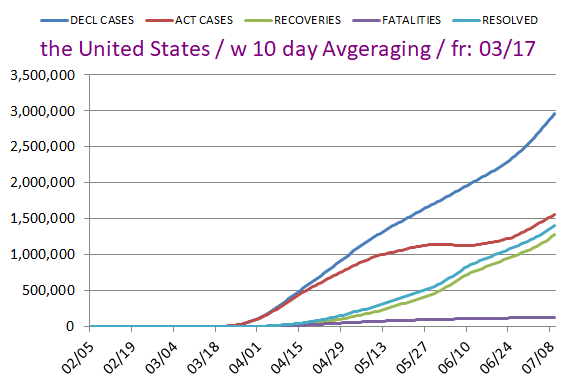
The Active Cases and Resolved Cases look to be closing.
.
Section: 03
The Following Addresses the Global Numbers
without Mainland China
Here is the first set of Data for the Global Outside China
Territories
Yesterday was another record day globally, as New Cases go.
Fata.lities, Recoveries, Resolved, Active Cases, and
Serious/Critical Cases - Globally, Excluding M/L China
Concept of adding in Active Cases and
Serious/Critical here, courtesy of amorphous
Here we go...
For your review...
How is the Global Community Outside China Doing,
Without U. S. numbers?
Let's see...
This metric looked worse again yesterday. I addressed the previous day as the
higherst yet in this area, but somehow missed that big figure on 07/01. The
number for yesterday was not a record. It was just very high.
Globally New Cases were higher, but in the U. S. they fell off a little. Again,
as long as Fatalities remain on the lower end of the spectrum, that's good.
Yesterday's Fatality figure was again a day close to 1,000 cases. There is
some cause for concern now.
These charts are now not only seeing growth internationally, but domestically
as well.
The Active Cases outside China Globally / Chart
As in the U. S. version of this, we should see a good rise and fall at
some point these two.
Note that these present the one day and then 7 and 14 day averaging versions.
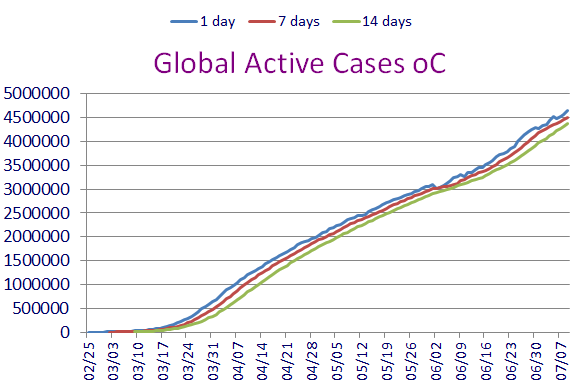
Remember, these are not new declared Cases. These are remaing active cases.
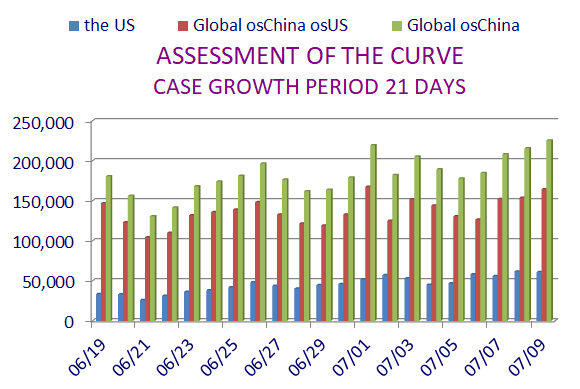
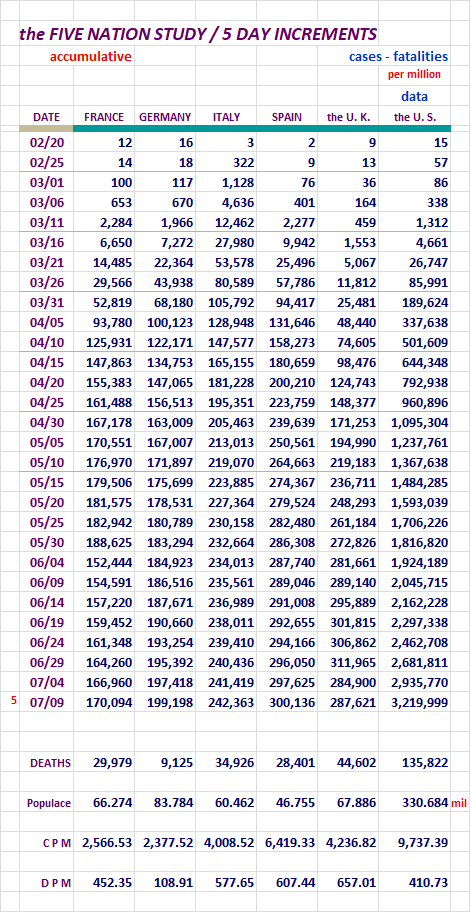
Special Section on France, Germany, Italy, Spain, and the U. K.
Case growth.
Jim Noble mentioned he'd like to see the US numbers added here. I added them
in on 06/21/2020. I did not add them to the chart because it would have
dwarfed the European nations chart lines. (they would have been reduced to
about 15% of their normal size)
Let's Look at Some Numbers in Five Day Increments:
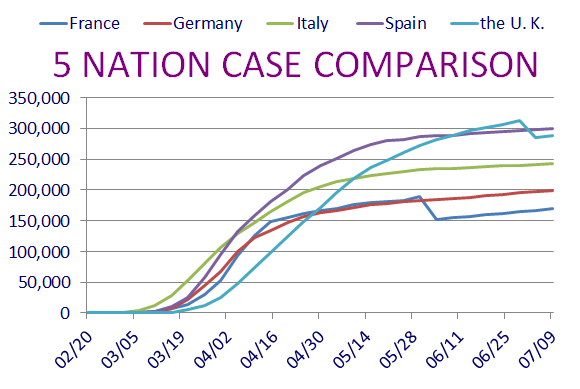
Hard to miss the correction in the direction of the U. K. there. I double checked
the data, and the correction has been sustained for the last day and a half.
It is accurate. Unless a correction occurs, the U. K. just changed
direction.
The U. K. line there is quite similar to France's line over a month ago.
Sweden and It's Neighbors, Who Has the Best Tactic Against COVID-19?
Sweden is doing its own thing with regard to isolating. I think most people
are aware of it by now.
Here are some numbers to help us look at this issue.
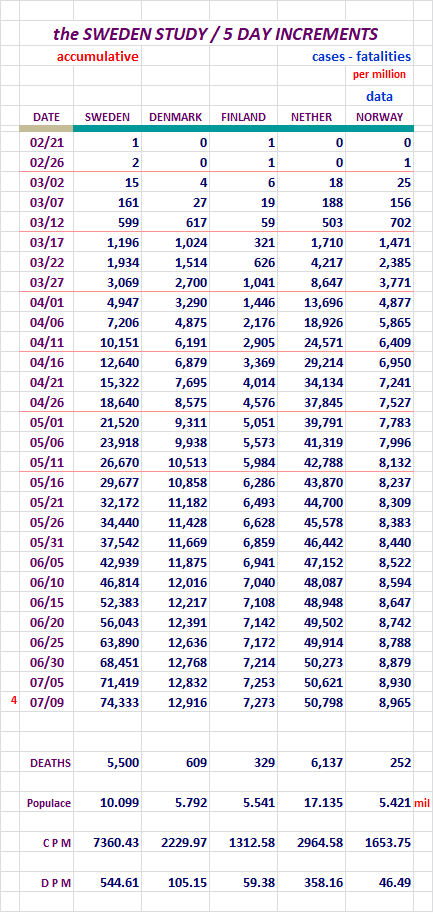
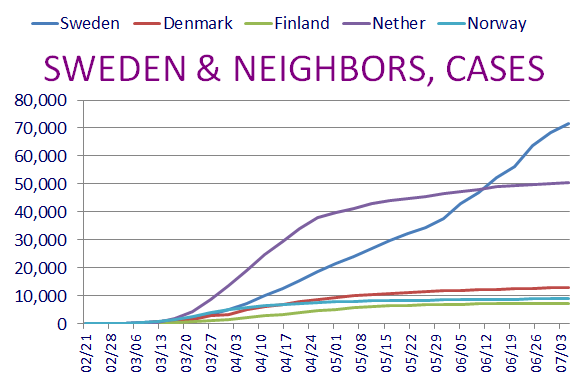
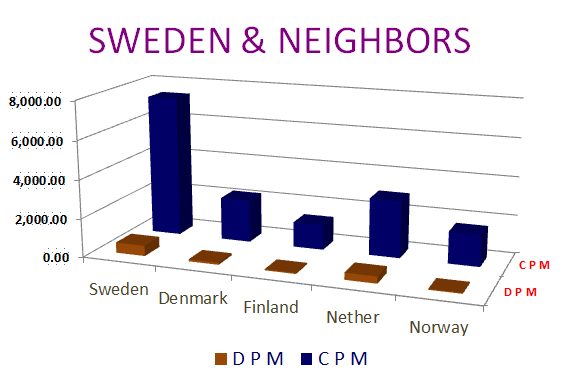
Sweden still remains a hot topic, and it's tragectory IS NOT looking good
on that Chart. In it's own group, it's not good at all. If you compare it
to some European Nations, it looks no worse.
Movers and Shakers...
I will present the top fifty nations with the most New Cases and New
Fatilities.
Here we go...
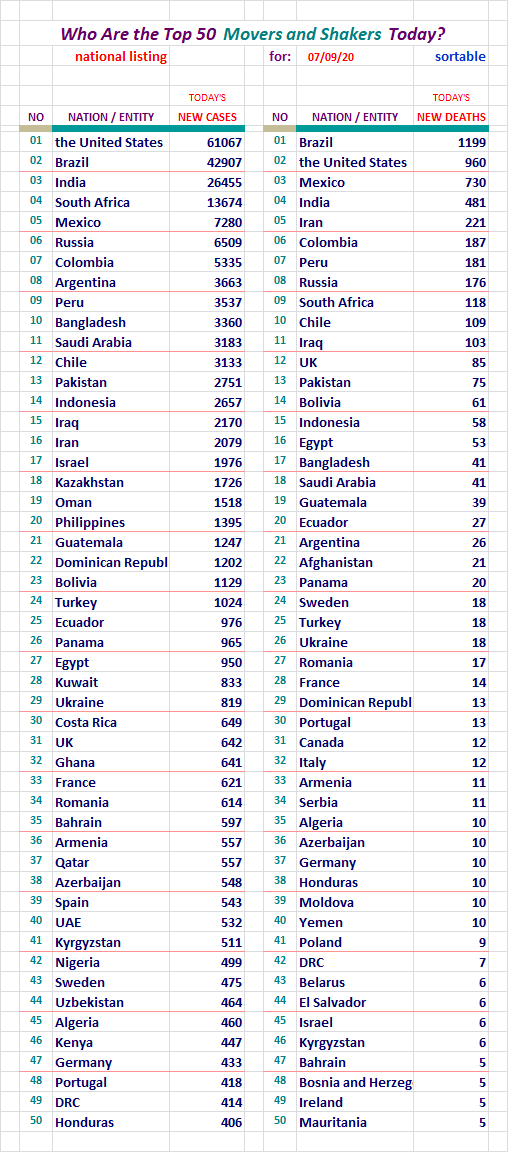
As the number of daily Fatalities grow, the dismissing of those high levels of
New Cases loses favor. I wouldn't mind 100k New Cases per day, if the Fatality
rate was low. If the fatalities move back up into the thousands per day level
it's going to be a problem.
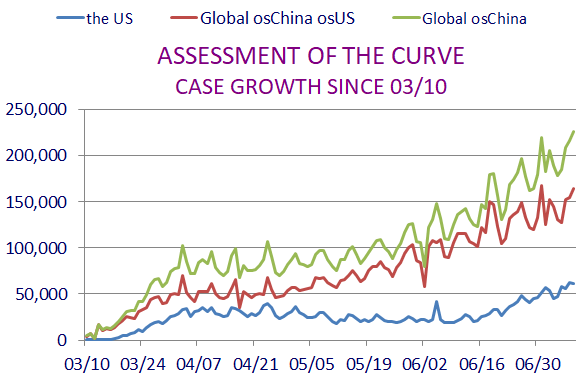
Global osChina Stats / w 10 Day Averaging / Fr: 03/05
Requested by: Texas Eagle
This data and chart presents things in a little different way. In the
chart it is easy to see the relationship of these numbers.
The Chart will use the data all the way back to 03/05, but the data
displayed here will only go back one month.
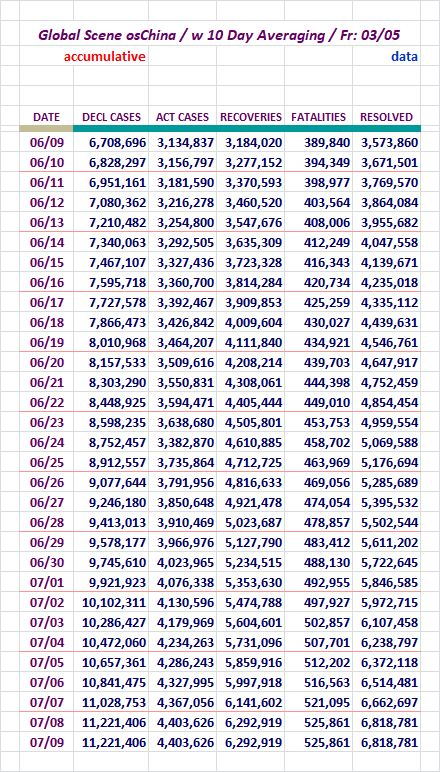
Here is the chart to match.
I like being able to follow the movement of these stats visually.
Section: 04
The Following Addresses the Global Numbers
including Mainland China*
Mainland China's numbers are 0.007% of today's total global numbers.
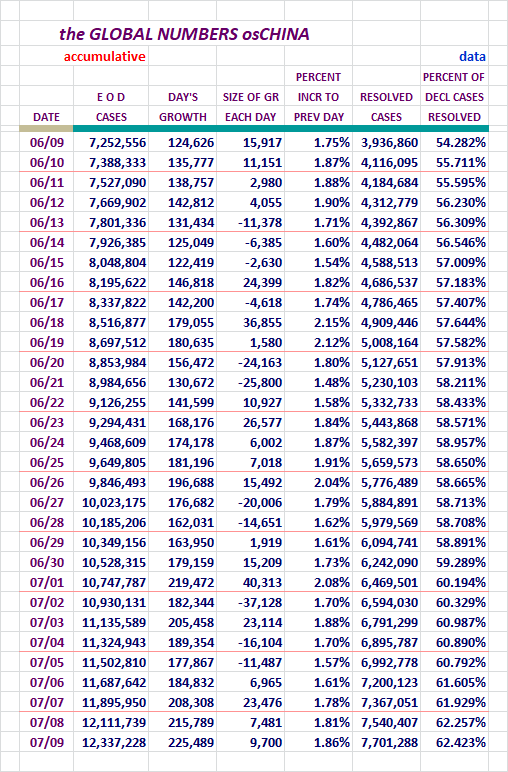
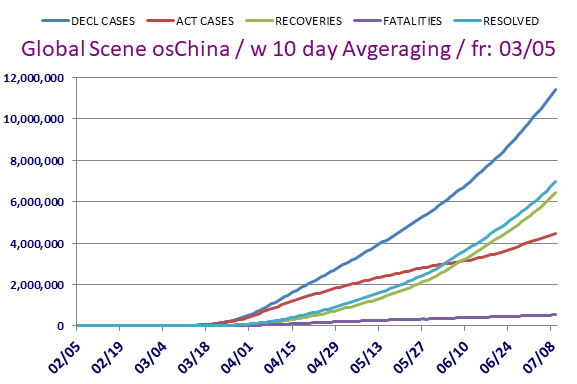
A Look at Declared, Resolved, and Active Cases, Includes M/L China
End of day figures follow:
I was surprsed to see the upward movement robust enough to carry us over the
62.00% level of Resolved Cases globally. That's where we want to be, growing
higher each day. Now it looks as though there's enough strength here, that we
may be topping 63% Resolved Cases shortly. Nice!
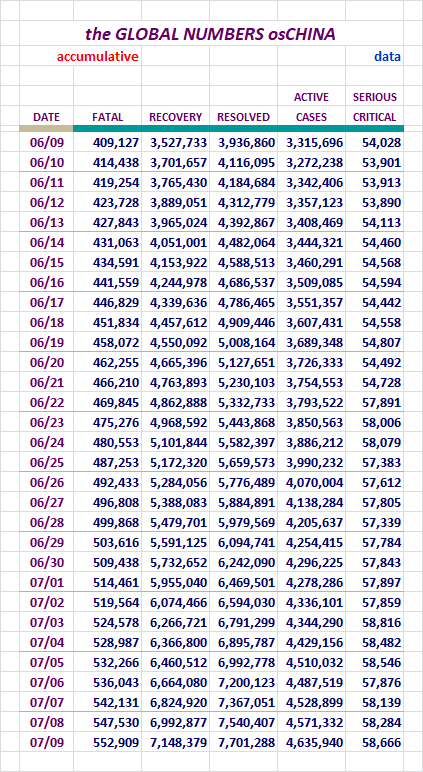
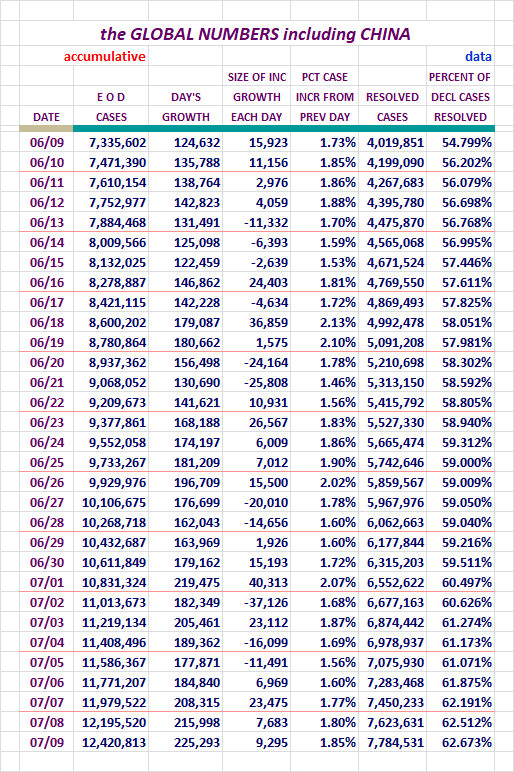
Fatalities, Recoveries, Resolved, Active, and Serious/Critical
Cases Globally, Including M/L China
Concept of adding in Active Cases and
Serious/Critical here, courtesy of amorphous
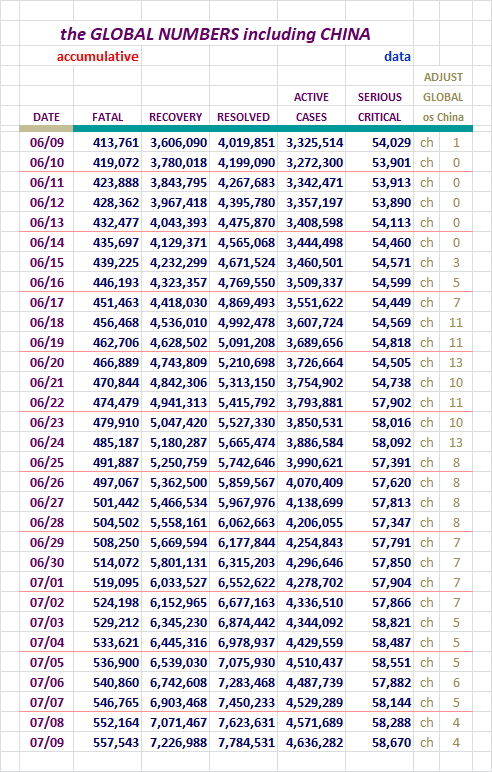
For your review...
Section: 05
the Mortality Report
Here is the data for four entities...
Here are the figures for the growing case totals for four entities.
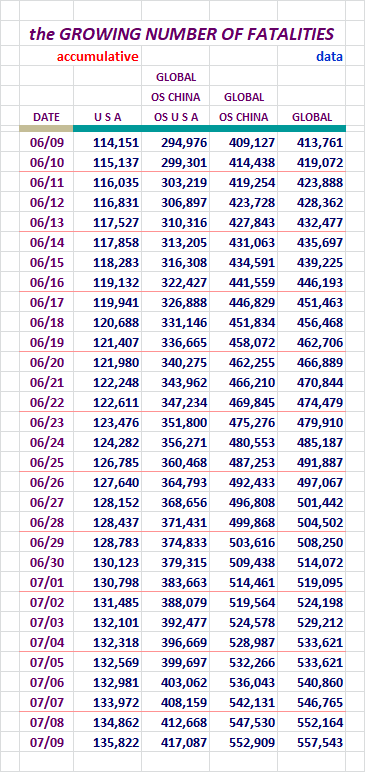
We hear all sorts of stories about how these figures are wildly off. The CDC
has studied them and seems to think they may actually be on the low side of
things. I am providing the CDC Provential Numbers down below. Not sure if
anyone has a rock solid number. I doubt it is possible. This is what is
reported out by WoM and JHU. Check out the CDC numbers too.
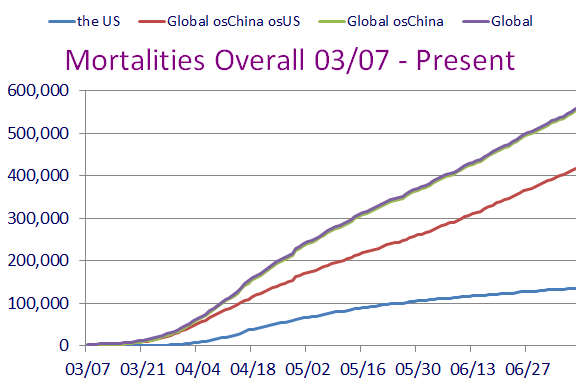
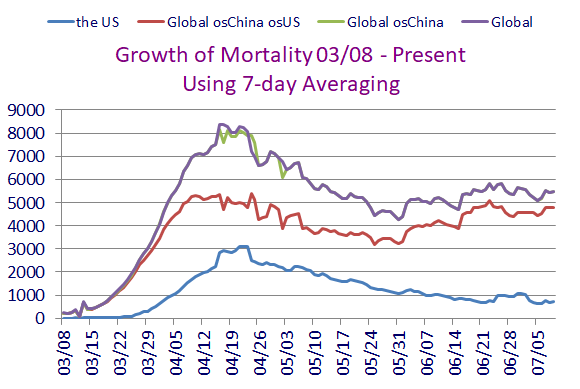
Charts like this one only show growth. That's why I recently took the advice
of a FReeper and added in a new chart for the U. S. and Global outside China
regions.
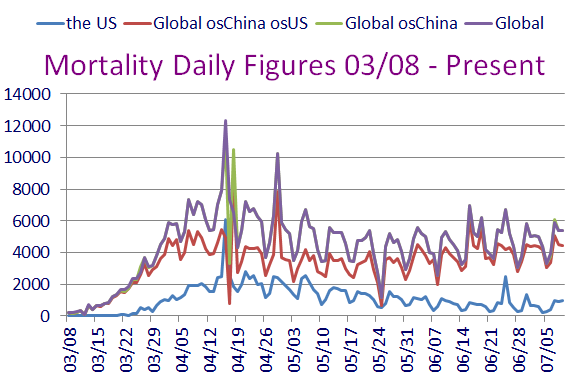
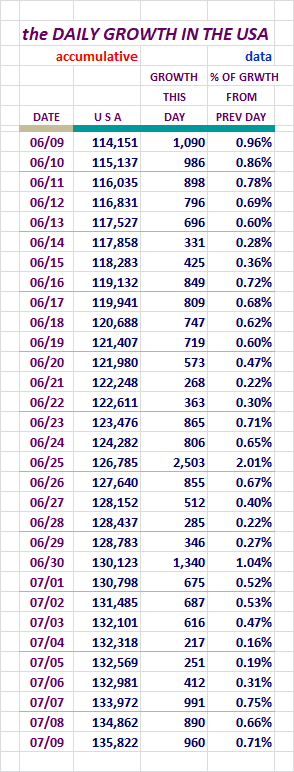
Here are figures revealing the daily growth for those four entities.
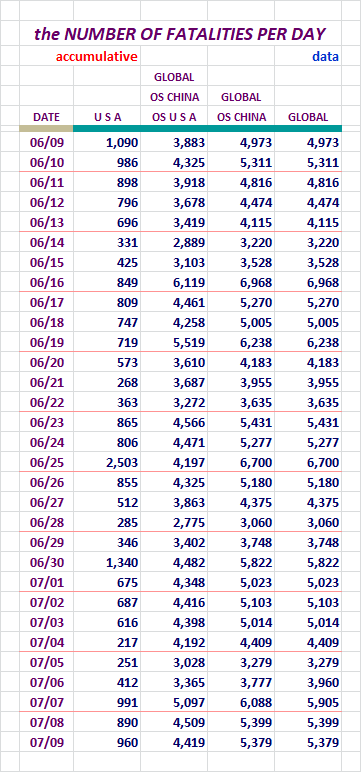
U. S. Fatalities continue to remain in sub-1,000 territory, but the last three days
have seen higher Fatalities than we have seen in two weeks. Still hoping for the
best as we go forward in the short term.
Since the beginning of COVID-19's activity in the U. S., higher New Cases were
soon followed by elevated Fatalities. If we have gone to school on the data
of this disease, we know who should avoid exposure the most. So if the
demographic that has little to fear from the disease is out there getting
infected, it may not be a bad thing at all. If the Fatalities remain low,
vastly higher cases may simply increase the rapidity of the saturation of the
people in public who have already fought it off. And that may facilitate the
end of the disease. I'm sure others know this, but I did want to explain why
my thinking has fluctuated over time regarding these dynamics.
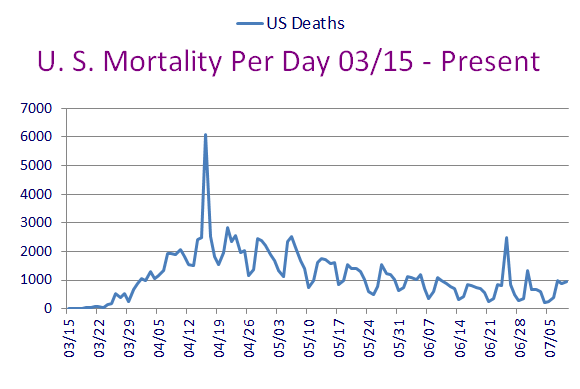
Here, let's look at data for the U. S. broken out by itself.
In the lasts 34 days, we have looked very good in this area. I'm not sure we've
had even one clean count day over 1,000 out of those 34 days.
Sadly, we're seeing growth here. It looks as if the Fatalities are about to
start tracking noticably higher along with the New Case declarations.
New York, New Jersey, I'm sure you'll have a very hard time figuring out where
they botched things... /s We had a little mini-event just after New Jersey also.
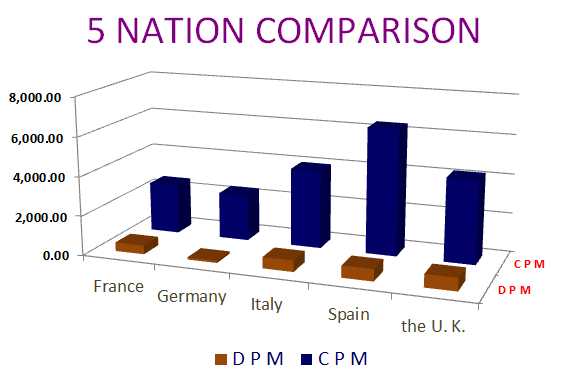
Section: 06
Population Saturation
Here are figures revealing how many people in each population base represent one
case. I'm also showing what percent of each population base is infected at this
time.
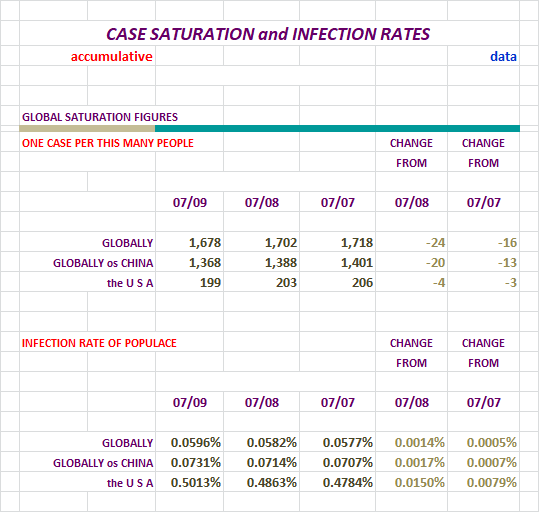
We're still slipping here, but globlly yesterday was a good day. The number of
Active Cases fell off substantially globally. There was a huge wave of Resolved
Cases that crashed down on yesterday.
Nations With Lots of Cases
At the end of the day yesterday, there were:
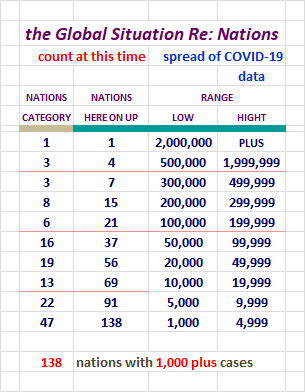
It's hard to belive there are that many nations with massive numbers. JOH and WoM
are tracking 215 nations (or entities). This means that 64.19% of these entities
being tracked have declared over 1,000 cases. I'm sure they have far fewer Active
Cases than they have declared though. Keep that in mind...
Daily Case Report Evaluation
I'll be keeping tabs on the daily tallies for days of the week for a while. Folks have
noticed some patterns of larger and smaller data entry on certain days, and on Fridays
sometimes the numbers get noticeably larger because of it.
And we now know Thursdays have potential to break out also. Yikes!
IMO Let's check out the numbers and a chart.
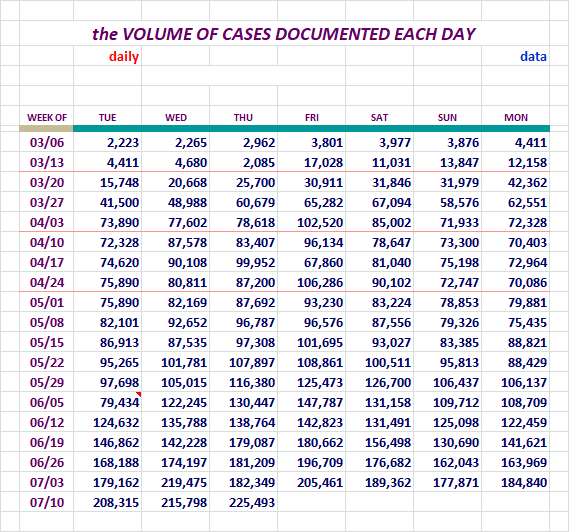
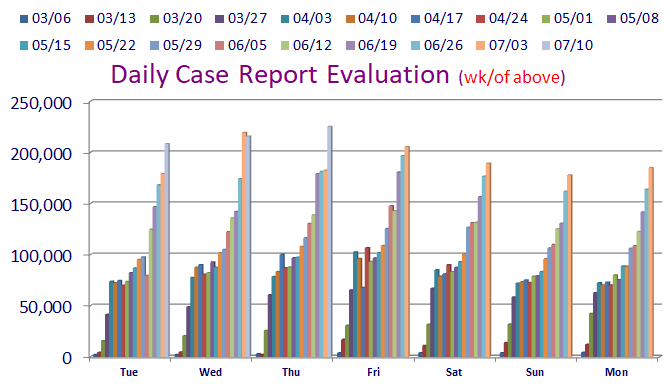
Look at that massive margine of increased New Cases over the same day in prior
weeks. Not good...
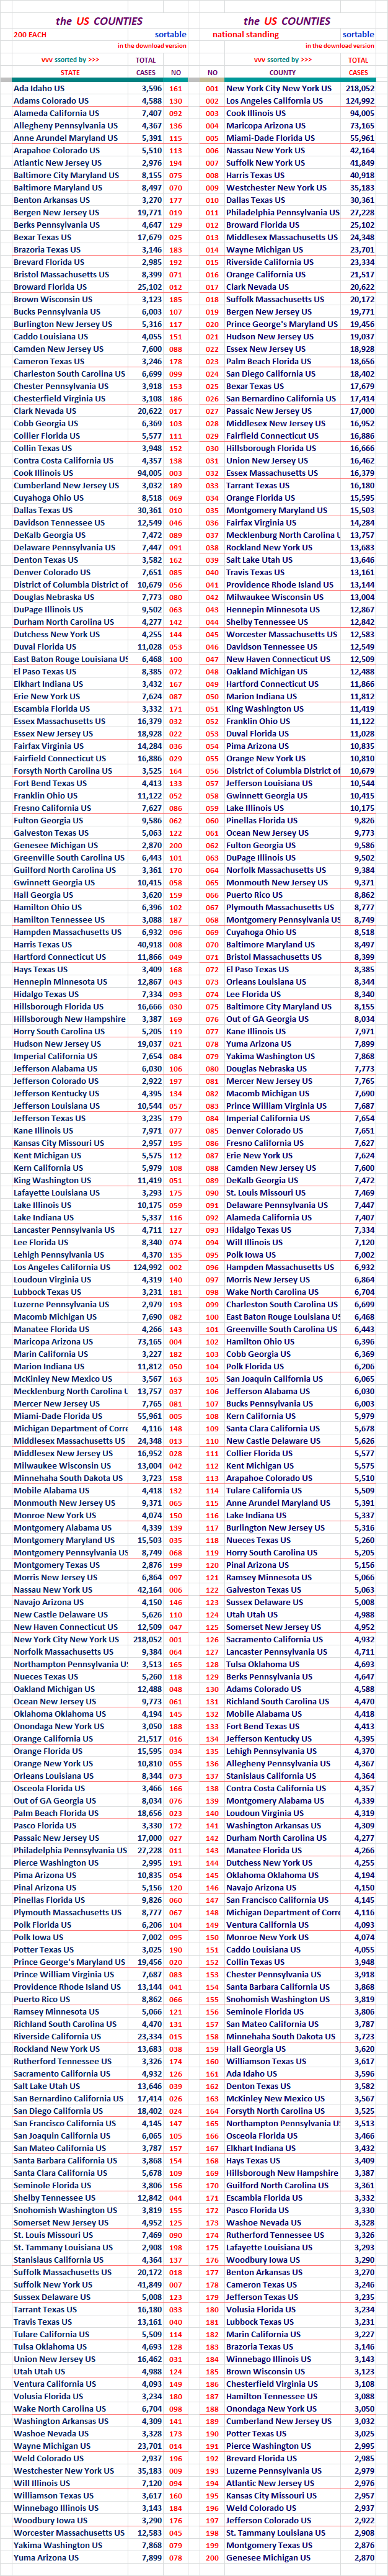
Section: 07
The Top 200 Counties in the U. S., by Number of Cases
This little report lists 200 Counties in the United States in declining Case numbers.
There is also a listing that is alphabetical. This report list only the entities
and the number of Cases in the two different sorts.
It will also be available as a downloadable Excel file in Section 12.
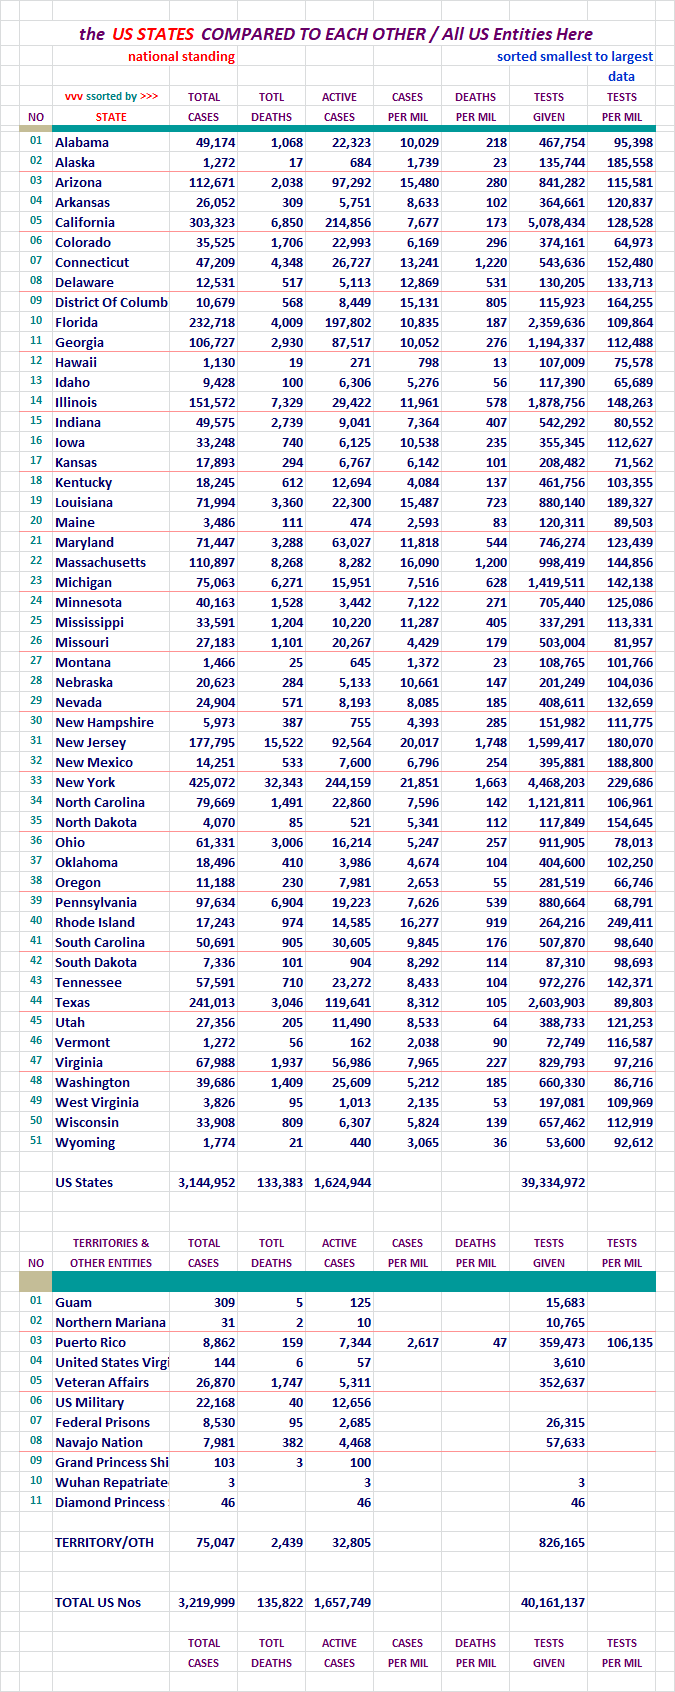
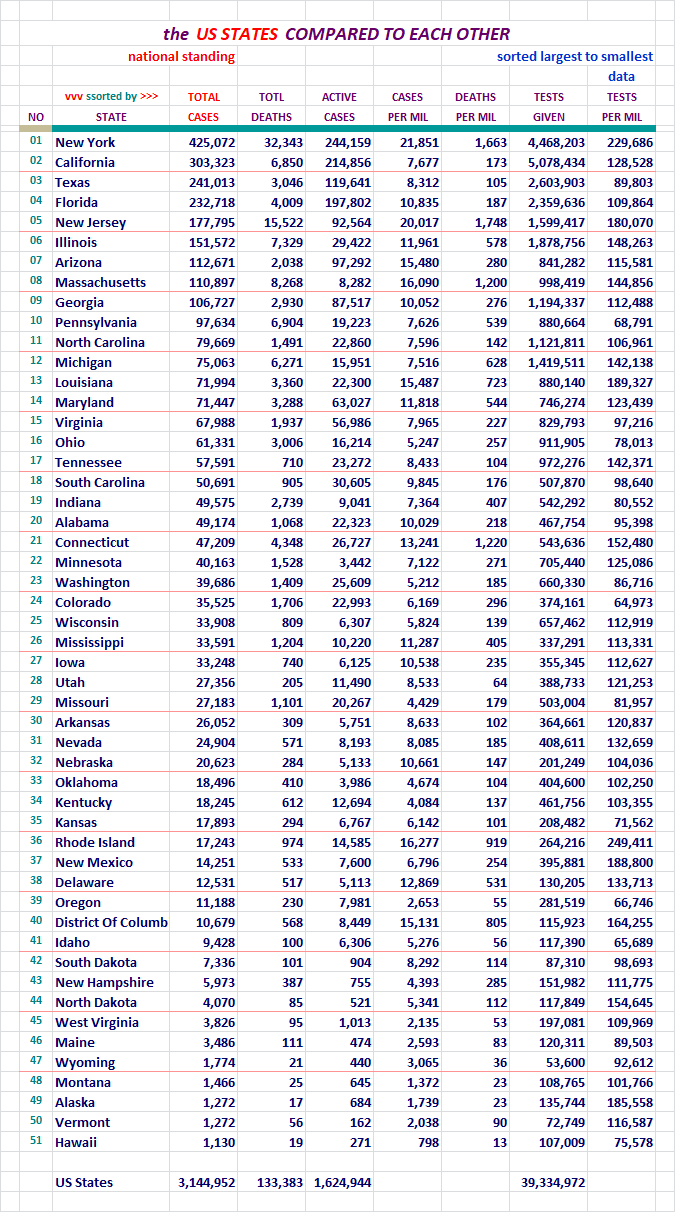
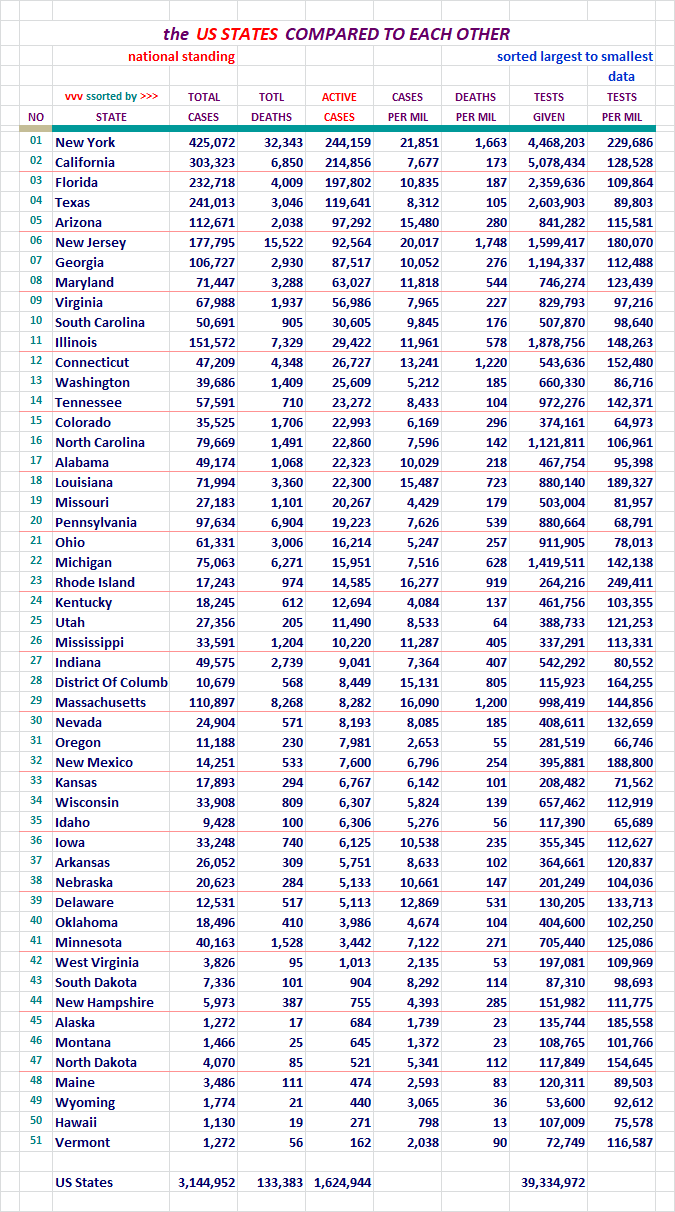
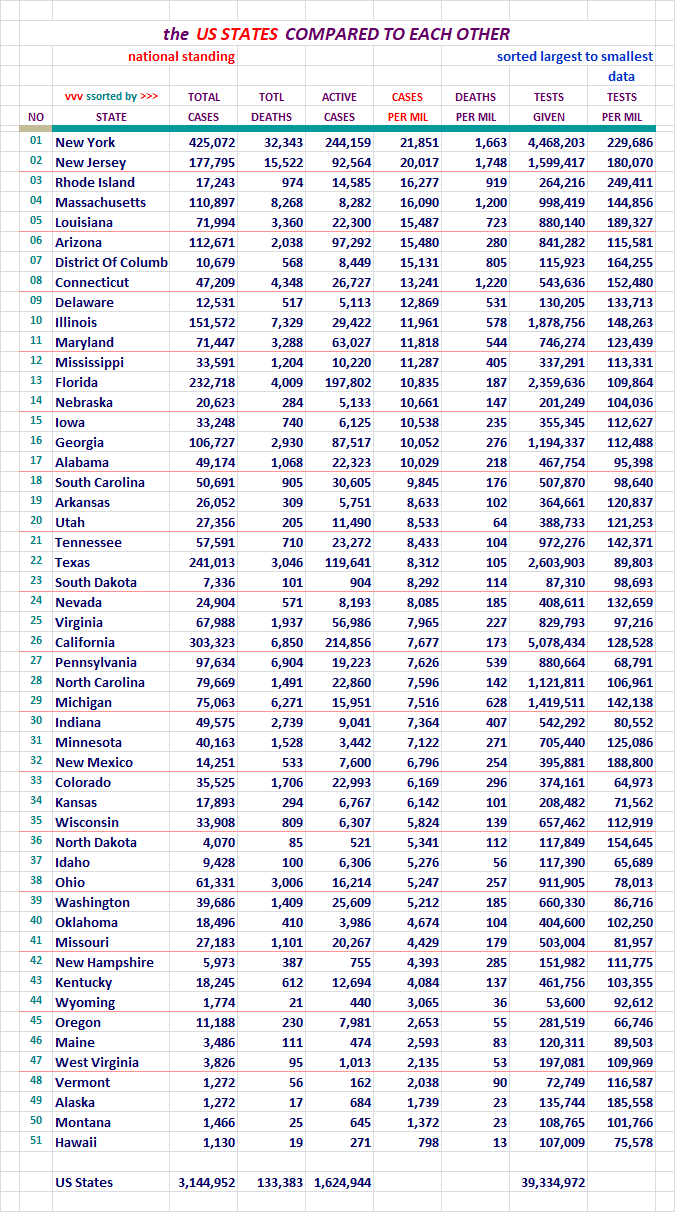
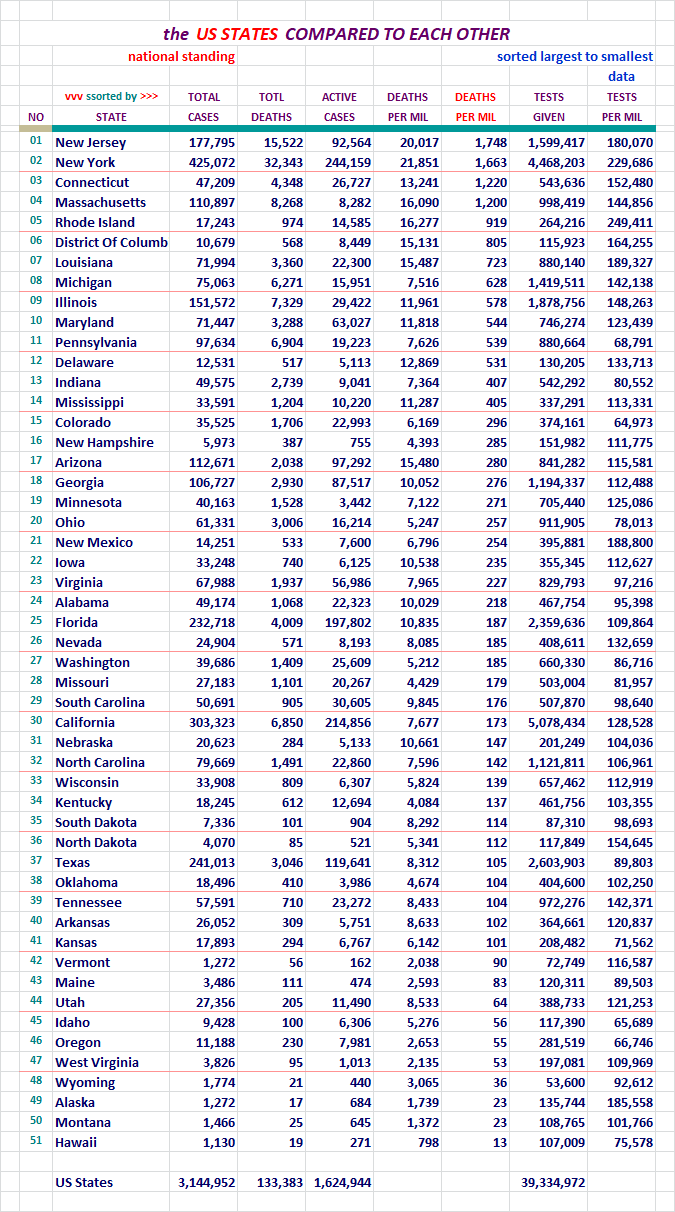
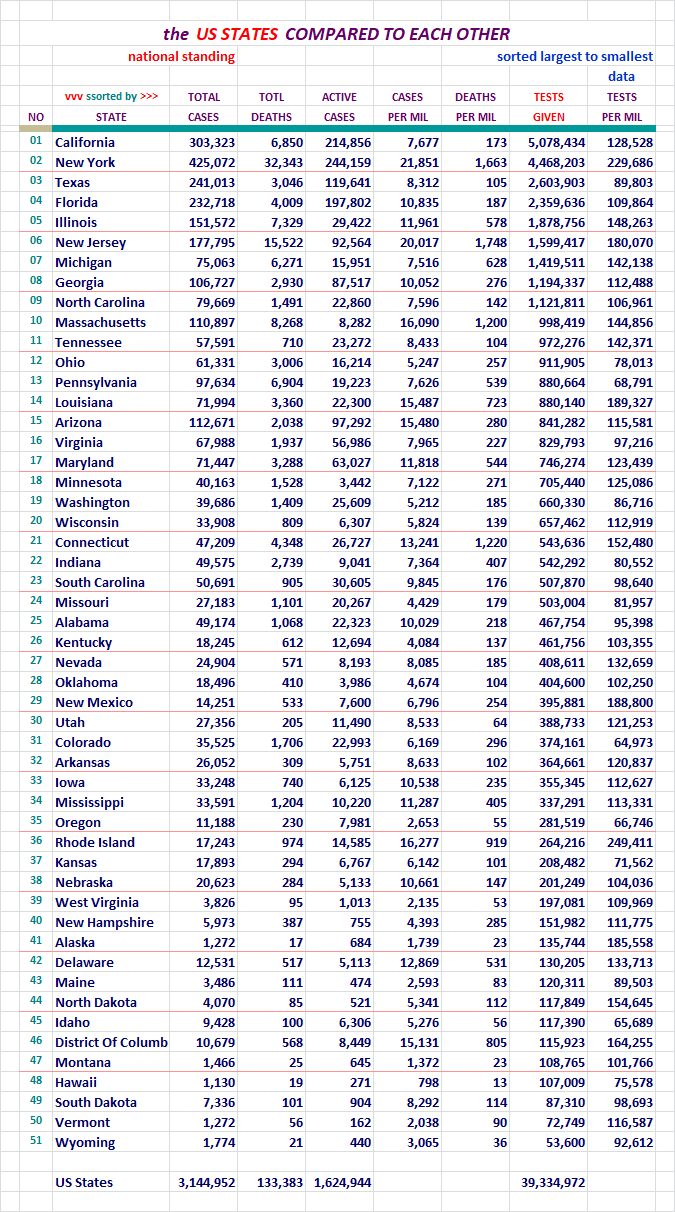
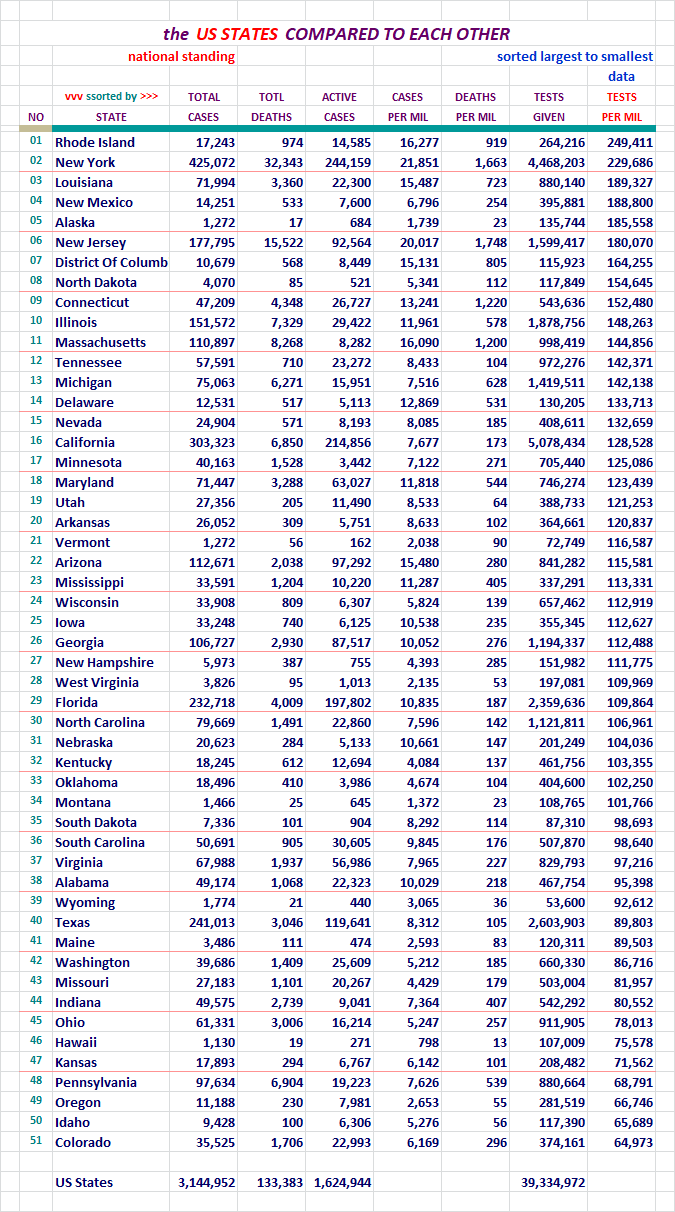
Section: 08
States of the Union and the District of Columbia, Compared to Each Other
Each of these pages is sorted differently. Look at the red header above
the columns to see which column was used for the sort on any given page.
For your review...
For your review...

For your review...
For your review...
For your review...
For your review...
For your review...
For your review...

For your review...
If this area interests you, please use this LINK to the source, and review
the lengthy description and explanation of it's development process.
There are two reports. The presentation above comes from the second one,
and the detailed segmented information below it, may interest you.
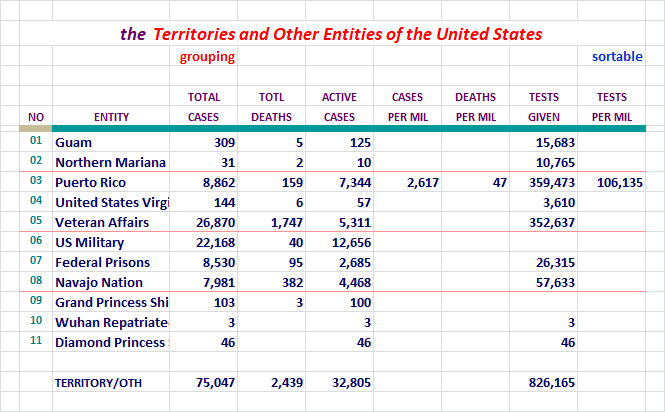
These can now also be found under the states on the Alphabetical list. The
states and these entity's numbers should be combined to match that of the
U. S. figures each day.
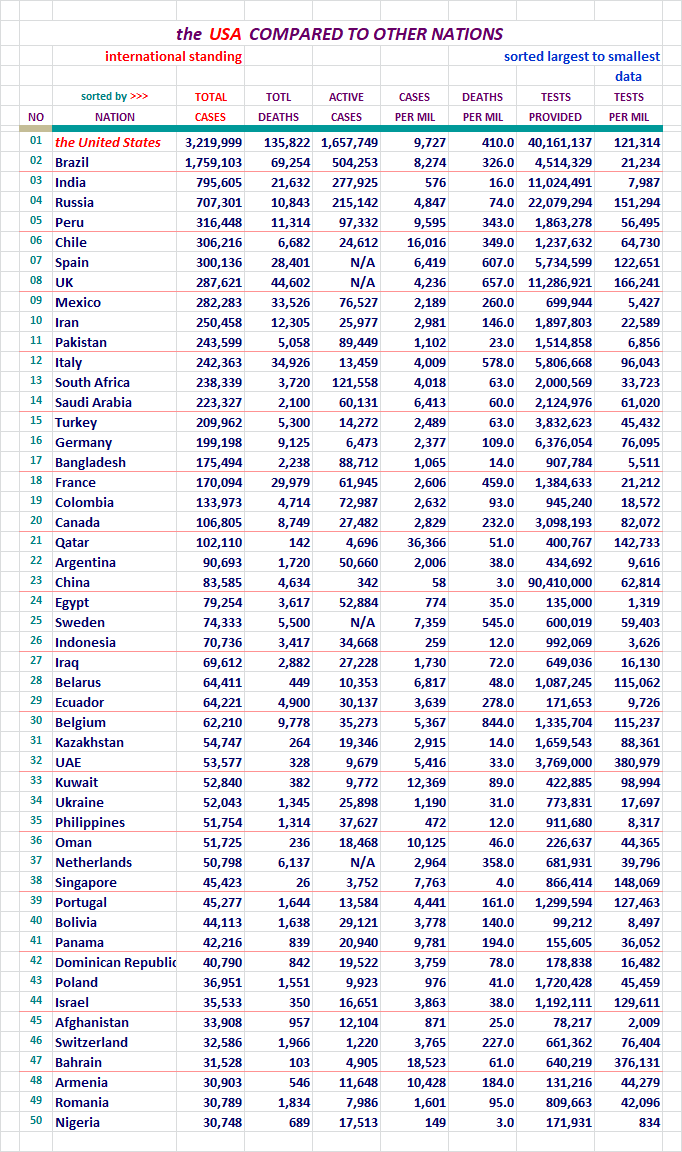
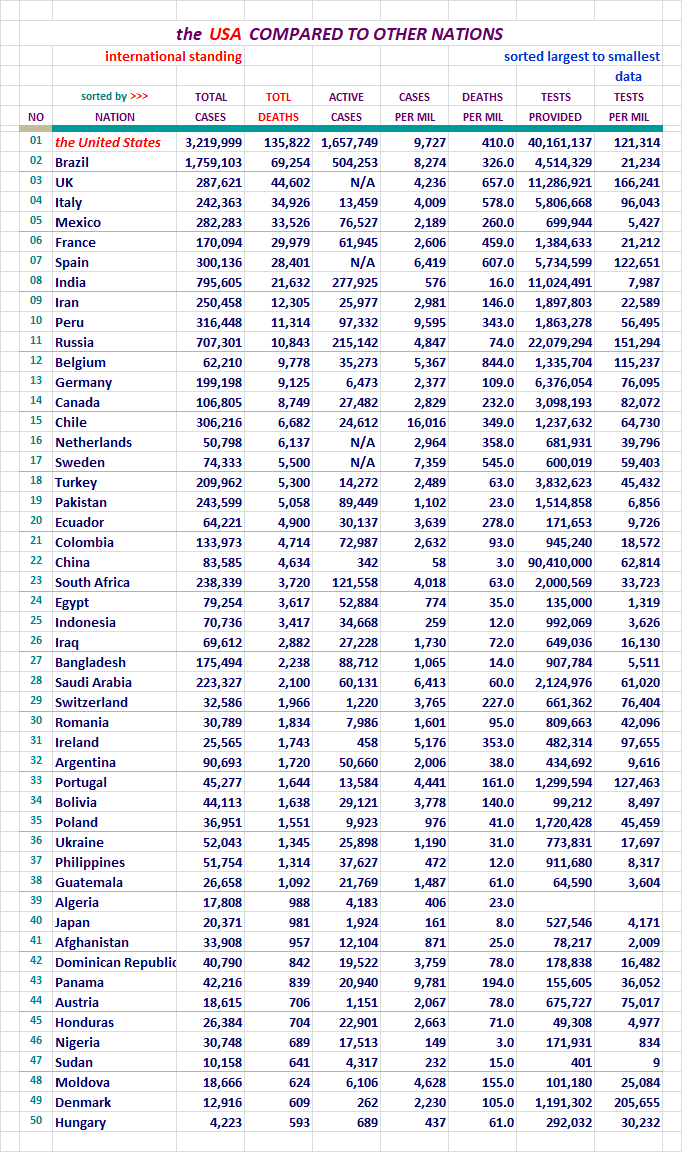
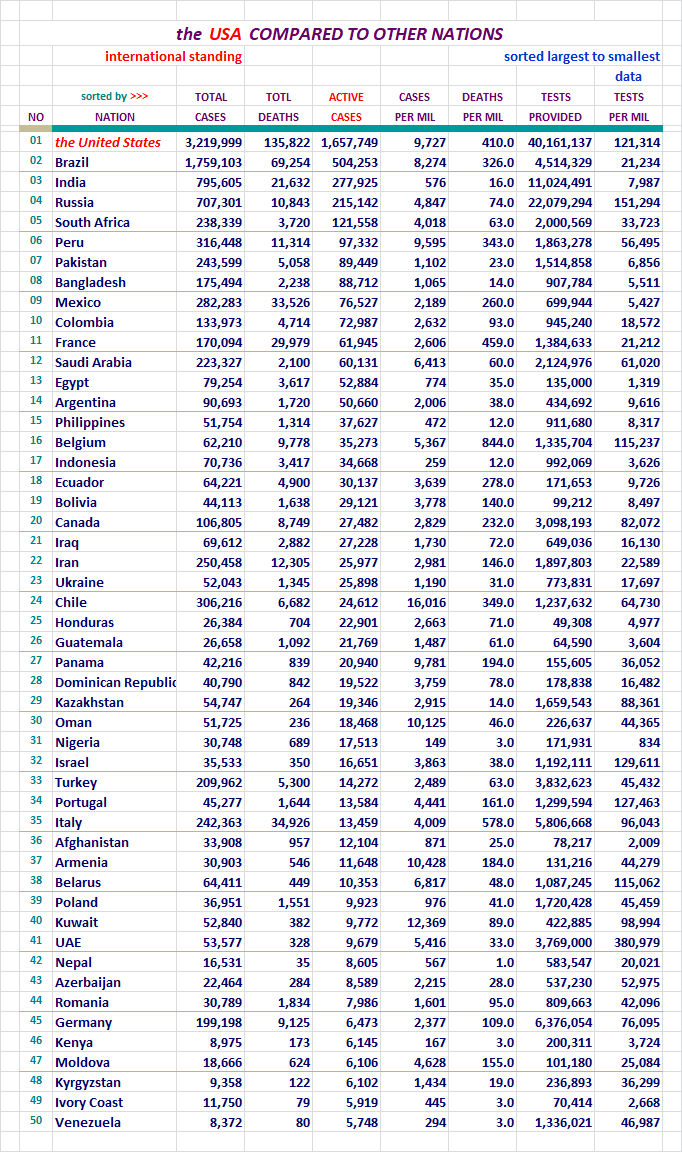
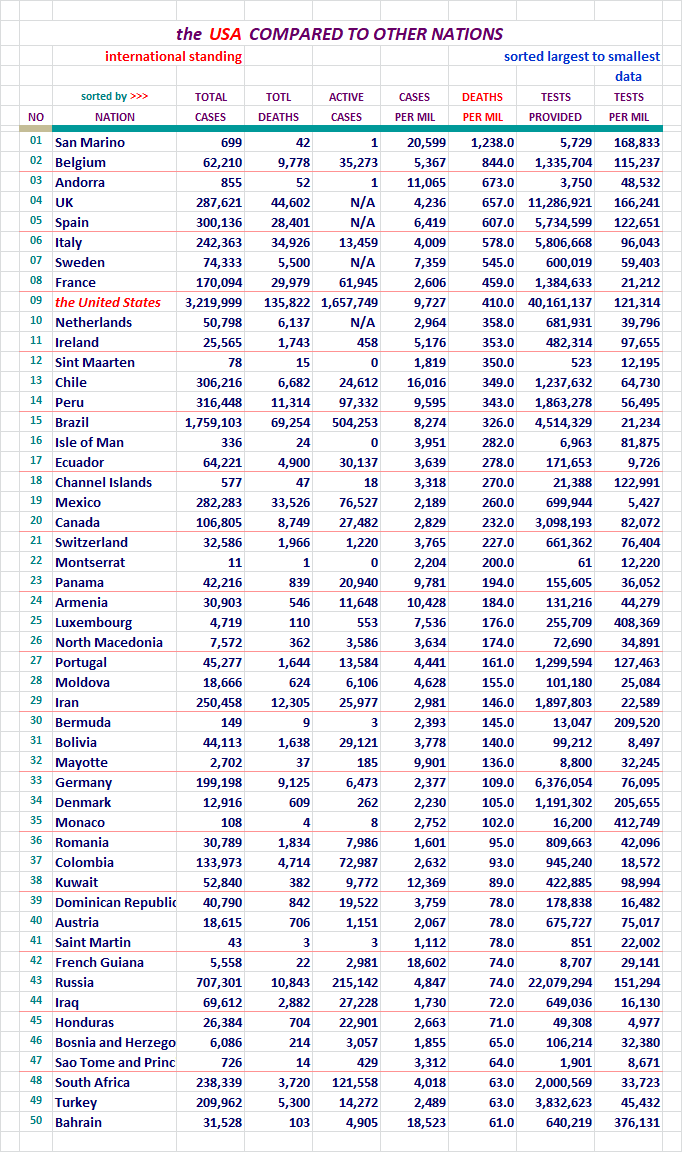
Section: 09
The United States, Where it Ranks With Other Nations?
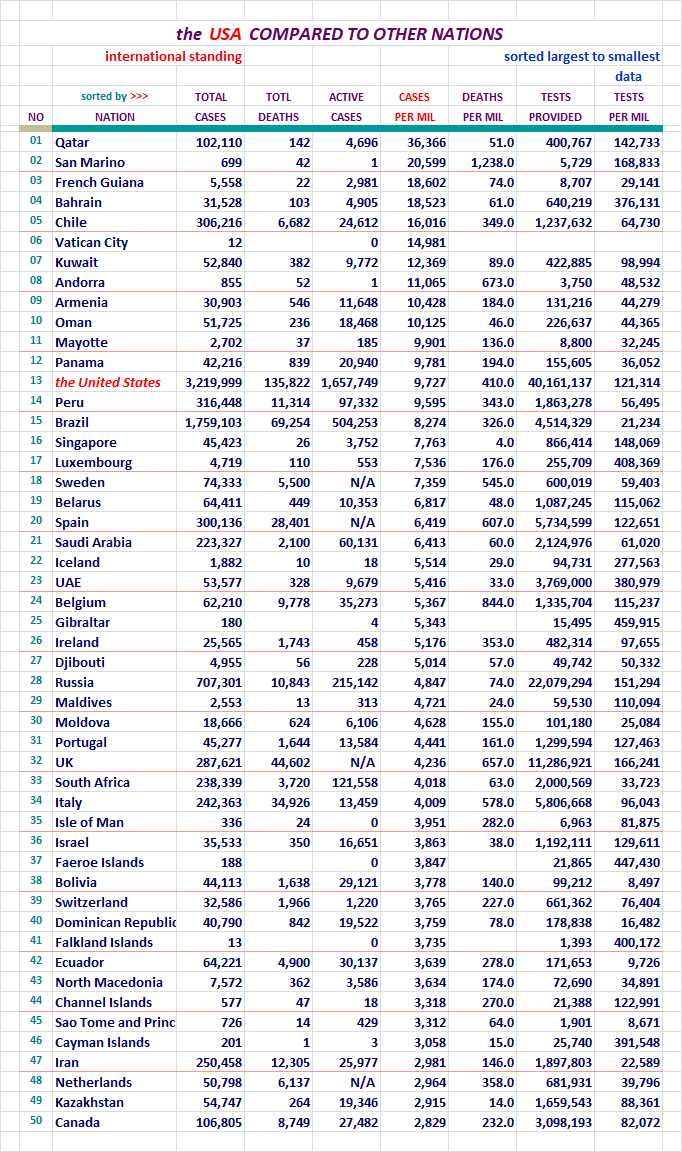
Each of these pages is sorted differently. Look at the red header above
the columns to see which column was used for the sort on any given page.
The U. S. will be highlighted red here so we can find it easily in the list.
There was 215 nations on this list last night now. I didn't want to post
seven lists with 215 nations on it, so I picked the top 50. Coincidentally,
one report category had the U. S. at 41st, so it wasn't showing up on the
list with the 31 top nations on it. That wasn't the reason why I extended the
list length, but it did work out well.
I work on the nations right next to the states on my spreadsheet. The
states with the District of Columbia come in at a total of 51 lines.
I decided to keep the international reports near that length, and 50
was good enough.
Here we go... for your review.
For your review...
For your review...
For your review...
For your review...
For your review...
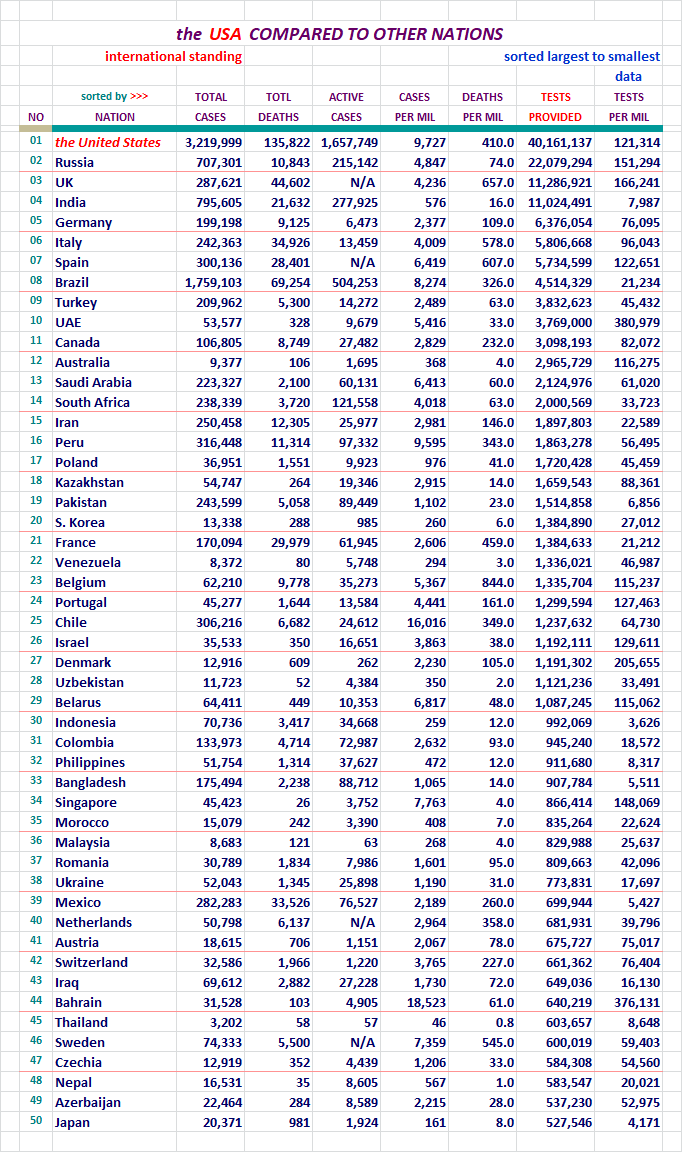
Around 06/23, China started putting out it's testing numbers. I thought
they were suspect. The number they put out was 90,410,000. Ours and most
everyone else's numbers are specific. For instance on 06/28, our number of
of tests at the ned of the day was 32,592,368. That specificity separates it
from the number China put out. It was rounded to the 10 thousandth place. In
addition, China has not updated that number once. So I do not inlude China in
the Nation's Comparison Sort regarding Testing, and any place that reports out
global testing numbers for a top level comparison.
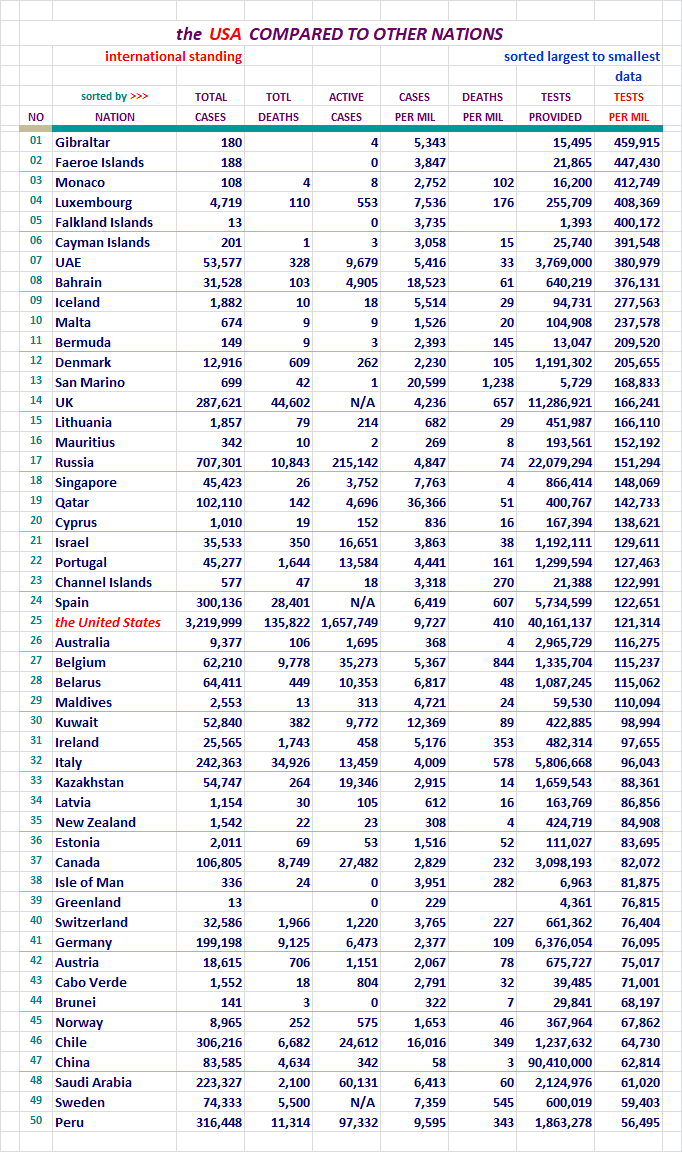
We came in at 25th again on the Testing per million scale yesterday. That's our
lowest standing yet.
Progress...
Section: 10
Here is what it is all about. From January 20th to the present.
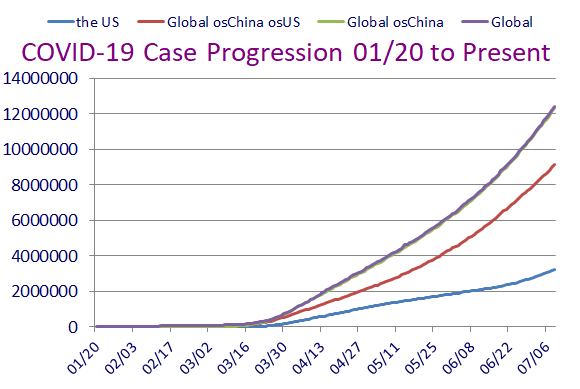
This concludes our look back at yesterday's data. Take care...

Section: 11
Data for this Report Sourced From:
LINK WorldoMeters
LINK Johns Hopkins University
The Center for Systems Science and Engineering (CSSE)
LINK United States Center for Disease Control - Provisional Numbers
Listed in the order of current utilization...
LINK You are Invited to Review My COVID-19 Spreadsheet (XLSX)
There is not an XLS version available for distribution at this time.
Section: 12
Other Features:
LINK US Counties200, States & DC51, Territories & Other Entities11, Nations214,
and the CDC Provisional Counts53
Five Excel Spreadsheet datasets you can sort for your own studies...
Section: 13
Links to other resources:
I cannot vouch for these sites. Please use your own judgement.
LINK Adventist Health Coronavirus Resource Hub - Scroll down for useful info
LINK Antibiotic Vitamin, the (Vitamin D)
Good article on Vitamin D's likely role in prevention of infection. Thanks Blam.
LINK CDC Data for Download - Scroll down - Excel required. Includes death stats.
LINK CDC National Center for Health Services
Provisional deaths as determined by review of vital documents. Much lower...
LINK CDC Secondary Data and Statistics - Portal Entry / Look around
LINK Coronavirus (COVID-19) Map
LINK Coronavirus infection risk may be reduced by Vitamin D
by Former CDC Chief Dr. Tom Frieden
LINK Coronavirus Spread Quickly Around the World in Late 2019, Study Shows
the University College London Genetics Institute
LINK COVID-19 Deaths Broken Out by Thirds, 05/07/20 Map of US Counties
Very revealing display of Concentrated Death Zones - thanks hoosiermama
LINK COVID-19 First U.S. Case, Treatment, features Remdesivir
New England Journal of Medicine article
LINK Cytokine Storm, med Actemra, Physician near death saved
LINK Diamond Princess Review at 634 Case Point of Eventual 712
LINK Hydroxychloroquine Article: International Poll
Daily Mail Reports, Most Effective Treatment According to 6,000 Physicians
LINK Hydroxychloroquine Has about 90 Percent Chance of Helping COVID-19 Patients
the Association of American Physicians and Surgeons, reports 91.6% of patients improved clinically
LINK IHME - Institute for Health Matrix and Evaluation
LINK National Institutes of Health - Cornavirus (COVID-19)
LINK Nasal Irrigation is the Key, COVID-19 Related
LINK New York City - interesting breakdown, borough, age, sex
LINK On the Origin of CCP Virus, A Documentary Movie (turn up the sound)
Epoch Times: I highly recommend this very well documented report.
LINK Rt COVID-19
Calculates and displays the Rt Factor for each state. Thanks FreedomPoster.
LINK World Health Organization

“As mentioned often, the number of Fatalities is what
it’s all about right now.”
Seems as if the % of fatalities to confirmebd cases would be more informative.
Almost 50% of the fatalities are being generated by 4 states (California, Texas, Florida and Arizona) 3 of which are border states.
Not sure what that is telling us but odd that no one seems to have an opinion of that interesting fact.
“””Almost 50% of the fatalities are being generated by 4 states (California, Texas, Florida and Arizona) 3 of which are border states.”””
All four of the states are major migrant labor states.
In Florida there has been major testing of migrant labor camps and the results have been high positivity rates. Not so much death rates among the migrant laborers as they are younger.
So as the migrant laborers move north, they may not spread covid as they have already been infected.
FLORIDA NURSING HOME COVID POSITIVE
Florida also reports the number of covid positive residents and staff in Long Term Care Facilities.
http://ww11.doh.state.fl.us/comm/_partners/covid19_report_archive/ltcf_latest.pdf
DAY STAFF RESIDENTS
23-Jun 2529 1408
2-Jul 3279 2084
3-Jul 3453 2205
4-Jul 3554 2348
5-Jul 3759 2398
6-Jul 3988 2511
7-Jul 4160 2395
8-Jul 4342 2489
9-Jul 4594 2641
10-Jul 4922 2817
Florida has set aside something like 12 nursing homes which only have covid positive residents or staff.
Florida also regularly tests the residents and staff at all nursing homes for covid.
Not sure if there is a trend here or not. But I will continue to follow on a daily basis. What could be concerning is that the number of staff and residents who have tested positive has doubled since June 23.
What are other states reporting????
I have been tracking the numbers posted by CDC and comparing their numbers to the number posted by Worldometer on May 30th.
Yesterday, the CDC did a major data dump and added 3,504 deaths to their previously reported numbers for March, April, and May.
https://www.cdc.gov/nchs/nvss/vsrr/covid19/index.htm
Daily Updates of Totals by Week and State
Provisional Death Counts for Coronavirus Disease 2019 (COVID-19)
The provisional counts for coronavirus disease 2019 (COVID-19) deaths are based on a current flow of mortality data in the National Vital Statistics System. National provisional counts include deaths occurring within the 50 states and the District of Columbia that have been received and coded as of the date specified. It is important to note that it can take several weeks for death records to be submitted to National Center for Health Statistics (NCHS), processed, coded, and tabulated.
“Seems as if the % of fatalities to confirmebd cases would be more informative.”
That really is the only number that matters.
You mean, like the number I have reported many times (and people like you insist that I don't know what I'm talking about)?
Today: US confirmed cases - 3118168.
Confirmed deaths - 133291.
133,291 / 3,118,168 x 100 = 4.275% death rate.
The death rate has been on a downward trend, but I think that might reverse as cases and the death count keep increasing. Deaths from Covid-19 occur from 2 to 6 weeks after infection, with a median of 16 days. There were 63,024 new cases today, the highest ever. Nearly 1% of the US population has now had or has Covid-19.
My numbers differ from Doughty One's numbers because we are collecting data at different timepoints, and our sources update their numbers throughout the day.

I started tracking the number of new hospitalizations of COVID patients in Florida.
Jul 2 = 341
Jul 3 = 244
Jul 4 = 160
Jul 5 = 150
Jul 6 = 380
Jul 7 = 333
Jul 8 = 409
Jul 9 = 435
We have had record numbers of new COVID cases in Florida for over two weeks.
We are seeing an increase in new hospitalizations for COVID infected patients. Not good.
I will continue tracking the COVID hospitalization numbers as it changes.
If other states are reporting covid hospitalizations, it would be good to post the data from those states.
Here is the link to the source document:
http://ww11.doh.state.fl.us/comm/_partners/covid19_report_archive/state_reports_latest.pdf
“Today: US confirmed cases - 3118168.
Confirmed deaths - 133291.
133,291 / 3,118,168 x 100 = 4.275% death rate.”
Man, that is an absolutely imbecilic posting. You are using 2 completely unrelated numbers and drawing a mindless conclusion from them.
I was speaking of people who died FROM China Chop Suey Virus not people who died WITH the Virus. I should heve been more clear.
The media hype is intesifying but it is still hype and purely political.
You obviously are not at all familiar with how meaningful statistics are derived therefor your assertions and conclusions drawn from those are completely erroneous.
Sorry, that post was meant for “Mom”.
That’s the case fatality rate and it’s only meaningful if you have a widespread regular testing program underway. Which we still do not.
The infection fatality rate is what matters. It’s estimated between 0.26% (CDC lower bound) and 1% (upper bound Johns Hopkins likely IFR). The CFR will continue trending down until it more closely matches the actual IFR. Worth noting that 0.26% - 1% is still a LOT of fatalities.
“You obviously are not at all familiar with how meaningful statistics are derived therefor your assertions and conclusions drawn from those are completely erroneous.”
No shit?
I can understand the thought behind that, but seriously, if
say we were headed to 1 million deaths per year, do you
honestly think some ratio would offset the concern over
that?
DFI (daily fatality index) is rising. When the projection below was calculated on 16 June, the running 5 day average was 0.526 with an estimated ending DFI of 0.25. Current 5 day average is now 0.6.

•Blue line represents projected death totals.
•Yellow line is actual death totals based on WorldofMeters.info data.
•Purple line is actual case numbers offset by 14 days.
•Red line represents projected daily deaths.
•Black extension lines are trend lines.
DFI vs CFI

“if say we were headed to 1 million deaths per year, do you
honestly think some ratio would offset the concern over that”
No, but what I see as a problem is the failure (deliberate) to distinguish between deaths caused by the virus and deaths of people with the virus.
We know there is a financial benefit in reporting deaths as being virus caused and we know of the political angle as well.
This more about psyops then anything else.
Disclaimer: Opinions posted on Free Republic are those of the individual posters and do not necessarily represent the opinion of Free Republic or its management. All materials posted herein are protected by copyright law and the exemption for fair use of copyrighted works.