Posted on 08/21/2020 2:48:12 PM PDT by DoughtyOne
PING LIST - Please contact me as needed...
COVID-19 Update # 156
As of 08/20/2020 23:15 PDST United States CDC - Provisional Numbers
As of 00/00/2020 23:45 PDST Johns Hopkins University - Capture Nations Informaton
As of 00/00/2020 23:45 PDST Johns Hopkins University - Capture Counties Information
As of 00/00/2020 23:46 PDST Johns Hopkins University - Process JHU Data
As of 00/00/2020 23:59 PDST WorldofMeters - Document Core Numbers
As of 00/00/2020 23:59 PDST WorldofMeters - Capture Nations Information
As of 00/00/2020 23:59 PDST WorldofMeters - Capture States Information
As of 00/00/2020 00:00 PDST WorldofMeters - Data Processing begins...
As of 00/00/2020 ??:?? PDST Publish COVID-19 Update - 00/00/00
Thank you for stopping by to check out the COVID-19 Update.
Here you can find...
Section: 01 Commentary, Special Reports, COVID-19 Update Info, & System Notes
Section: 02 the United States Situation
Section: 03 the Global Community Situation Outside China
Section: 04 the Global Community Situation Including China with reservations
Section: 05 the Mortality Report
Section: 06 Miscellaneous Reports of Interest
Section: 07 the United States, Counties (alphabetical / case no descending)
Section: 08 the United States, States Ranking, Provisional Numbers, & Territories
Section: 09 the United States, Ranked with Other Nations
Section: 10 the End of this COVID-19 Update
Section: 11 Data Sources and a Link to My Own Spreadsheet
Section: 12 Linked Spreadsheet: Counties, States, Provisional, Territories, & Nations
Section: 13 Links to Other Resources
Section: 01
Commentary, Special Reports, and COVID-19 Update Information3
Interesting Tid-bits (hopefully)
Fatalities and New Cases in the United States
Fatalities fell by 171 cases from the previous day, to come in at 1,084
yesterday. That was a 15.58% decrease from the same day the week before.
New Cases rose by 414 from the day before, to come in at 45,372.
That was an 18.05% decrease from the same day the week before.
Fatalaties and New Cases on the Global Scene
Fatalities fell by 514 cases from the previous day, to come in at 6,127
yesterday. That was a 39.63% decrease from the same day last week. 8 days
earlier there were very few Fatalities reported. The next day, seven days
ago came in real heavy, so that was a make-up day and compartisons are not
normal. Please keep that in mind.
New Cases rose by 9,998 from the day before, to come in at 283,092.
That was an 8.66% decrease from the same day the week before.
Little Better Explanation of the Dashboard
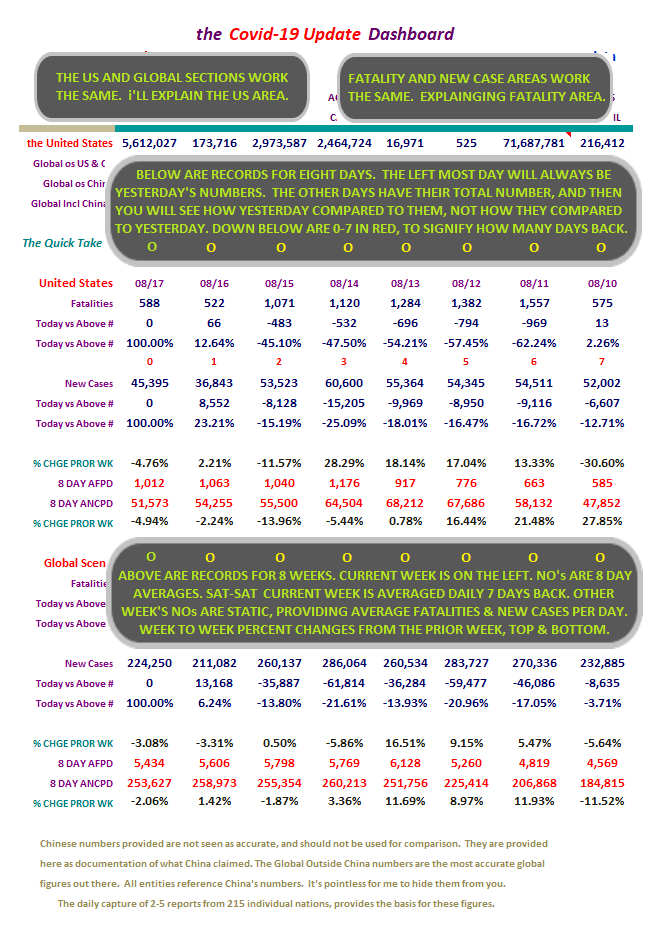
If you haven't been able to make heads or tails of the Dashboard, I can't
say as I blame you. I've not been real happy with my lack of explaining
exatly what was going on there. It's mostly intuitive, but I could have
helped more.
The Dashboard is now active. You can click on it to get a better explanation
of what is going on there. When you are done, delete the new tab.
(data on the eplanation sheet, will not be live - it will be dated)
Lack of space does still leave the explanations somewhat cryptic, but I believe
it is better. I will be improving it over the next week or so.
I did want to mention that in the bottom weekly averaging area, you should think
of those red 0-7 numbers above as weeks past, instead of days past.

Section: 02
The Following Addresses the Numbers Here in
the United States of America
Here we go...

The declared New Case level rose yesterday by 414 cases, which left the
daily total at 45,372 cases.
Concept of adding in Active Cases and Serious Critical here, courtesy of amorphous
Here are more of our numbers...

Active Cases were on the rise again yesterday, and the Serious/Critical case
count dropped to wind up under 17,000 for the third day in a row.
Our Slice of the COVID-19 Pie
The growth of our slice of the pie has been increasing recently.
Here are the numbers I've been tracking, Globally Declared and Active Cases.

Both areas here looked better.
Active Cases in the United States / Chart
Unlike some of the other charts here, we should see a good rise and
fall at some point withone.
Note that this presents the single, seven, and fourteen day averaging versions.

Remember, these are not new Declared Cases. These are remaing Active Cases.
Back in early June, I was hoping we were finally seeing the light. Welllll...
not exactly. Look where we've gone from there. Now the red seven-day averaging
line is beginning to resemble the same flattening from that June period. I hope
that matures with the U. S. making a good go at defeating this disease.
Testing and New Case Figures
Requested by stocksthatgoup
Some folks have shown an interest in seeing the COVID-19 Test figures compared
to the New Cases being declared. The following Data addresses that. The size
of it just doesn't seem reasoned to me.
Why/how could the posive portion of the popoulace vary ass much as 2.0% from day
to day? I could a lot easier see a 2.0% trend over three or four days. One day?
Nah.

The number of tests changed little yesterday. The 14 day Postive Testing
average continued downward movement, for the fourth time out of the last five
days. This was an even lower number and the lowest point since July 3rd.

That smooth 14 day averaging line makes it clear what path we're on.
Now while I call that smooth and compared to the other lines it is, it is still
showing bumps due to the data in this metric jumping around considerably from
day to day.
The U. S. Stats / w 10 Day Averaging / Fr: 03/17
Requested by: Texas Eagle
This data and chart presents things in a little different way. In the
chart it is easy to see the relationship of these numbers.
The Chart will use the data all the way back to 03/17, but the data displayed
here will only go back one month.

Here is the chart to match.

New Case declarations seem to be tapering off ever so slightly, according to
that blue top line there.
Active Cases are flattening in the United States. That's good to see.
I like the complexity of this chart compared to the global version that looks
pretty textbook by comparison.
United States Movers and Shakers...
I will present the U S States with the most New Cases and New
Fatilities rankings.
Here we go...

Yesterday California took the top spot in New Cases, and Texas took the top
spot for Fatalities. Somehow California has been able to stay below the lead
of Fatalities despite have a high level of cases. Don't let me mislead you
though, it was second in the number of Fatalities yesterday.
Section: 03
The Following Addresses the Global Numbers
without Mainland thereChina
Here is the first set of Data for the Global Outside China
Territories

New Cases remained on an upward trend in this the higher period of reporting
each week.
Fata.lities, Recoveries, Resolved, Active Cases, and
Serious/Critical Cases - Globally, Excluding M/L China
Concept of adding in Active Cases and
Serious/Critical here, courtesy of amorphous
Here we go...

Active Cases grew again yesterday.
Active cases have been falling more often. The chart does show Active Cases
flattening.
How is the Global Community Outside China Doing,
Without U. S. numbers?
Let's see...

This number went much higher again yesterday winding up with the largest number
we've seen. The previous high was 229,391. Yesterday we wound up at 237,698.
Since our numbers are down, if there is a high volume day, the Global Scene will
carry the brunt of it.

Okay, look at that. Levels were higher during this the higher reporting
period of the week. We (the US) still remained lower than we have been.


The blue line for the U. S. was headed down, then pretty much flat, but
over the last few days there has been a marked movement down. Let's hope that
continues.
The Active Cases outside China Globally / Chart
As in the U. S. version of this, we should see a good rise and fall at
some point these two.
Note that these present the one day and then 7 and 14 day averaging versions.


Remember, these are not new declared Cases. These are remaing active cases.
Special Section on France, Germany, Italy, Spain, and the U. K.
Case growth.
Jim Noble mentioned he'd like to see the US numbers added here. I added them
in on 06/21/2020. I did not add them to the chart because it would have
dwarfed the European nations chart lines. (they would have been reduced to
about 15% of their normal size)
Let's Look at Some Numbers in Five Day Increments:


Spain - OUCH!
France - Ooo
Sweden and It's Neighbors, Who Has the Best Tactic Against COVID-19?
Sweden is doing its own thing with regard to isolating. I think most people
are aware of it by now.
Here are some numbers to help us look at this issue.


Sweden's numbers were growing more rapidly than they had been, but in recent
days it seems to be correcting for it. It's still pretty high growth. Granted
not as bad as at other times.
The Nethherlands New Cases have taken a decided turn for the worse.
Global Movers and Shakers...
I will present the top fifty nations with the most New Cases and New
Fatilities.
Here we go...

India had the most New Cases yesterday by a pretty wide margin. Brazil
took the top spot for Fatalities, and we come in a ways below them.
Global osChina Stats / w 10 Day Averaging / Fr: 03/05
Requested by: Texas Eagle
This data and chart presents things in a little different way. In the
chart it is easy to see the relationship of these numbers.
The Chart will use the data all the way back to 03/05, but the data
displayed here will only go back one month.

Here is the chart to match.

This chart reveals a flattening of Active Case growth. There have been some drops in this area recently.
Section: 04
The Following Addresses the Global Numbers
including Mainland China*
Mainland China's numbers are 0.008% of today's total global numbers.
A Look at Declared, Resolved<, and Active Cases, Includes M/L China
End of day figures follow:

Well we did make it to over the 71.00% rate of Resolved Cases.
I'm glad to see that, and wonder how much higher that will go in the short term.
Fatalities, Recoveries, Resolved, Active, and Serious/Critical
Cases Globally, Including M/L China
Concept of adding in Active Cases and
Serious/Critical here, courtesy of amorphous

Active Cases grew here yesterday. They had been dropping each day recently.
Just for a few days though.
Section: 05
the Mortality Report
Here is the data for four entities...
Here are the figures for the growing case totals for four entities.

We hear all sorts of stories about how these figures are wildly off. The CDC
has studied them and seems to think they may actually be on the low side of
things. I am providing the CDC Provential Numbers down below. Not sure if
anyone has a rock solid number. I doubt it is possible. This is what is
reported out by WoM and JHU. Check out the CDC numbers too.

Charts like this one only show growth. That's why I recently took the advice
of a FReeper and added in a new chart for the U. S. and Global outside China
regions.
Here are figures revealing the daily growth for those four entities.

Fatalities dropped decently yesterday, despite our being in the higher
reporting days of the week.


Since the beginning of COVID-19's activity in the U. S., higher New Cases were
soon followed by elevated Fatalities. If we have gone to school on the data
of this disease, we know who should avoid exposure the most. So if the
demographic that has little to fear from the disease is out there getting
infected, it may not be a bad thing at all. If the Fatalities remain low,
vastly higher cases may simply increase the rapidity of the saturation of the
people in public who have already fought it off. And that may facilitate the
end of the disease. I'm sure others know this, but I did want to explain why
my thinking has fluctuated over time regarding these dynamics.
Here, let's look at data for the U. S. broken out by itself.

Our Fatalities fell off yesterday, coming in 15.58% lower than the same day
the week before.

We moderated lower yesterday, down 13.63% from the previous day.
Section: 06
Population Saturation
Here are figures revealing how many people in each population base represent one
case. I'm also showing what percent of each population base is infected at this
time.

This area wasn't quite as good yesterday as it has been recently.
Nations With Lots of Cases
At the end of the day yesterday, there were:

It's hard to belive there are that many nations with 1,000 cases.
Daily Case Report Evaluation
I'll be keeping tabs on the daily tallies for days of the week for a while. Folks have
noticed some patterns of larger and smaller data entry on certain days, and on Fridays
sometimes the numbers get noticeably larger because of it.
And we now know Thursdays have potential to break out also. Yikes!
IMO Let's check out the numbers and a chart.


For the time being, we're not seeing the break out numbers to the high side
we were seeing weeks back. We seem to have plateaued just shy of 300,000
cases per day.
Section: 07
The Top 200 Counties in the U. S., by Number of Cases
This little report lists 200 Counties in the United States in declining Case numbers.
There is also a listing that is alphabetical. This report list only the entities
and the number of Cases in the two different sorts.
It will also be available as a downloadable Excel file in Section 12.

For months Puerto Rico was showing up with the Counties. That stopped in early July
if memory serves me well.
Section: 08
States of the Union and the District of Columbia, Compared to Each Other
Each of these pages is sorted differently. Look at the red header above
the columns to see which column was used for the sort on any given page.

For your review...

For your review...

For your review...

For your review...

For your review...

For your review...

For your review...

For your review...

For your review...
If this area interests you, please use this LINK to the source, and review
the lengthy description and explanation of it's development process.
There are two reports. The presentation above comes from the second one,
and the detailed segmented information below it, may interest you.

These can now also be found under the states on the Alphabetical list. The
states and these entity's numbers should be combined to match that of the
U. S. figures each day.
Section: 09
The United States, Where it Ranks With Other Nations?
Each of these pages is sorted differently. Look at the red header above
the columns to see which column was used for the sort on any given page.
The U. S. will be highlighted red here so we can find it easily in the list.
There was 215 nations on this list last night now. I didn't want to post
seven lists with 215 nations on it, so I picked the top 50. Coincidentally,
one report category had the U. S. at 41st, so it wasn't showing up on the
list with the 31 top nations on it. That wasn't the reason why I extended the
list length, but it did work out well.
I work on the nations right next to the states on my spreadsheet. The
states with the District of Columbia come in at a total of 51 lines.
I decided to keep the international reports near that length, and 50
was good enough.
Here we go... for your review.

For your review...

For your review...

For your review...

For your review...

For your review...

Around 06/23, China started putting out it's testing numbers. I thought
they were suspect. The number they put out was 90,410,000. Ours and most
everyone else's numbers are specific. For instance on 06/28, our number of
of tests at the ned of the day was 32,592,368. That specificity separates it
from the number China put out. It was rounded to the 10 thousandth place. In
addition, China has not updated that number once. So I do not inlude China in
the Nation's Comparison Sort regarding Testing, and any place that reports out
global testing numbers for a top level comparison.

We rose to the 17th spot recently and were able to hang on to it again
yesterday.
Section: 10
Here is what it is all about. From January 20th to the present.

This concludes our look back at yesterday's data. Take care...

Section: 11
Data for this Report Sourced From:
LINK WorldoMeters
LINK Johns Hopkins University
The Center for Systems Science and Engineering (CSSE)
LINK United States Center for Disease Control - Provisional Numbers
Listed in the order of current utilization...
LINK You are Invited to Review My COVID-19 Spreadsheet (XLSX)
There is not an XLS version available for distribution at this time.
Section: 12
Other Features:
LINK US Counties200, States & DC51, Territories & Other Entities11, Nations219,
and the CDC Provisional Counts53
Five Excel Spreadsheet datasets you can sort for your own studies...
Section: 13
Links to other resources:
I cannot vouch for these sites. Please use your own judgement.
LINK Adventist Health Coronavirus Resource Hub - Scroll down for useful info
LINK Antibiotic Vitamin, the (Vitamin D)
Good article on Vitamin D's likely role in prevention of infection. Thanks Blam.
LINK CDC Data for Download - Scroll down - Excel required. Includes death stats.
LINK CDC National Center for Health Services
Provisional deaths as determined by review of vital documents. Much lower...
LINK CDC Secondary Data and Statistics - Portal Entry / Look around
LINK Coronavirus (COVID-19) Map
LINK Coronavirus infection risk may be reduced by Vitamin D
by Former CDC Chief Dr. Tom Frieden
LINK Coronavirus Spread Quickly Around the World in Late 2019, Study Shows
the University College London Genetics Institute
LINK COVID-19 Deaths Broken Out by Thirds, 05/07/20 Map of US Counties
Very revealing display of Concentrated Death Zones - thanks hoosiermama
LINK COVID-19 First U.S. Case, Treatment, features Remdesivir
New England Journal of Medicine article
LINK Cytokine Storm, med Actemra, Physician near death saved
LINK Diamond Princess Review at 634 Case Point of Eventual 712
LINK Hydroxychloroquine Article: International Poll
Daily Mail Reports, Most Effective Treatment According to 6,000 Physicians
LINK Hydroxychloroquine Has about 90 Percent Chance of Helping COVID-19 Patients
the Association of American Physicians and Surgeons, reports 91.6% of patients improved clinically
LINK IHME - Institute for Health Matrix and Evaluation
LINK National Institutes of Health - Cornavirus (COVID-19)
LINK Nasal Irrigation is the Key, COVID-19 Related
LINK New York City - interesting breakdown, borough, age, sex
LINK On the Origin of CCP Virus, A Documentary Movie (turn up the sound)
Epoch Times: I highly recommend this very well documented report.
LINK Rt COVID-19
Calculates and displays the Rt Factor for each state. Thanks FreedomPoster.
LINK World Health Organization

Texas appears to be in downtrend in deaths. Louisiana flattening. Florida is still there making us guess. Has it’s peak already come and gone? If we can get Florida under control, my best guess is we will see new lows coming nationally. Cases are way down, but we all knew counting cases was always a bad way to look at this virus.
Thank you D1 !
So in the U.S.A., we’ve had 73,870,797 COVID-19 tests so far to detect 5,746,534 cases. Very interesting. That’s a whole lot of testing going on. Thanks!
Pretty much the same:
Case numbers continue a gradual decline. Fatalities continue to steadily increase and are closely tracking projections.
I've seen reports fatalities should begin to decline next week. Let's hope!
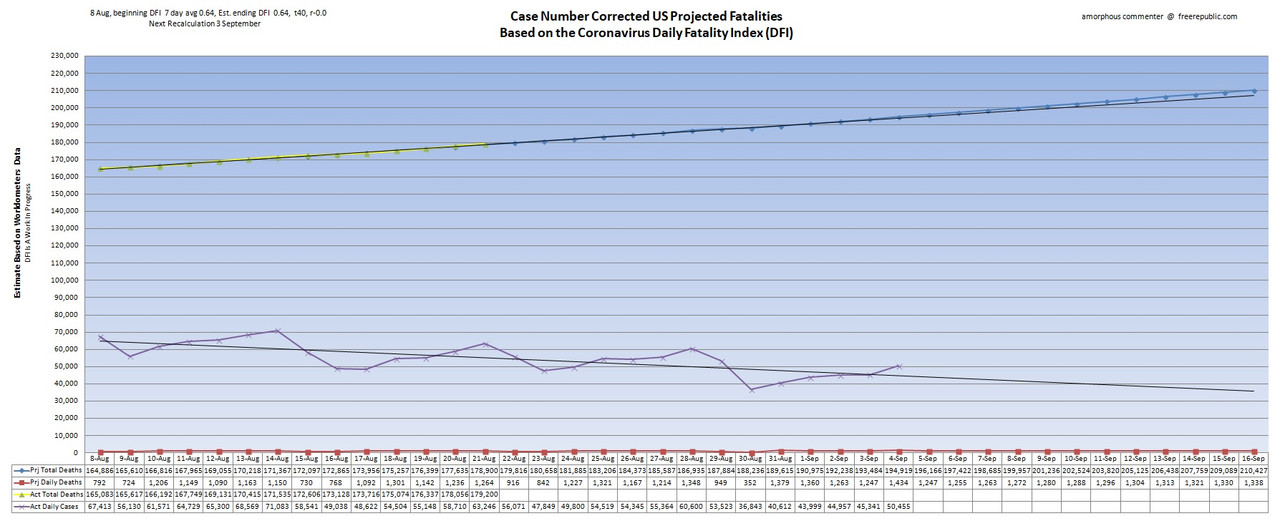
•Blue line represents projected death totals.
•Yellow line is actual death totals based on WorldofMeters.info data.
•Purple line is actual daily cases offset by 14 days.
•Red line represents projected daily deaths.
•Black extension lines are trend lines.
Yes, that is a lot of testing huh.
Frustrating.
I could research to see if the time from onset to death has changed... or I could be lazy and just see what happens next week or two and assume some change in that factor is the cause.
Case numbers began a descent when HHS became the point organization for incoming reports. I noticed at least a day delay in the data too. As you said, this coming week should tell the tale.
Disclaimer: Opinions posted on Free Republic are those of the individual posters and do not necessarily represent the opinion of Free Republic or its management. All materials posted herein are protected by copyright law and the exemption for fair use of copyrighted works.