
Posted on 10/28/2020 8:17:39 PM PDT by DoughtyOne
PING LIST - Please contact me as needed...
COVID-19 Update # 224
As of 10/27/2020 23:15 PDST United States CDC - Provisional Numbers
As of 00/00/2020 23:45 PDST Johns Hopkins University - Capture Nations Informaton
As of 00/00/2020 23:45 PDST Johns Hopkins University - Capture Counties Information
As of 00/00/2020 23:46 PDST Johns Hopkins University - Process JHU Data
As of 00/00/2020 23:59 PDST WorldofMeters - Document Core Numbers
As of 00/00/2020 23:59 PDST WorldofMeters - Capture Nations Information
As of 00/00/2020 23:59 PDST WorldofMeters - Capture States Information
As of 00/00/2020 00:00 PDST WorldofMeters - Data Processing begins...
As of 00/00/2020 ??:?? PDST Publish COVID-19 Update - 00/00/00
Thank you for stopping by to check out the COVID-19 Update.
Here you can find...
Section: 01 Commentary, Special Reports, COVID-19 Update Info, & System Notes
Section: 02 the United States Situation
Section: 03 the Global Community Situation Outside China
Section: 04 the Global Community Situation Including China with reservations
Section: 05 the Mortality Report
Section: 06 Miscellaneous Reports of Interest
Section: 07 the United States, Counties (alphabetical / case no descending)
Section: 08 the United States, States Ranking, Provisional Numbers, & Territories
Section: 09 the United States, Ranked with Other Nations
Section: 10 the End of this COVID-19 Update
Section: 11 Data Sources and a Link to My Own Spreadsheet
Section: 12 Linked Spreadsheet: Counties, States, Provisional, Territories, & Nations
Section: 13 Links to Other Resources
Section: 01
Commentary, Special Reports, and COVID-19 Update Information4
Interesting Tid-bits (hopefully)Fatalities and New Cases in the United States
Fatalities rose by 504 cases from the previous day, to come in at 1039
yesterday. That was a 12.08% increase from the same day the previous week.
Last week we had one day with over 1,000 fatalities. It took place
on Wednesday. This week we have one on Tuesday. This is earlier
in the week, but Fatalities seem to report out on a different schedule than
the cases. Their highest days are sometimes at the start of the week rather
than later on. We'll have to watch to see if we have more 1,000 plus days
this week than last. In the last wave, we saw our fatalities rise during
the increase in New Cases. We should touch on the issue that an increase
of a few hundred fatalities, while is not good, still is a very small number
compared with 331 million people. As always, I urge folks to keep things
in perspective.
New Cases rose by 1,643 from the day before, to come in at 75,247
yesterday. That was an 18.21% increase from the same day the week before.
This was the second highest single day for New Cases, and second only to
the day before.
Fatalaties and New Cases on the Global Scene
Fatalities rose by 1,308 cases from the previous day, to come in at 6,883
yesterday. That was an 18.97% increase from the same day the previous week.
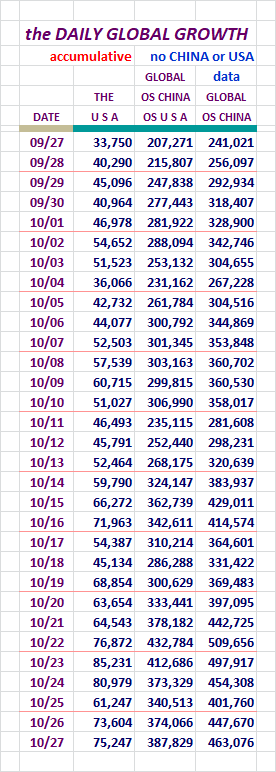
New Cases rose by 15,432 cases from the day before, to come in at 463,118
yesterday. This was an 16.62% increase from the same day the week before.
The United States Declared Cases Rose to Another Milestone
The United States declared it's 9 millionth case of COVID-19 yesterday. We
should consider that a high number, but our Active Case level was only
2,927.982 at the end of the day.
Remember also that these cases can range from no symptoms to severe symptoms
so don't automatically think all these people are raging sick. Most are
not.
I think most of you know this, but there are some folks certain I'm
working for the democrats here, so I'll have to treat you like children for
a moment so they aren't too damaged by this information.
New Global Declared Cases Rose to Another Milestone
The Global Community saw it's 44 millionth case of COVID-19 yesterday.
at the end of the day, out of over 7 billion people, there were 10,735,149
active cases around the planet.

Section: 02
The Following Addresses the Numbers Here in
the United States of America
Here we go...
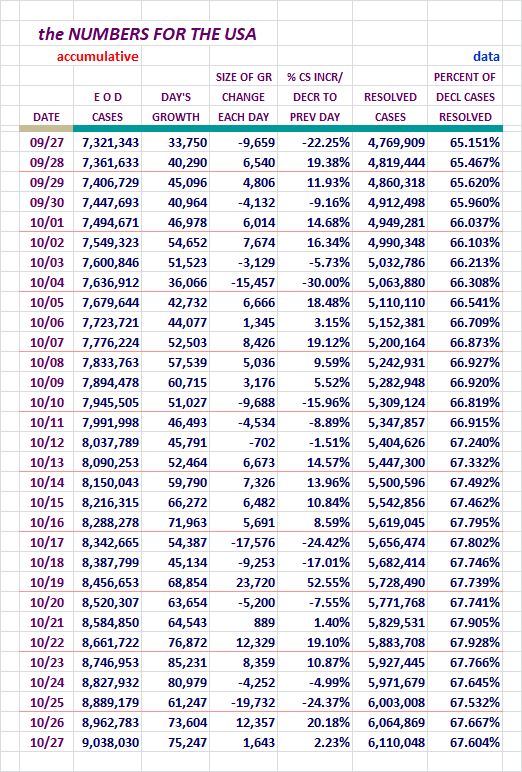
New Case Declarations rose by 1,643 cases yesterday.
Please take note of the Resolved Percentage level on the right.
It fell yesterday.
The number is significant enough now to take note of it daily now.
Concept of adding in Active Cases and Serious Critical here, courtesy of amorphous
Here are more of our numbers...
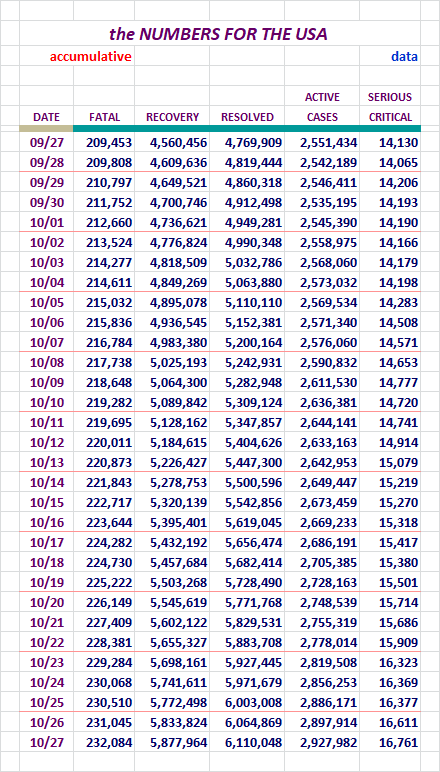
Active Cases rose by 30,068 cases yesterday.
Serious/Critical cases rose by a significant number, and are now mor than
2,600 case higher than they were 30 days ago.
Our Slice of the COVID-19 Pie
The growth of our slice of the pie has been decreasing recently.
Here are the numbers I've been tracking, Globally Declared and Active Cases.
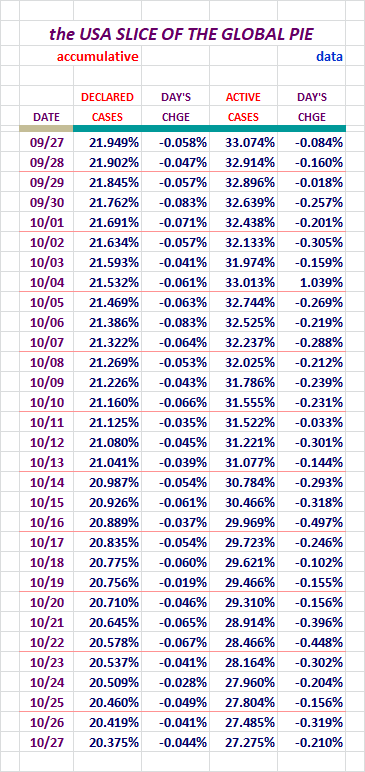
This area has been looking a little better day by day, for around a month now.
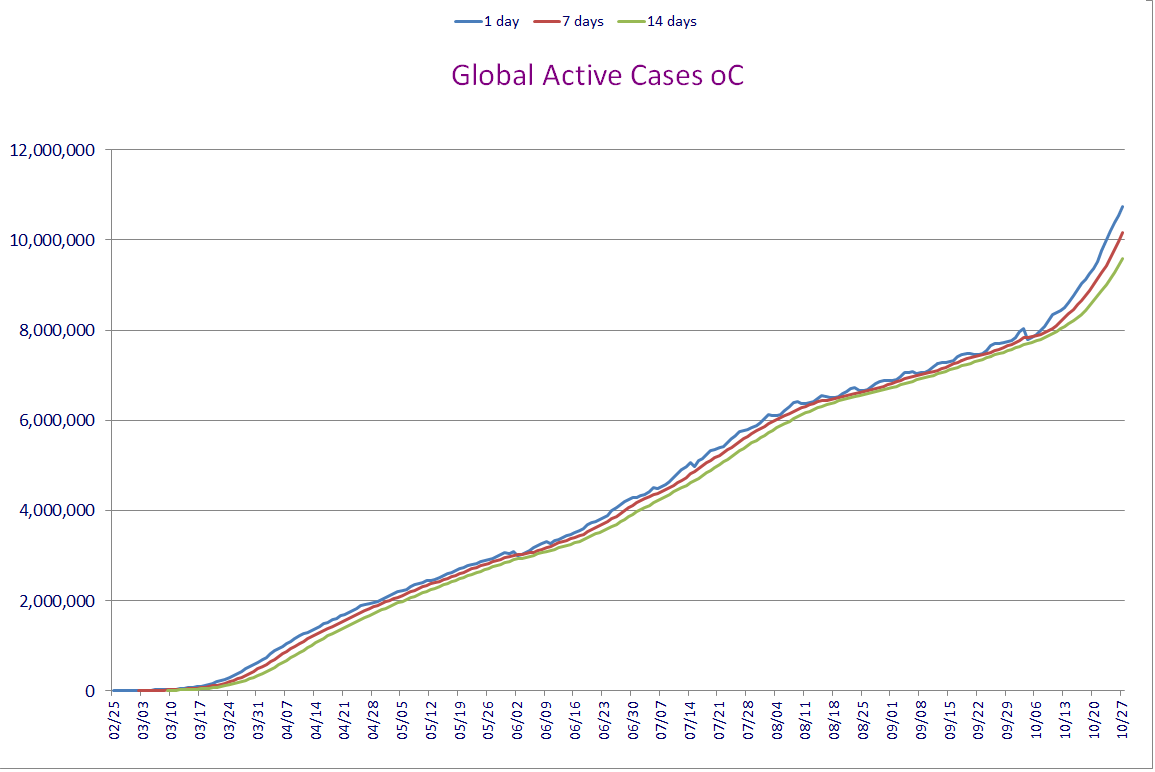
Active Cases in the United States / Chart
Unlike some of the other charts here, we should see a good rise and
fall at some point withone.
Note that this presents the single, seven, and fourteen day averaging versions.
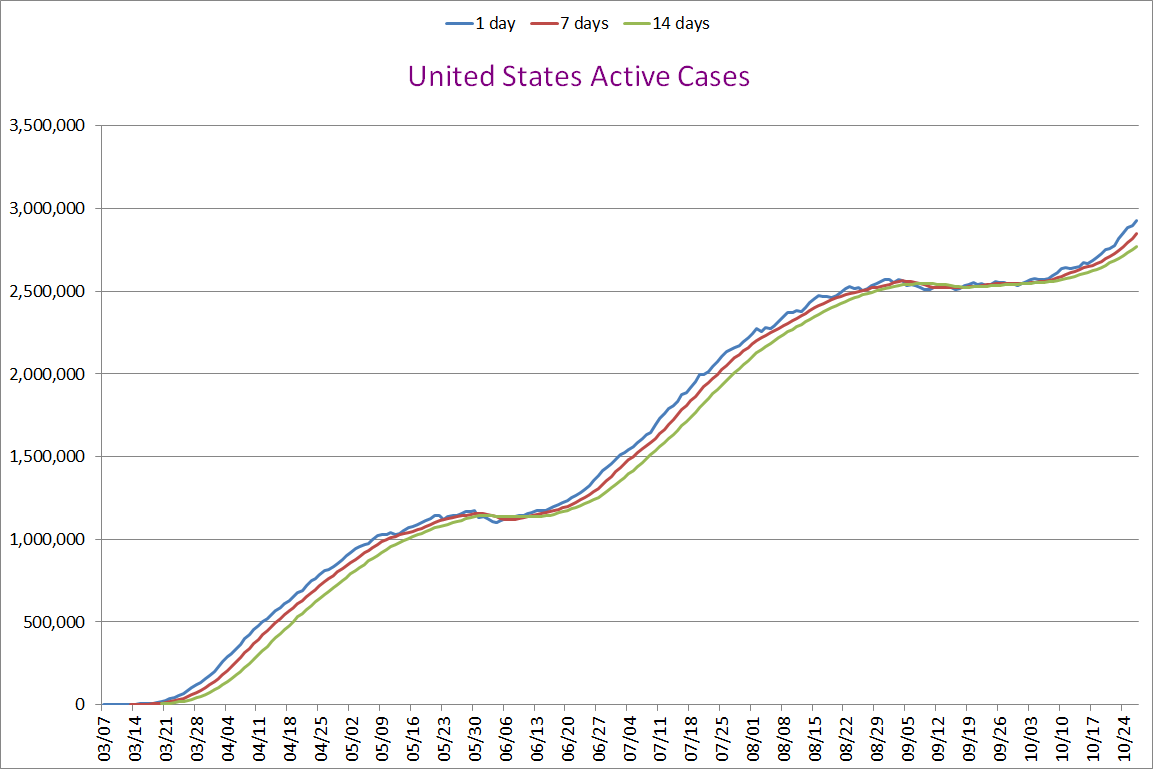
Remember, these are not new Declared Cases. These are remaing Active Cases.
The Active Cases are rising day by day. Using this metric we are experiencing
a new wave at this time. About all we can do is wait to see how severe it
becomes. Severe is probably the worng word here, but I think you know what
I mean.
I reference it as the third wave, but Fauci has let it be known, he still thinks
we're on the first wave. He may be right. I'm not sure what the scientific
requirements are to declare a wave over. If it settles down, that seems like
an end to me, and the chart looks for all the world like a third wave is in full
swing now.
Testing and New Case Figures
Requested by stocksthatgoup
Some folks have shown an interest in seeing the COVID-19 Test figures compared
to the New Cases being declared. The following Data addresses that. The size
of it just doesn't seem reasoned to me.
Why/how could the posive portion of the popoulace vary ass much as 2.0% from day
to day? I could a lot easier see a 2.0% trend over three or four days. One day?
Nah.
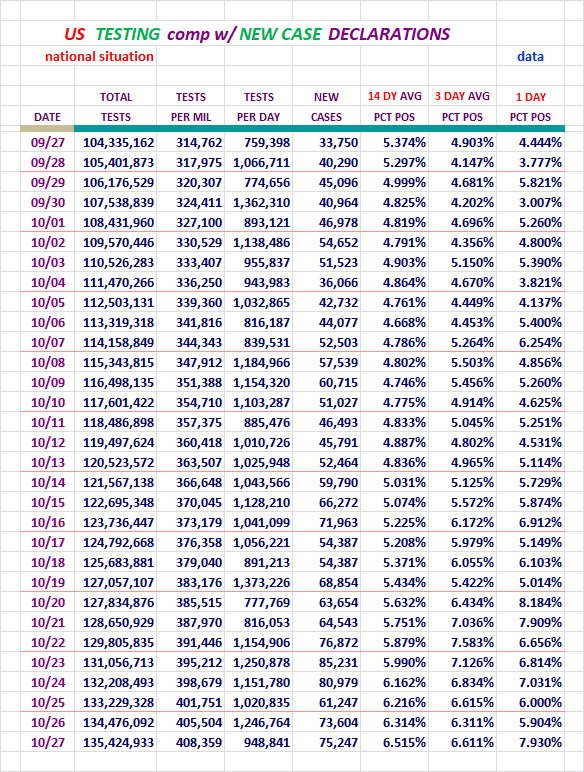
Testing dropped off by a little under 300,000 tests yesterday, to come in at
948,841 tests. None the less, our cases rose. The single day positive
percentage seems to have playing into that. It was up 2.00% on the day.
Postive test percentages rose even higher on the 14-day chart line. The
3-day and single-day chart lines dropped. Keep it up... drop more...
As long as the 3-day and Single-day positives remain high, the 14-day will
creep up. Look how much it has crept up already.
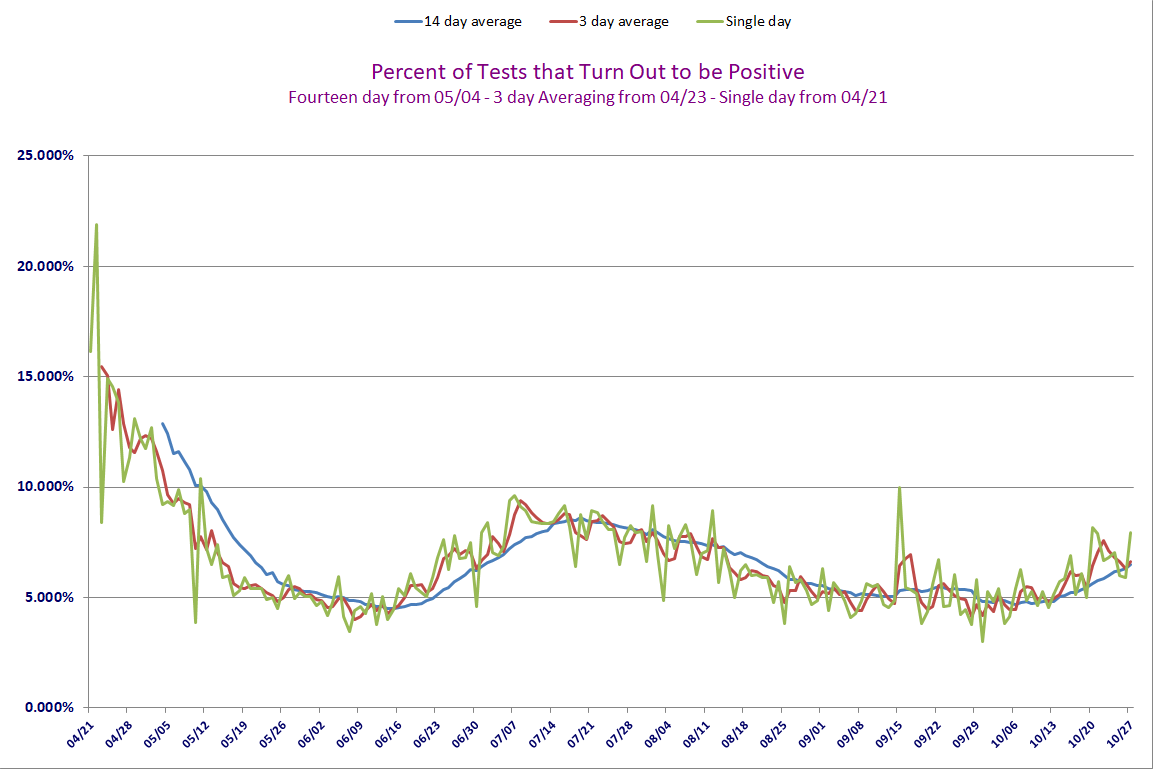
Positve Percentages are clearly rising in the body of people being tested
in recent days. I use the 14-day figure when addressing this. The other
figures are too volitale to make reasoned long term claims about.
It should be noted that the 3-day and Single-day rose yesterday. That
contributes to the 14-day going or remaining higher.
The U. S. Stats / w 10 Day Averaging / Fr: 03/17
Requested by: Texas Eagle
This data and chart presents things in a little different way. In the
chart it is easy to see the relationship of these numbers. I may be wrong
not to do so, but I don't plan to put much weight in those figures for a
few days until they normalize.
The Chart will use the data all the way back to 03/17, but the data displayed
here will only go back one month.
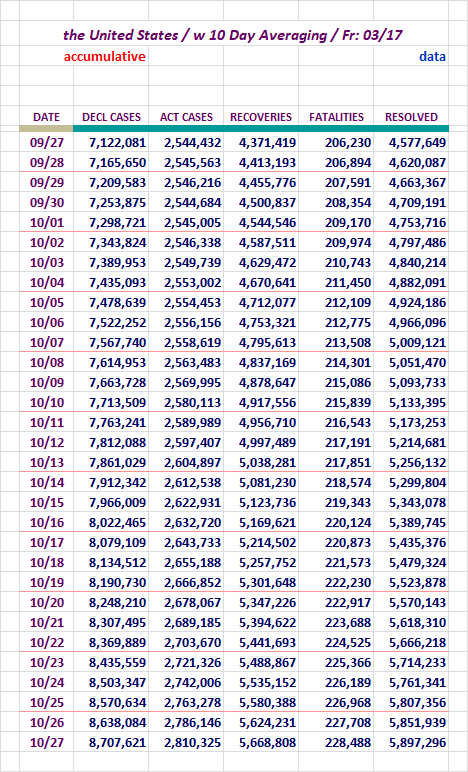
Here is the chart to watch.
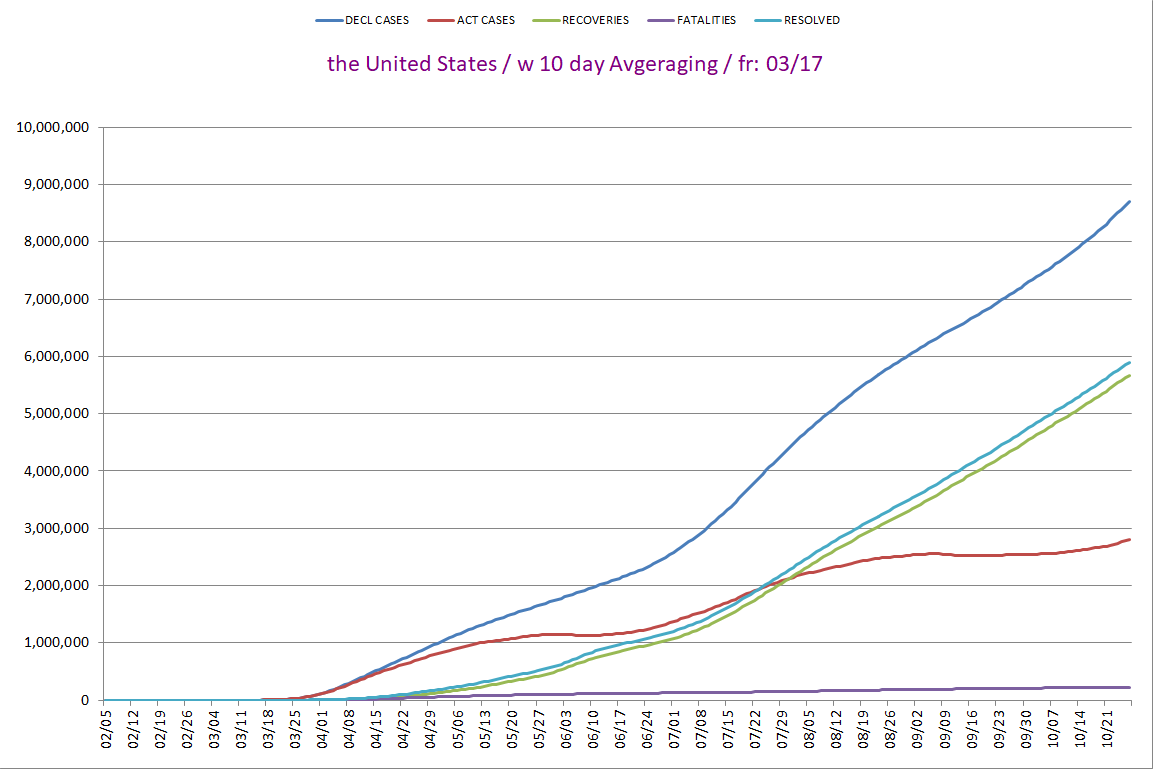
The New Case Declarations line is moving on up.
The Active Case line is rising.
I have been saying I wasn't too happy with the Recoveries and Resolved Cases
lines there. At the present time they don't seem moving toward flattening any
longer. They may show some strengthling almost imperceptibly.
Compare to the rise of Recovered and Resolved cases on the Global Scene to see
a different more healthy trajectory. These look lethargic by comparison, but a
a little less so.
You can right click view to see the Global Chart enlarged.
United States Movers and Shakers...
I will present the U S States with the most New Cases and New
Fatilities rankings.
Here we go...
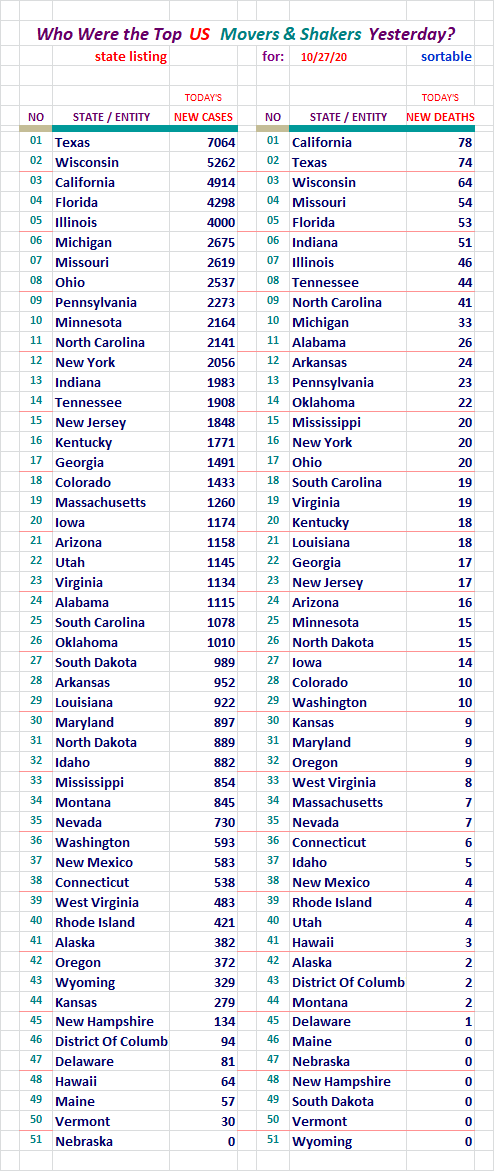
Texas and California took the top spots yesterday, but Texas was right
on California's heels when it came to Fatalities.
Section: 03
The Following Addresses the Global Numbers
without Mainland China
Here is the first set of Data for the Global Outside China
Territories
New Case Declarations rose by 15,406 yesterday.
The Resolved Percentage fell off a little again.
Fatalities, Recoveries, Resolved, Active Cases, and
Serious/Critical Cases - Globally, Excluding M/L China
Concept of adding in Active Cases and
Serious/Critical here, courtesy of amorphous
Here we go...
Active Cases rose by 191,441 cases, in accordance with the large number
of New Cases declared yesterday. Serious/Critical cases rose up also by
over 900 cases. Not good.
80,006 is a big number for this metric. What it means is
that we have a larger body of people who are struggling to remain alive.
We want that number to be as small as possible.
How is the Global Community Outside China Doing,
Without U. S. numbers?
Let's see...
The middle/important number rose yesterday. It could have been bigger,
But the United States larger than normal number mitigated it to a
certain extent.
Global and domestic numbers rose here yesterday. It's that time of
the week.
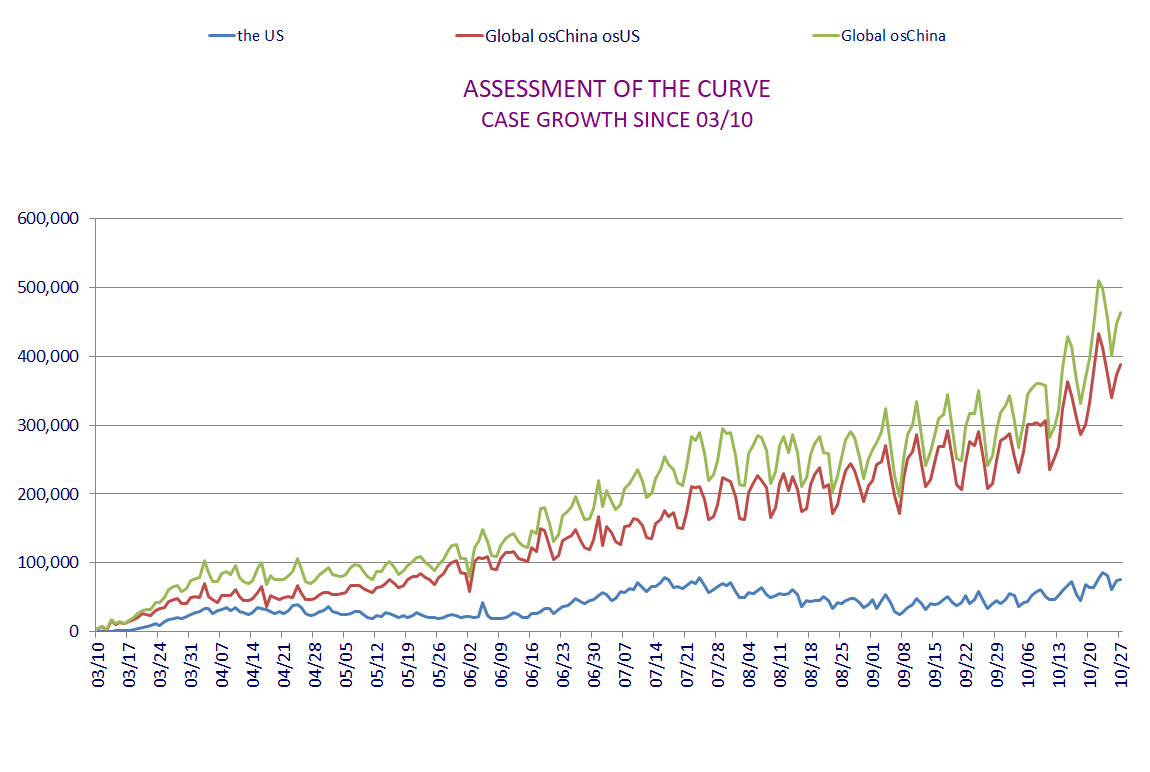
The blue line depicting New Cases, is still trending up steadily.
It appears to be higher than the peak of the second wave. Sure
would like to see this moderate shortly.
One thing we can be thankful for, is that our line is not breaking out
upward like the Global Community is. (of course our numbers do contribute
to that also.
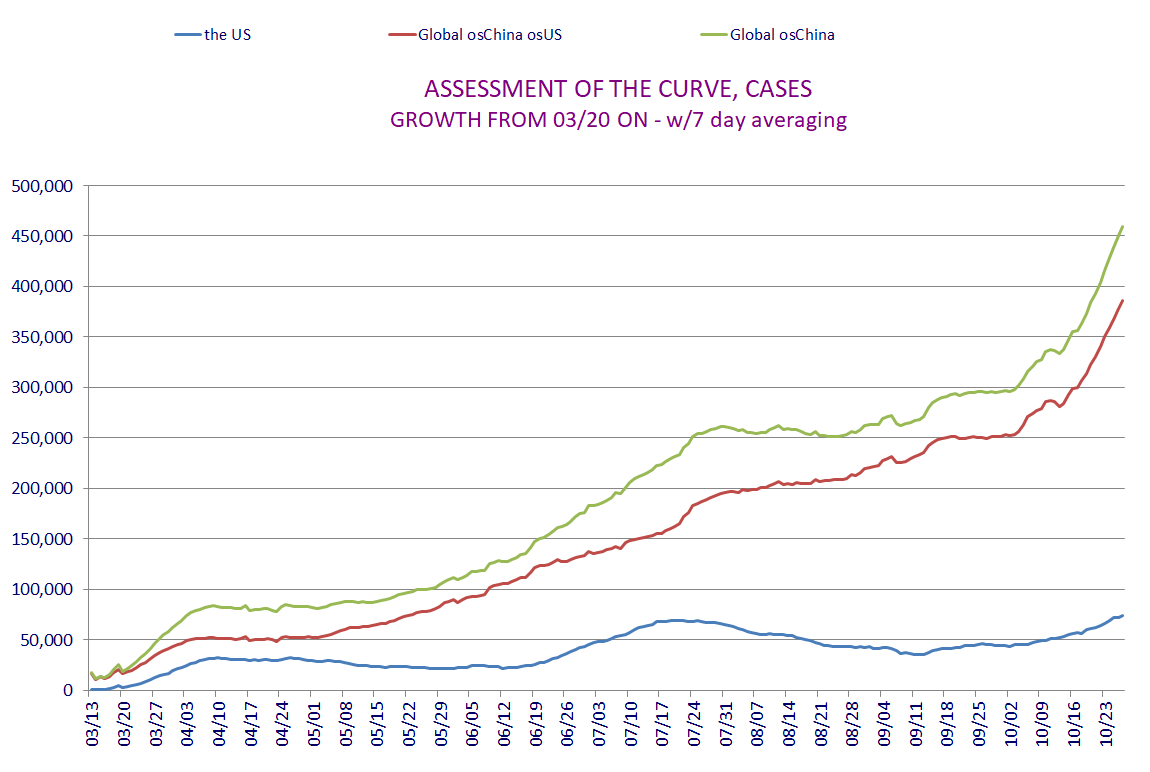
The Active Cases outside China Globally / Chart
As in the United States' version of this, we should see a good rise and fall at
some point these two.
Note that these present the one day and then 7 and 14 day averaging versions.
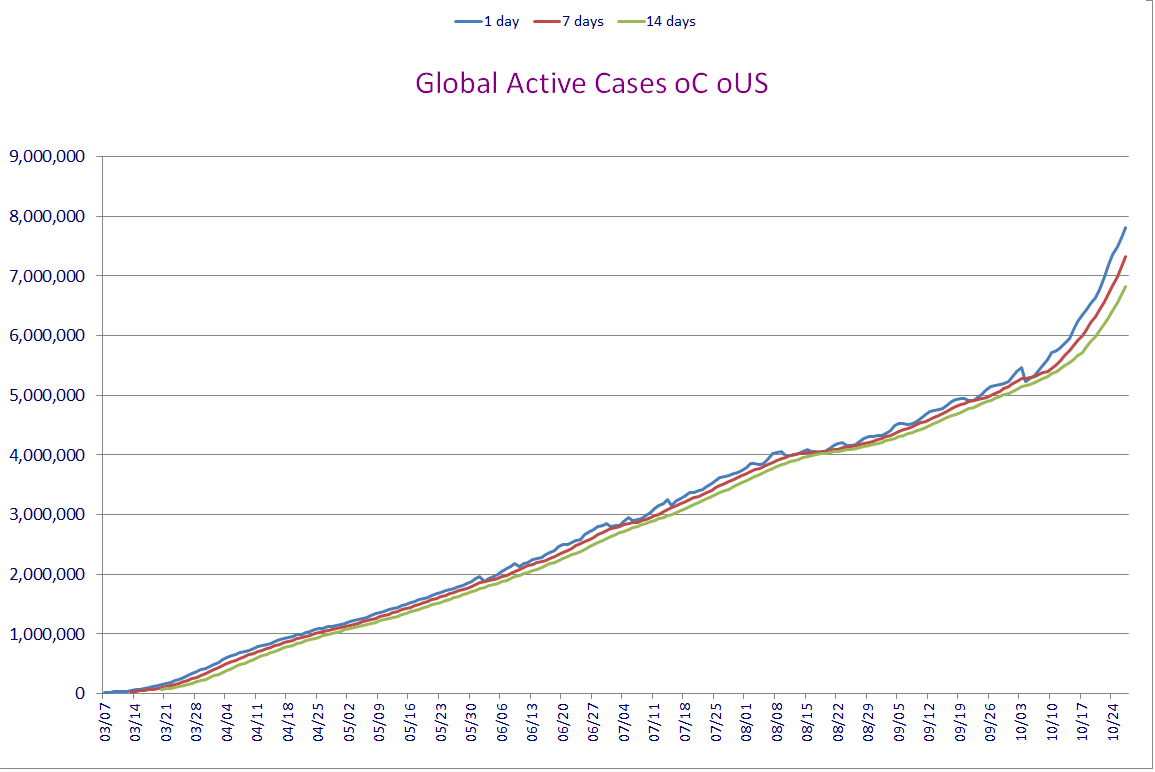
Global Active Cases are growing considerably, and both the above charts are
showing an uptick more clearly each day now. The format of the graph is
looking considerably modified in recent days over the past.
Special Section on France, Germany, Italy, Spain, and the U. K.
Case growth.
Jim Noble mentioned he'd like to see the US numbers added here. I added them
in on 06/21/2020. I did not add them to the chart because it would have
dwarfed the European nations chart lines. (they would have been reduced to
about 15% of their normal size)
Let's Look at Some Numbers in Five Day Increments:
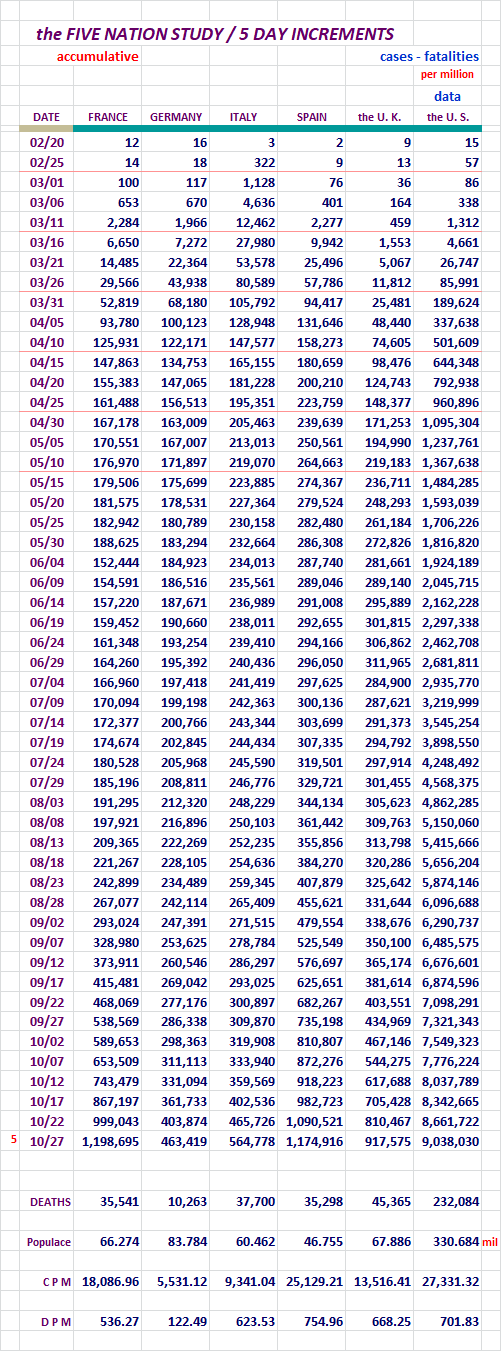
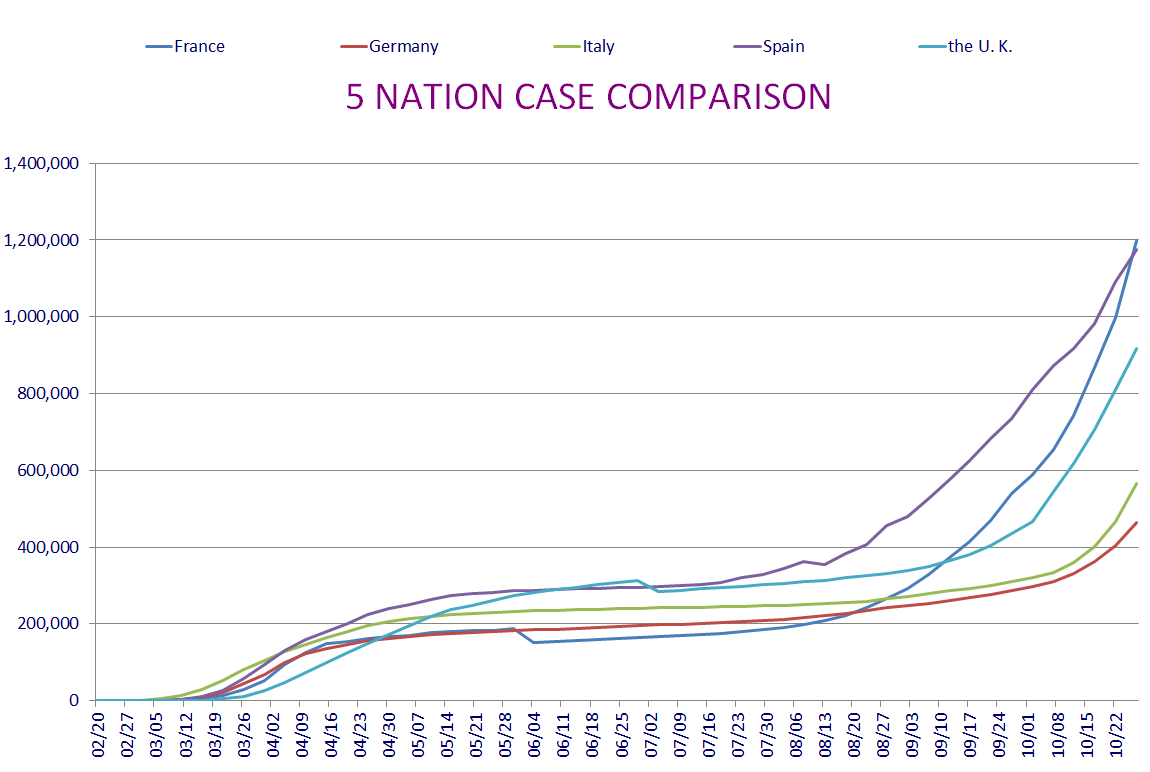
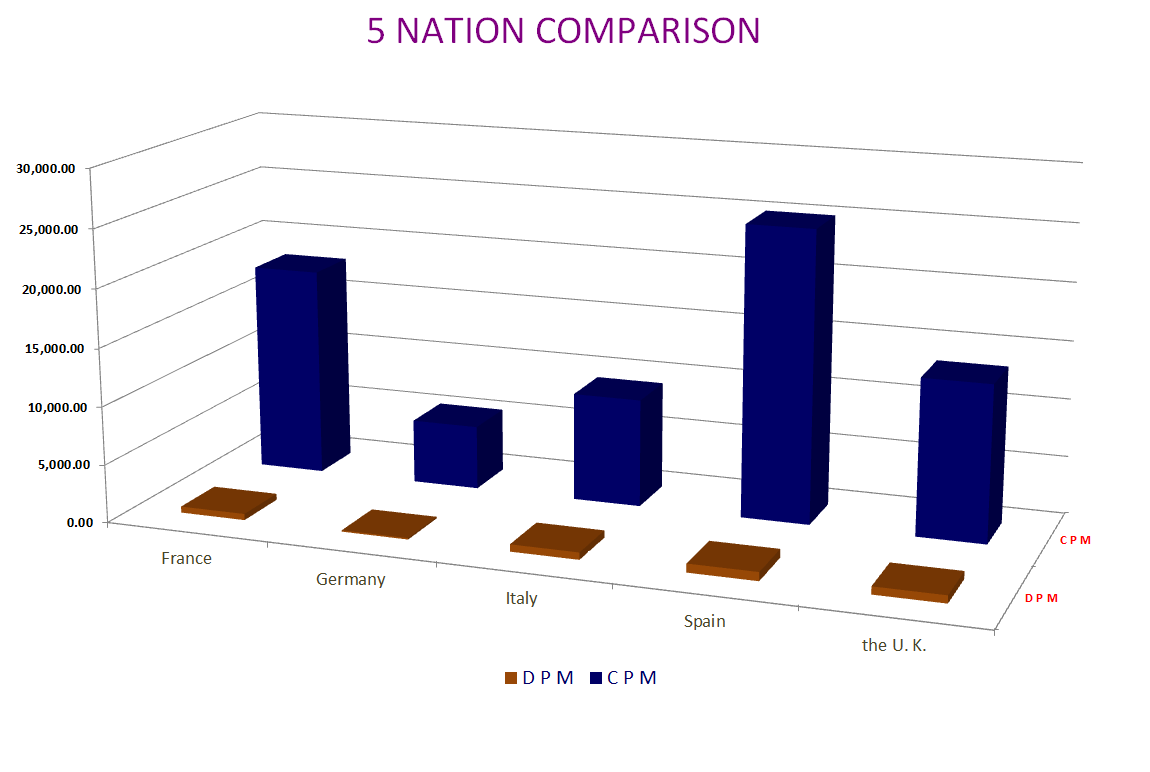
France has finally caught Spain, but Spain is still racking up the raw
number also. As observed weeks ago, each of these nations are seeng
growth, and we can see the chart lines of the raw numbers here.
Sweden and It's Neighbors, Who Has the Best Tactic Against COVID-19?
Sweden is doing its own thing with regard to isolating. I think most people
are aware of it by now.
Here are some numbers to help us look at this issue.
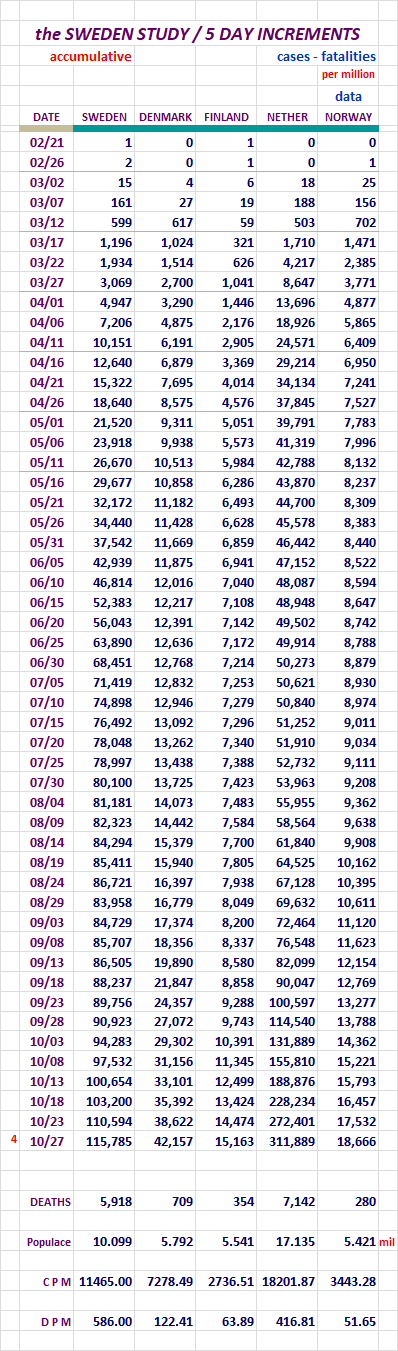
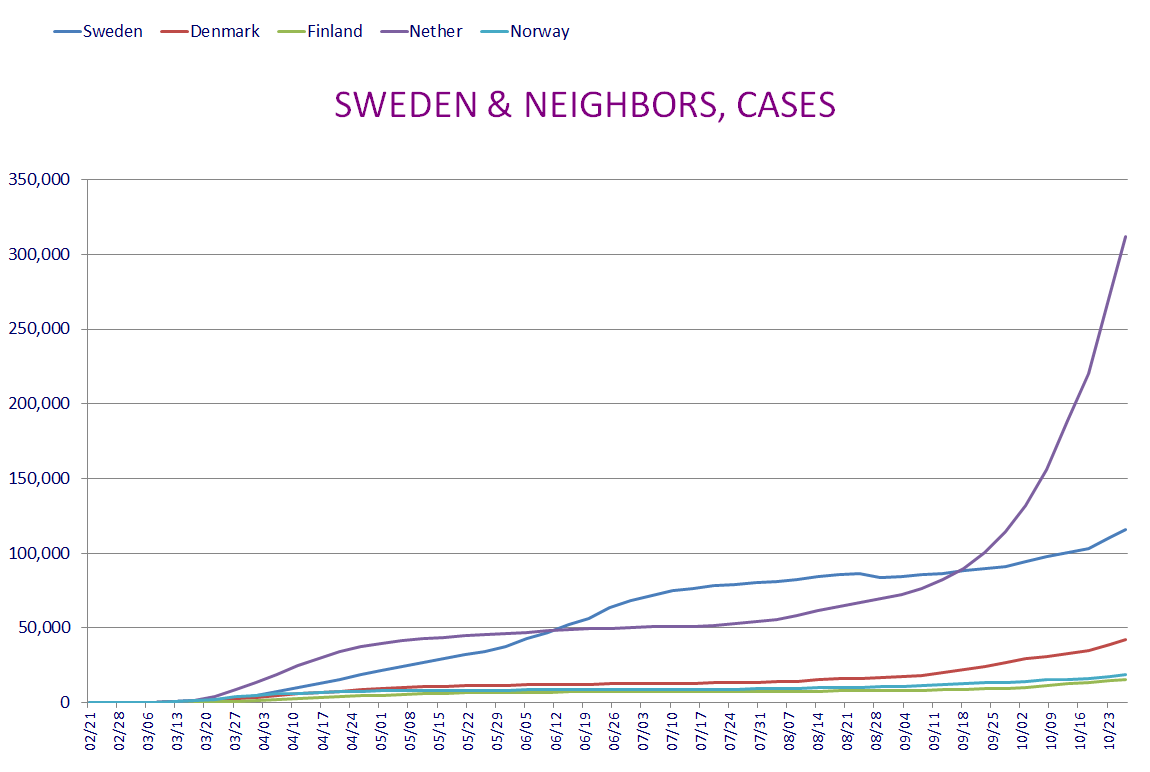
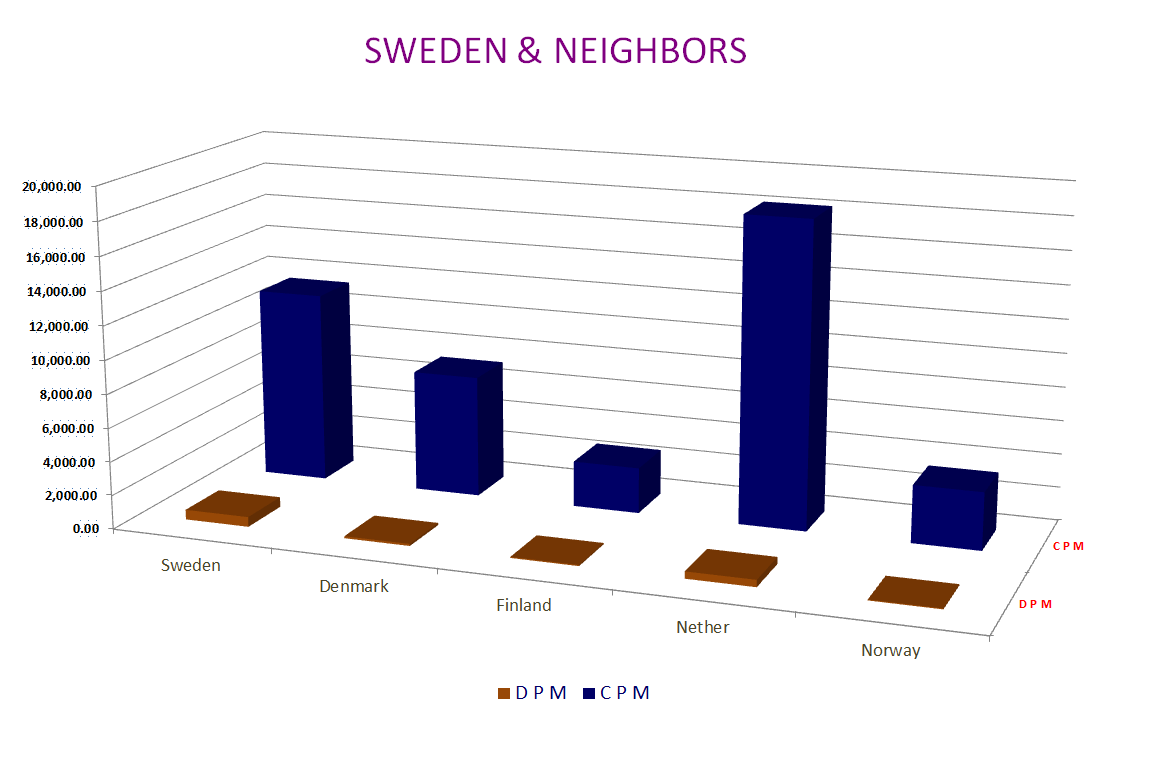
Sweden has flattened out a bit after that correction a while back.
The Netherlands is still going up about as strong as it can go.
The other nations are being dwarfed by it's continue growth.
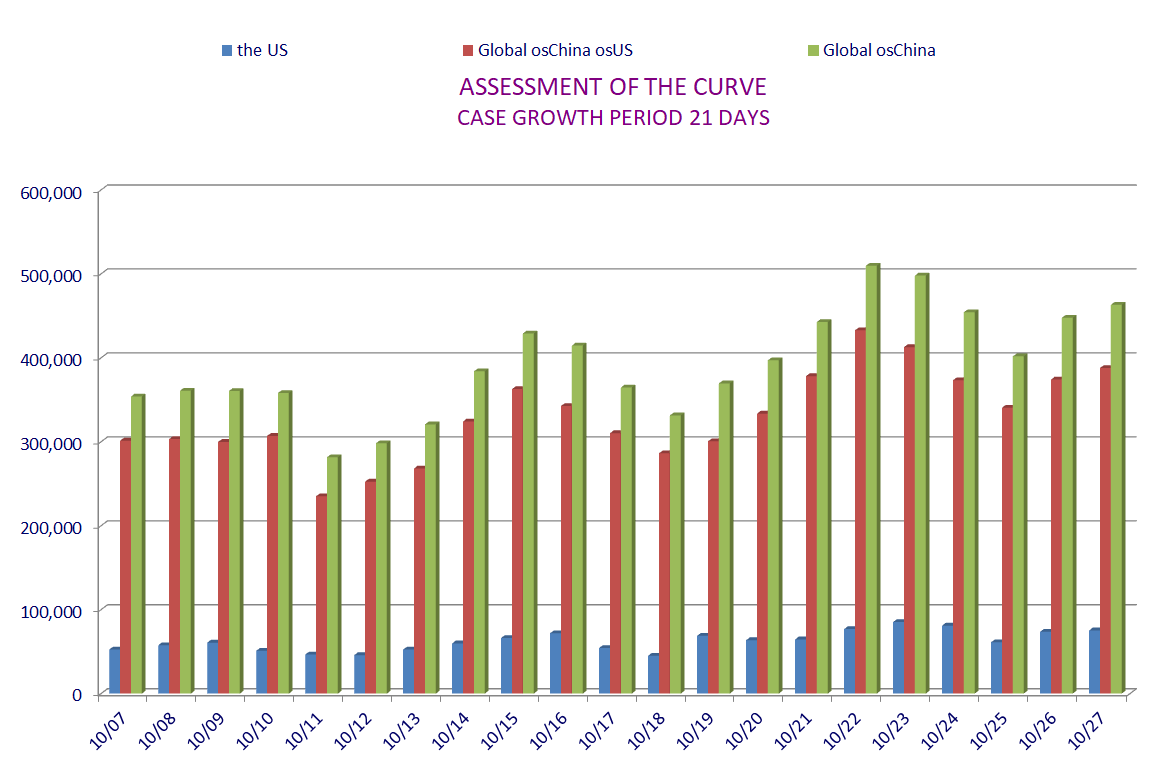
Global Movers and Shakers...
I will present the top fifty nations with the most New Cases and New
Fatilities.
Here we go...
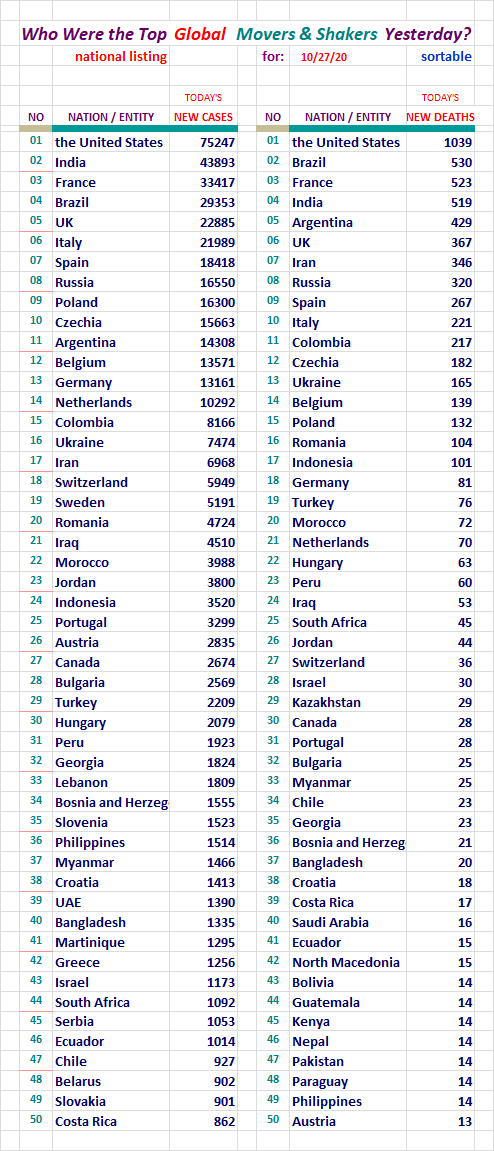
The United States has taken the top spots off an on recently. Yesterday
it did it again. The disconcerting part is the spread there. A few weeks
back India was taking the top spots by large martins. New we've stepped in.
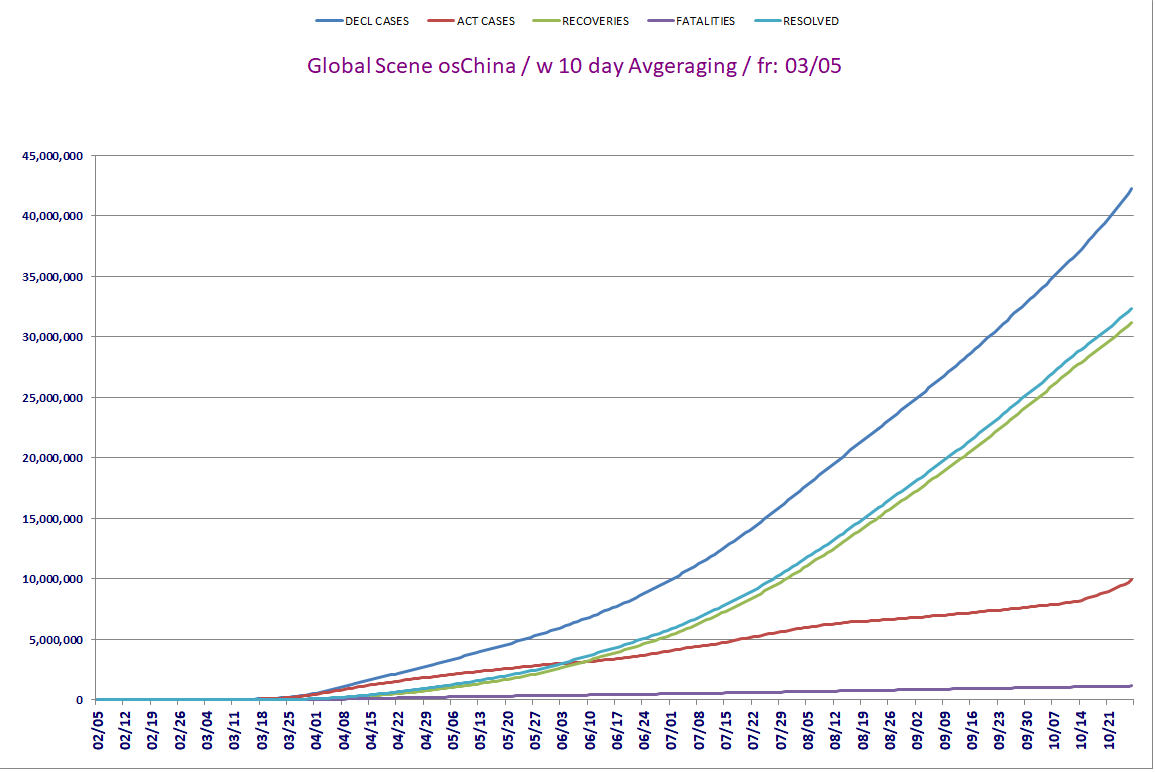
Global osChina Stats / w 10 Day Agveraging / Fr: 03/05
Requested by: Texas Eagle
This data and chart presents things in a little different way. In the
chart it is easy to see the relationship of these numbers.
The Chart will use the data all the way back to 03/05, but the data
displayed here will only go back one month.
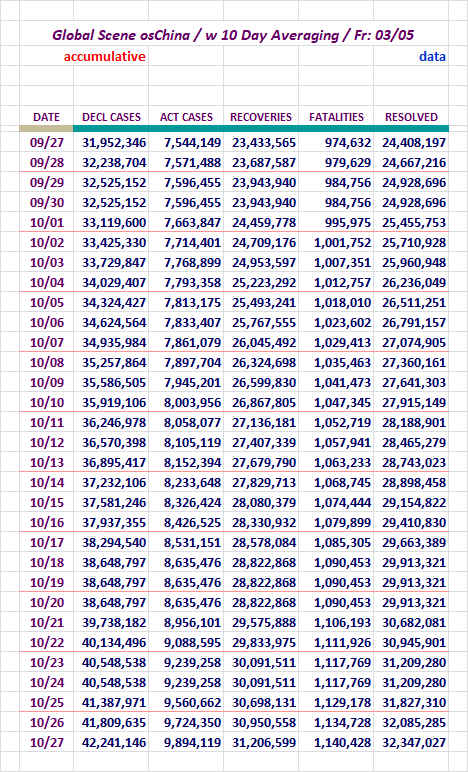
Here is the chart to match.
The Active Case chart line is turning up. Sorry to see it.
In the United States chart like this one, the Recoveries, and Resolved
Case lines have not shown near the strength as is revealed here with these
upward bound lines.
That chart is provided here, in a small version, but you can see it full size
if you right click view.
Section: 04
The Following Addresses the Global Numbers
including Mainland China*
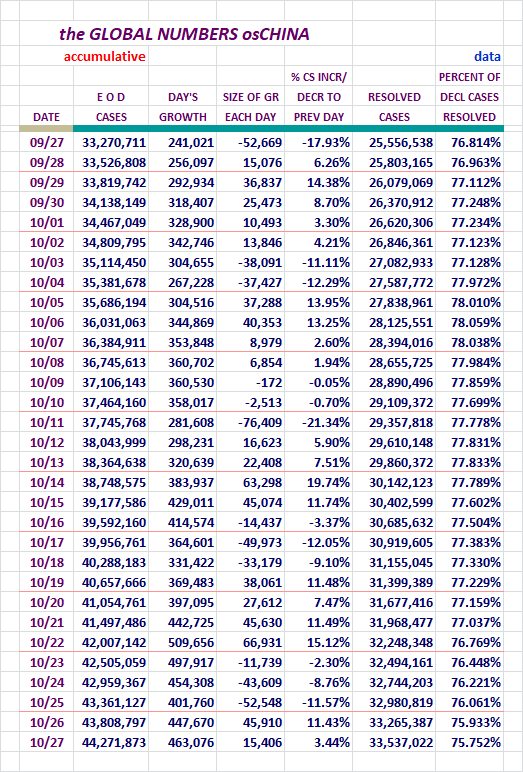
Mainland China's numbers are 0.003% of today's total global numbers.
A Look at Declared, Resolved, and Active Cases, Includes M/L China
End of day figures follow:
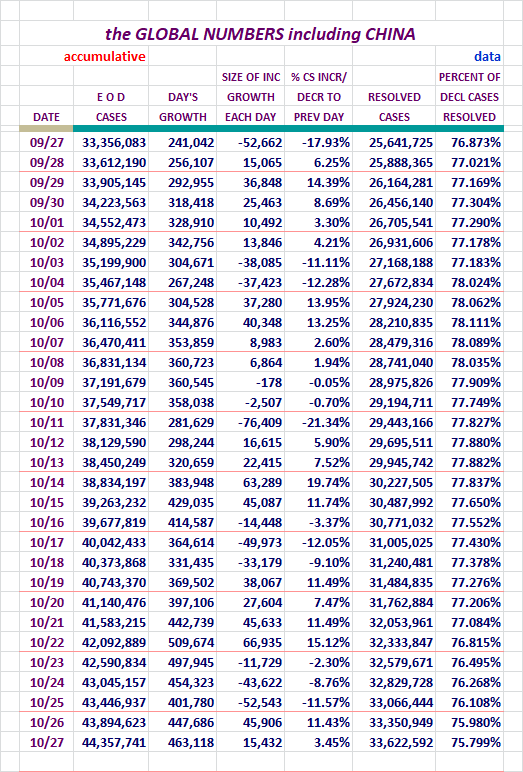
We wound up at 75.779% for Resolved Cases yesterday Globally.
Folks should view up the column to see what the trend here has been
recently.
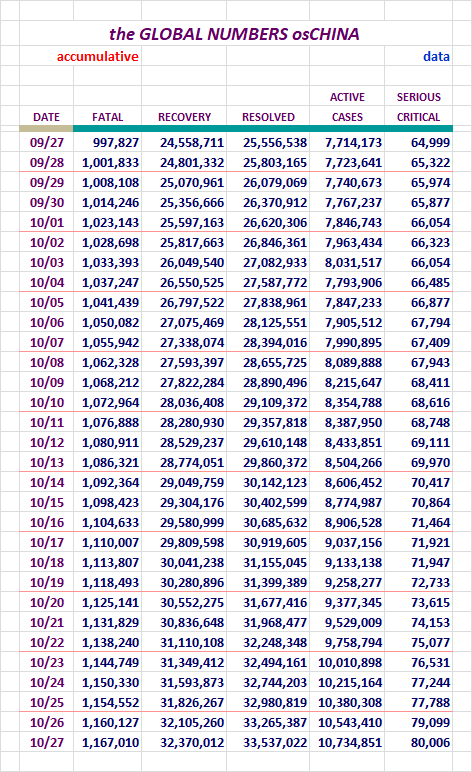
Fatalities, Recoveries, Resolved, Active, and Serious/Critical
Cases Globally, Including M/L China
Concept of adding in Active Cases and
Serious/Critical here, courtesy of amorphous
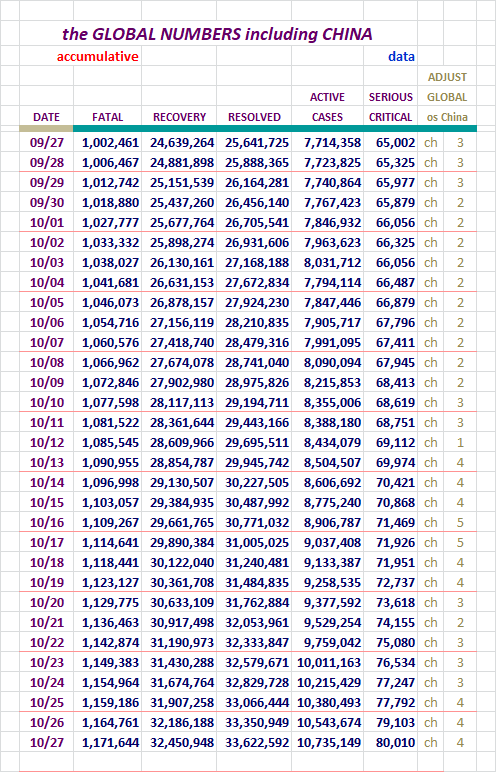
Active Cases rose up 191,475 cases to come in at 10,735,149 yesterday.
Serious/Critical cases rose. The total there is a large number.
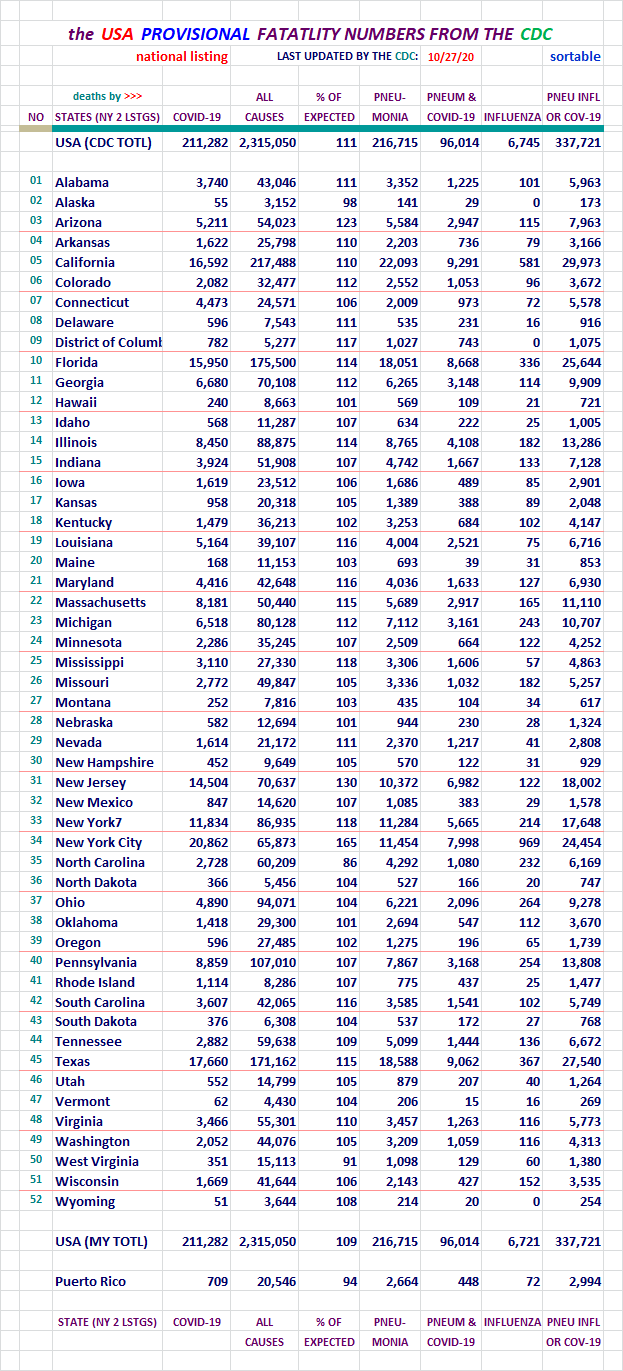
Section: 05
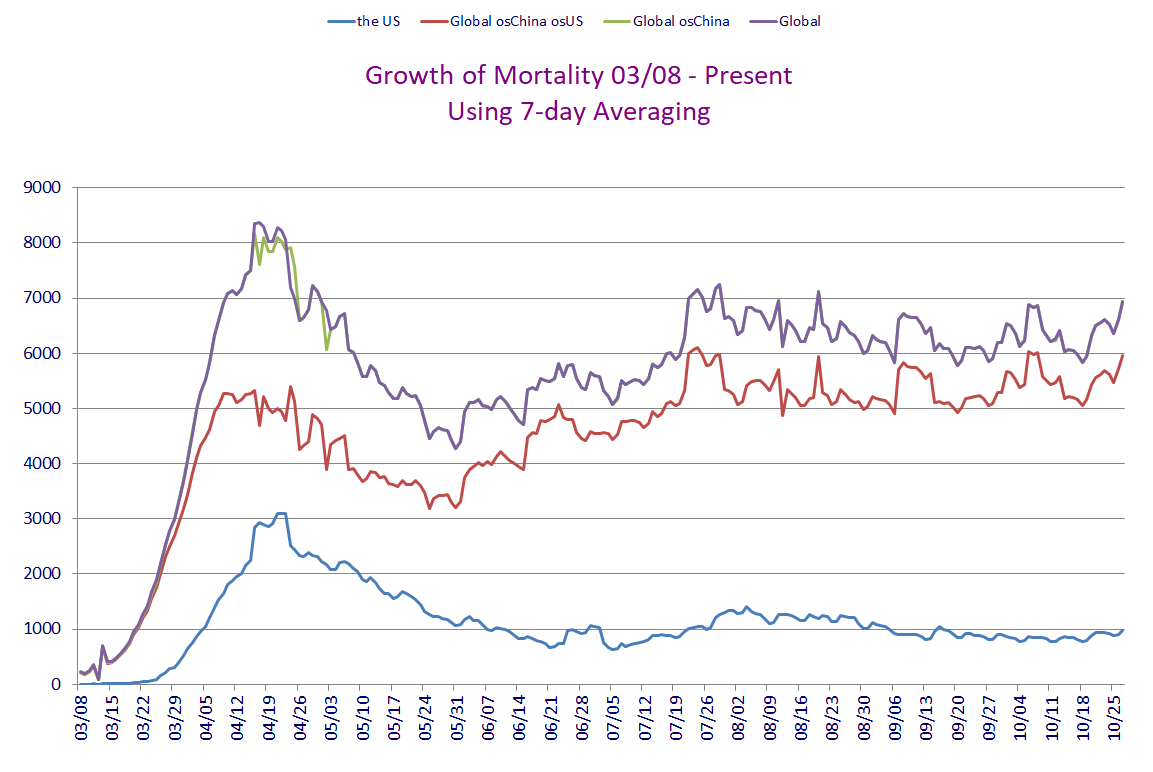
the Mortality Report
Here is the data for four entities...
Here are the figures for the growing case totals for four entities.
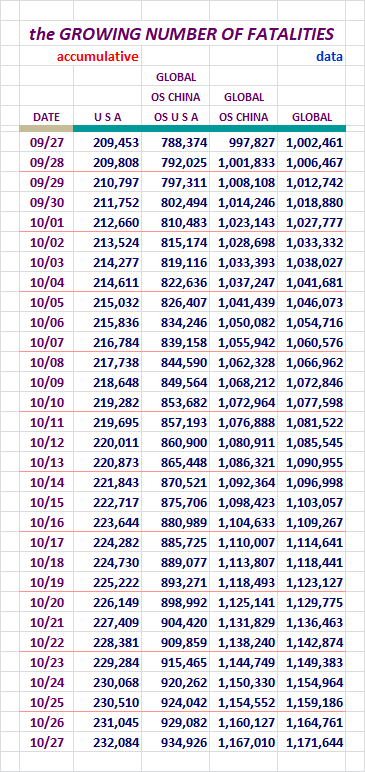
We hear all sorts of stories about how these figures are wildly off. The CDC
has studied them and seems to think they may actually be on the low side of
things. I am providing the CDC Provential Numbers down below. Not sure if
anyone has a rock solid number. I doubt it is possible. This is what is
reported out by WoM and JHU. Check out the CDC numbers too.
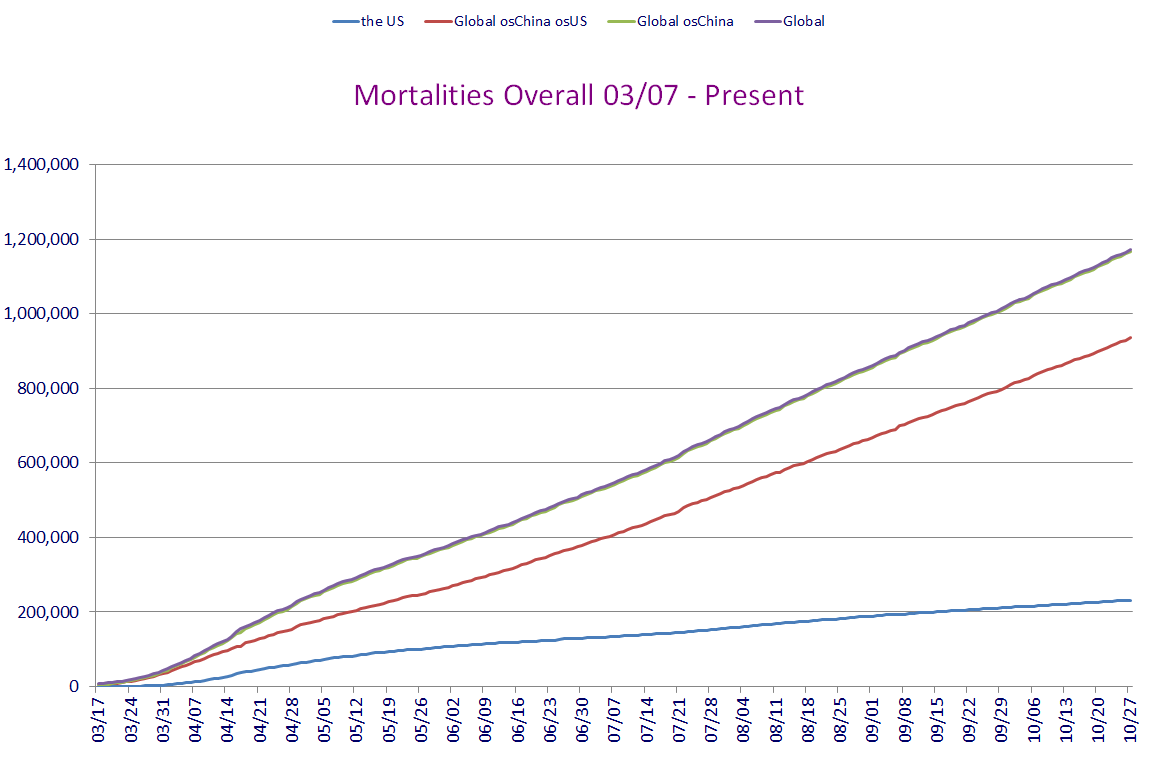
Charts like this one only show growth. That's why I recently took the advice
of a FReeper and added in a new chart for the U. S. and Global outside China
regions.
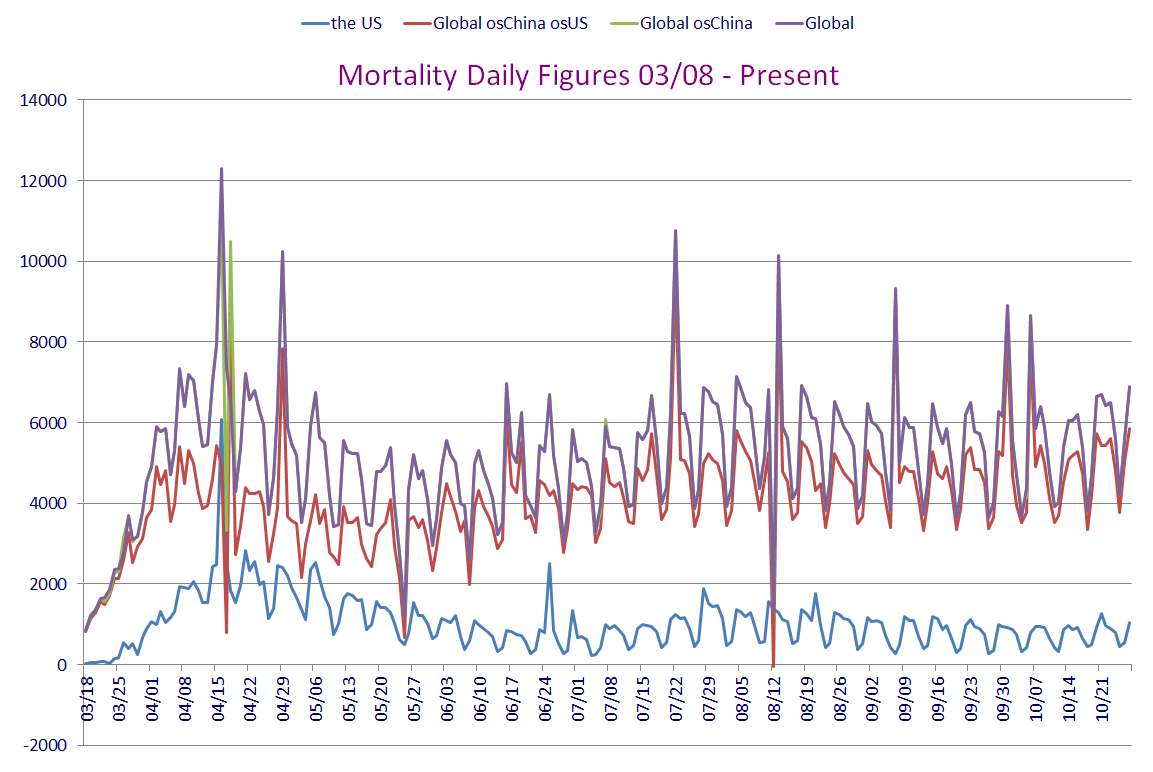
Here are figures revealing the daily growth for those four entities.
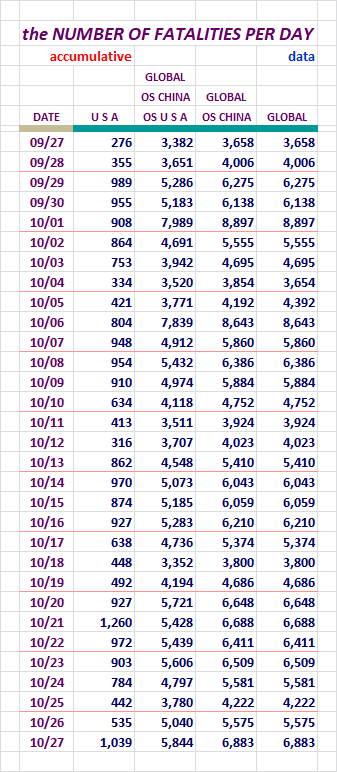
Fatalities in the United States rose up to 1,039 yesterday. I'm hoping
we don't remain elevated like this for the next few days.
The other areas rose also, it being a Tuesday. It's that time of the week.
Since the beginning of COVID-19's activity in the U. S., higher New Cases were
soon followed by elevated Fatalities. If we have gone to school on the data
of this disease, we know who should avoid exposure the most. So if the
demographic that has little to fear from the disease is out there getting
infected, it may not be a bad thing at all. If the Fatalities remain low,
vastly higher cases may simply increase the rapidity of the saturation of the
people in public who have already fought it off. And that may facilitate the
end of the disease. I'm sure others know this, but I did want to explain why
my thinking has fluctuated over time regarding these dynamics.
Here, let's look at data for the United States broken out by itself.
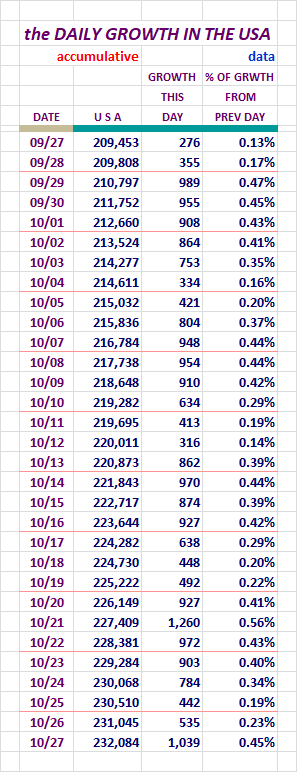
That 1,039 Fatalities yesterday was larger than I would like to have
seen. Let's hope we drop back down tomorrow.
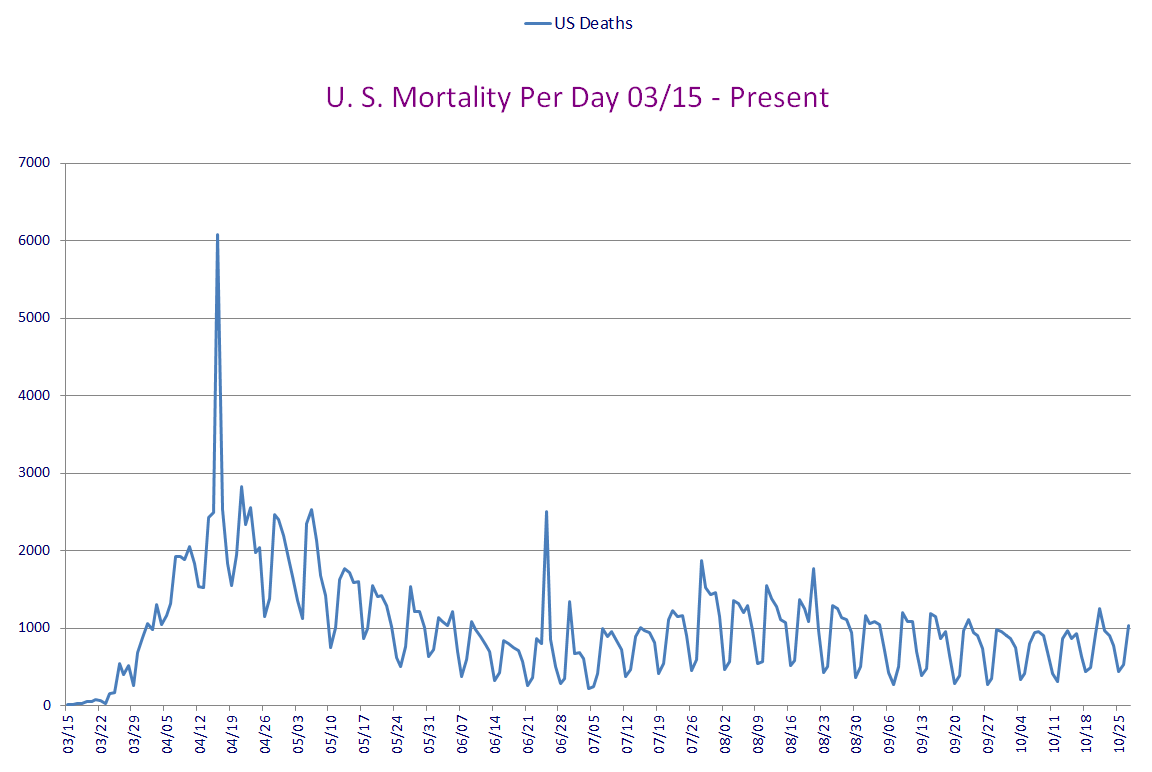
That next to the last week was higher than recent normal. Curious how
this week will play out overall.
Section: 06
Population Saturation
Here are figures revealing how many people in each population base represent one
case. I'm also showing what percent of each population base is infected at this
time.
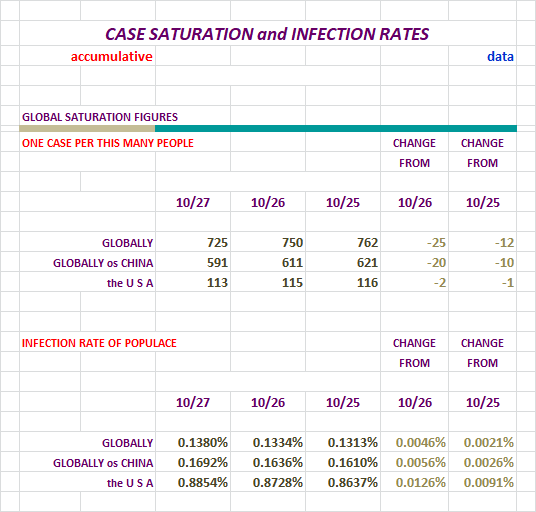
This area hasn't looked too good lately. Not good...
Nations With Lots of Cases
At the end of the day yesterday, there were:
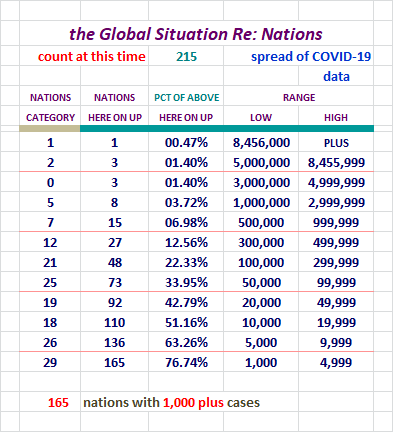
I expanded the levels here. We had nations who were seeing serious
growth, and their levels weren't showing up very well at the top.
Over 50% of the 215 nations we're tracking now, have declared over 10,000 cases,
but they have far less of them still Active. Over 30% of the nations we're
tracking have delared over 50,000 cases along the way. None of them have
anything near their declared amount remaining active. Keep that in mind.
Daily Case Report Evaluation
I'll be keeping tabs on the daily tallies for days of the week for a while. Folks have
noticed some patterns of larger and smaller data entry on certain days, and on Fridays
sometimes the numbers get noticeably larger because of it.
And we now know Thursdays have potential to break out also. Yikes!
IMO Let's check out the numbers and a chart.
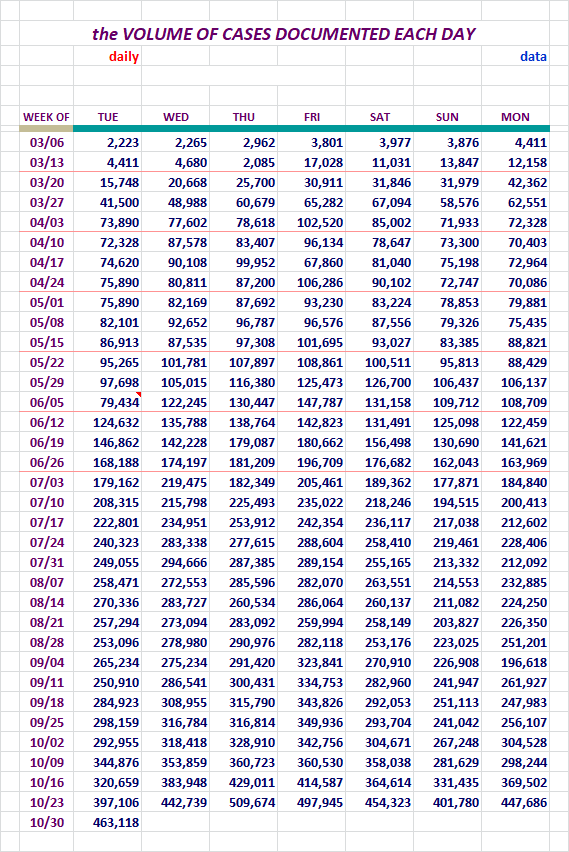
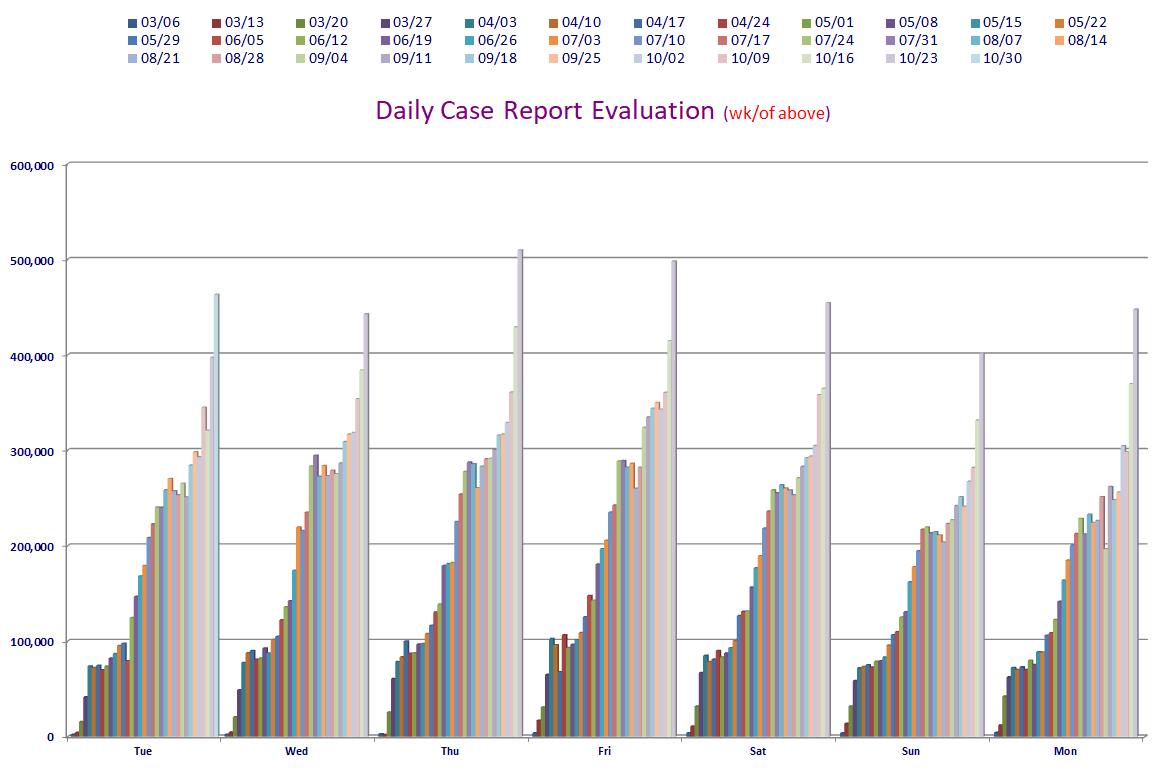
In grouping one there, we can tell that the large margin increases over the
days the week before continues, even though the days last week were also
very elevated above the weeks before that.
Now, is this a colder weather problem, or is it a special Novermber 3rd
upcoming. We're going to find out soon. Will the numbers dip right
after the election?
Section: 07
The Top 200 Counties in the U. S., by Number of Cases
This little report lists 200 Counties in the United States in declining Case numbers.
There is also a listing that is alphabetical. This report list only the entities
and the number of Cases in the two different sorts.
It will also be available as a downloadable Excel file in Section 12.
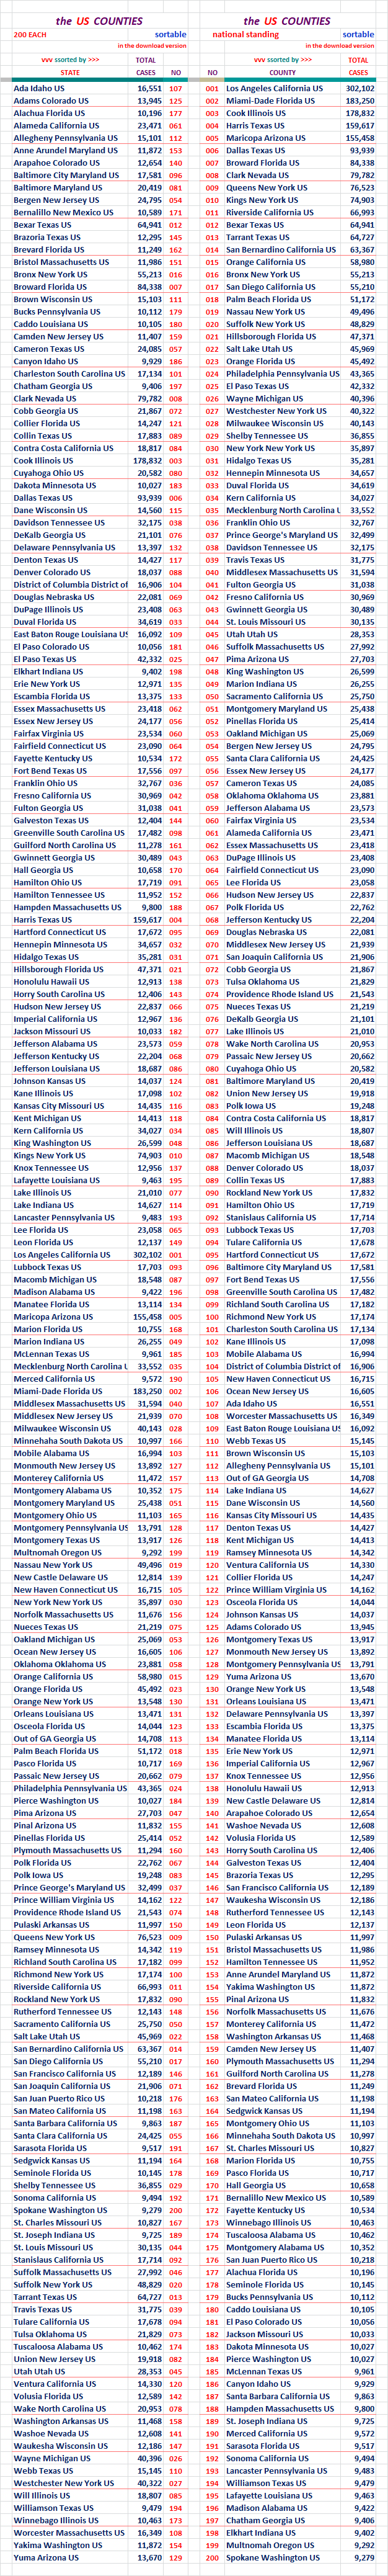
For months Puerto Rico was showing up with the Counties. That stopped in early July
if memory serves me well.
Section: 08
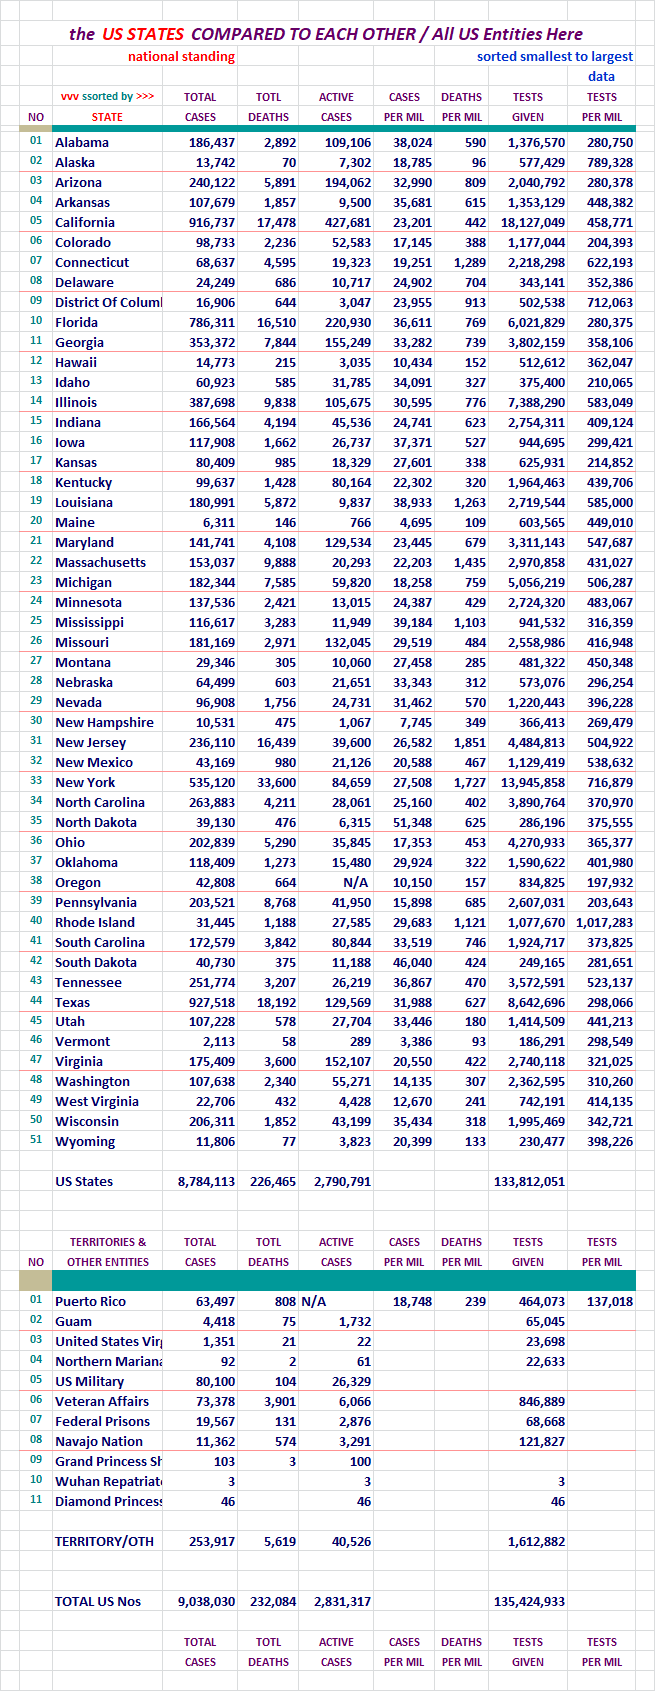
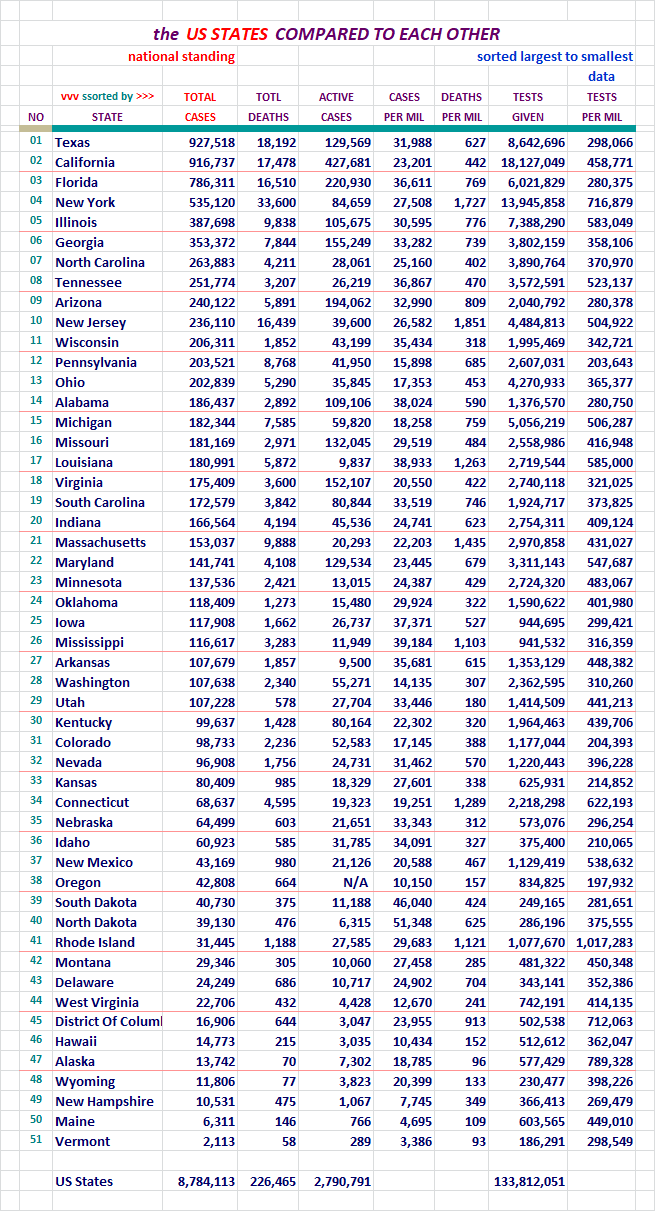
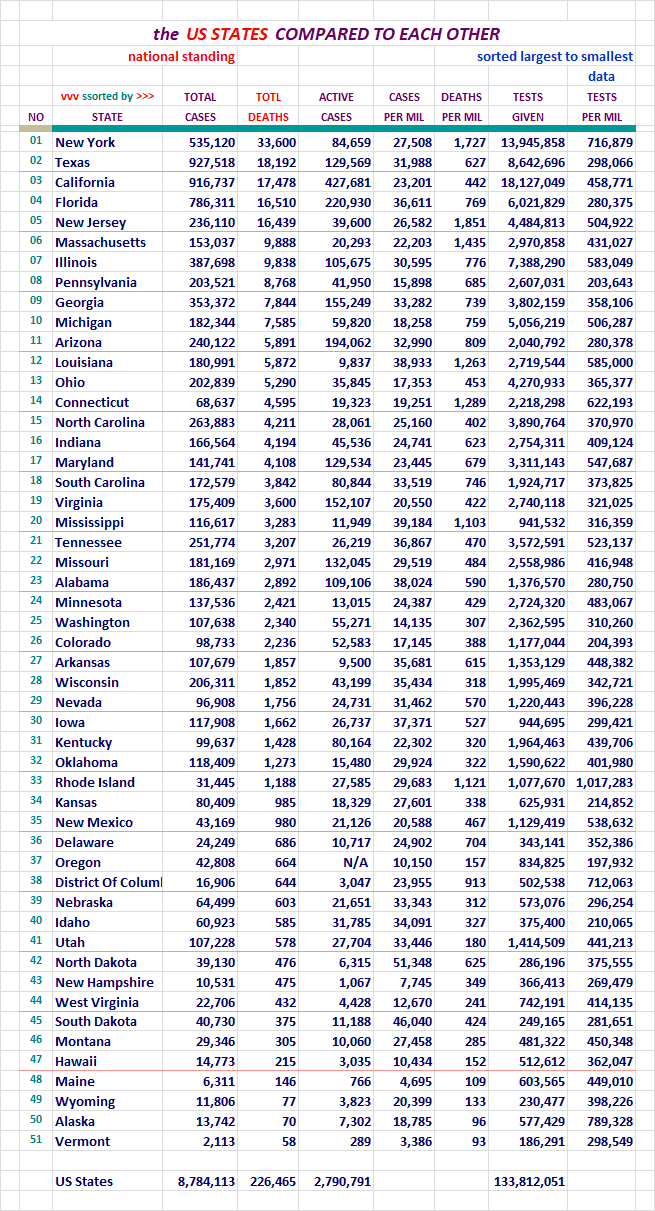
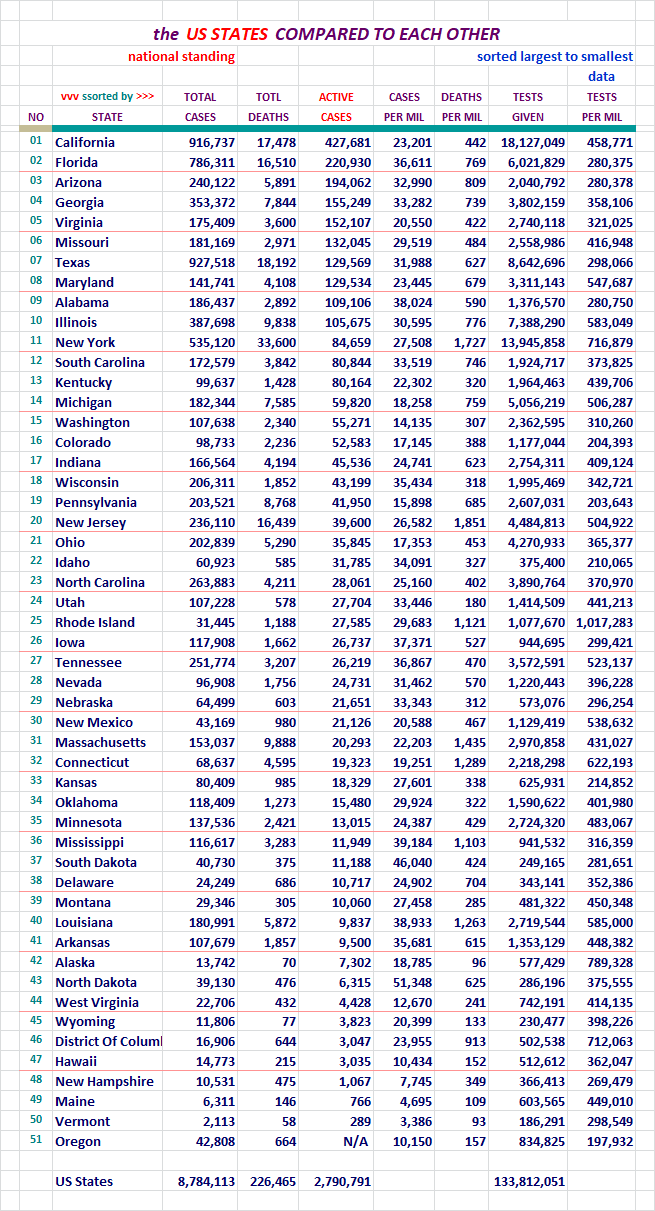
States of the Union and the District of Columbia, Compared to Each Other
Each of these pages is sorted differently. Look at the red header above
the columns to see which column was used for the sort on any given page.
For your review...
For your review...
For your review...
For your review...
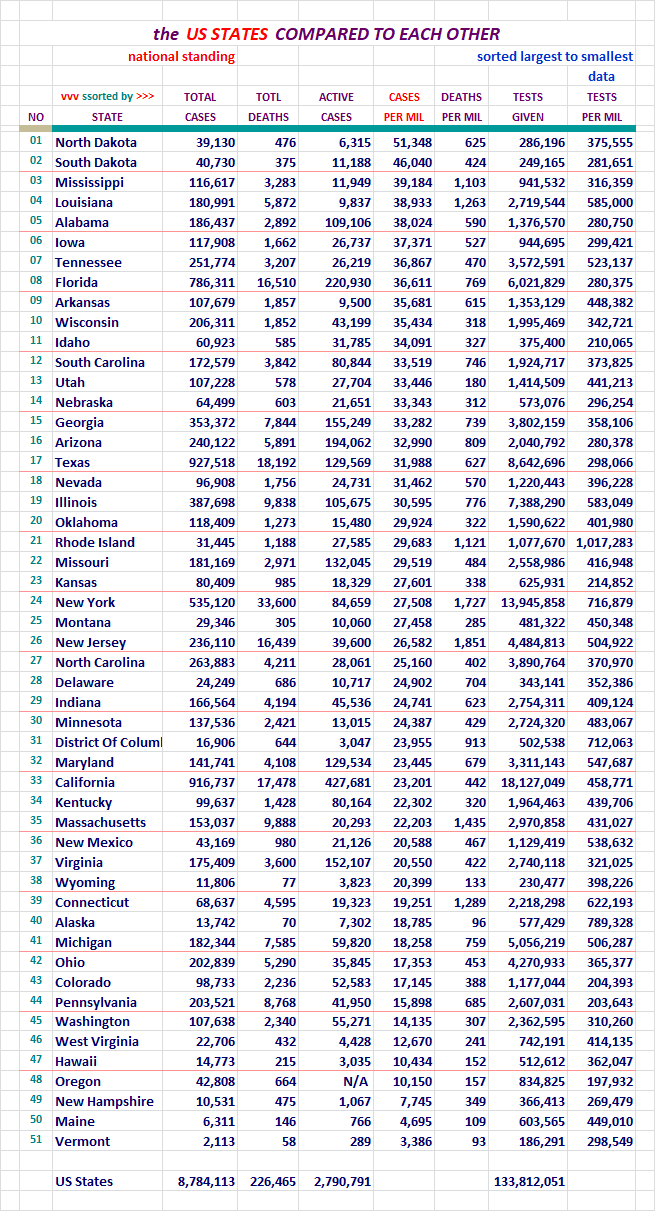
For your review...
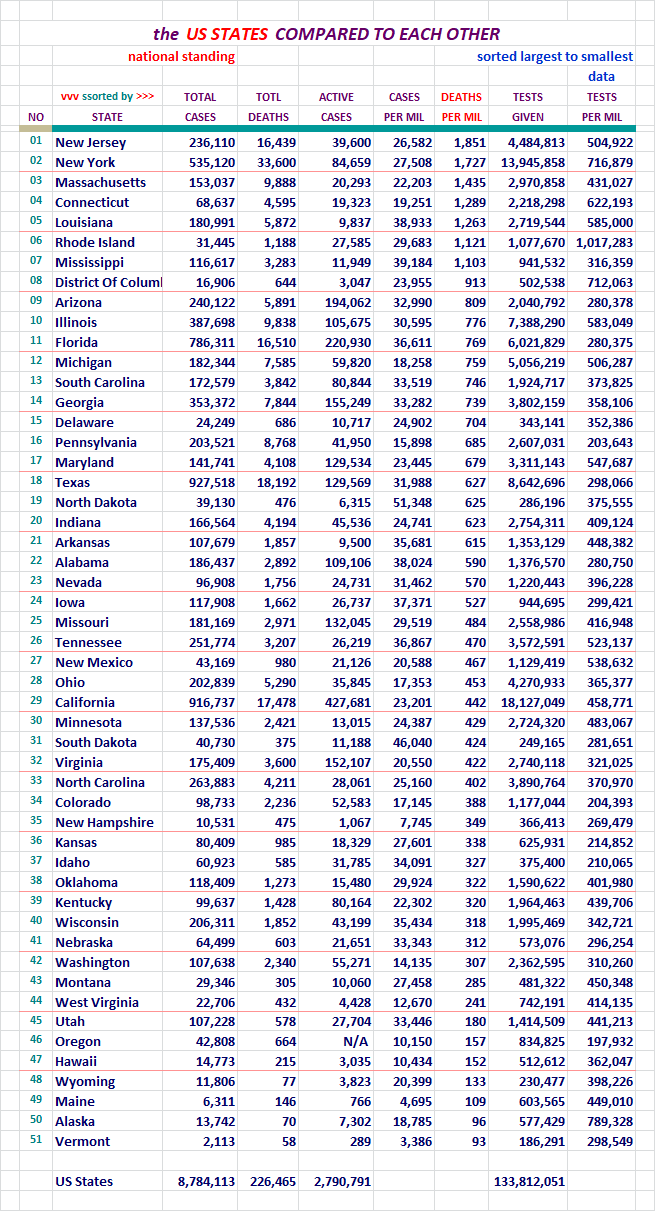
For your review...
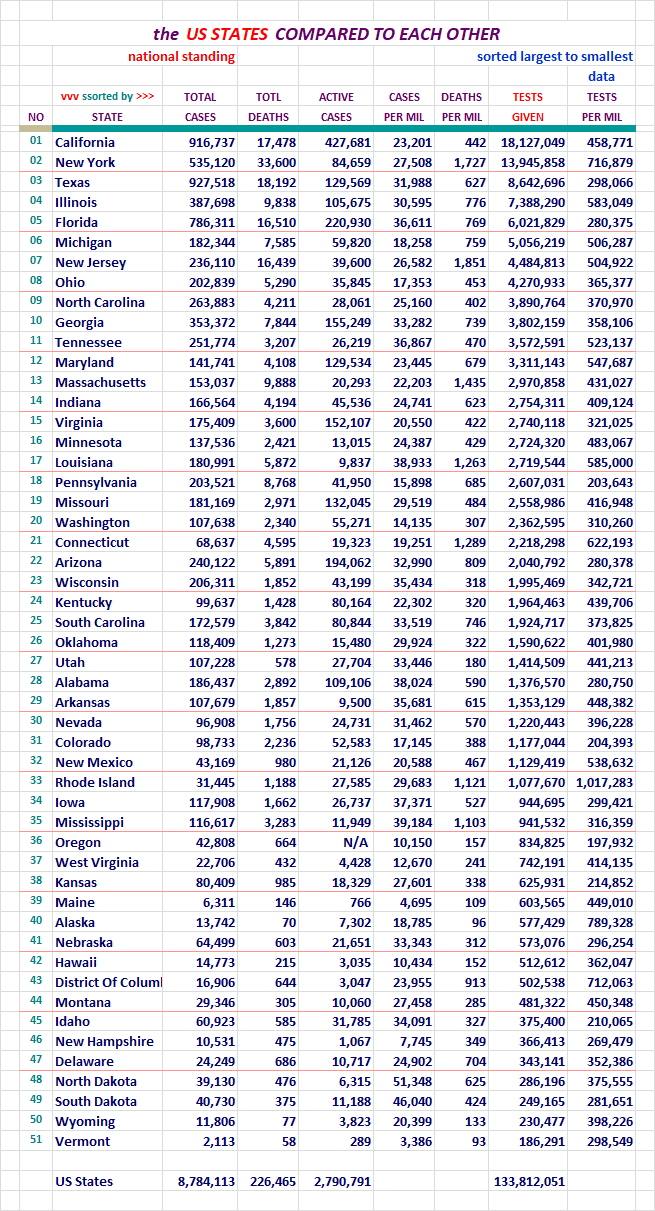
For your review...
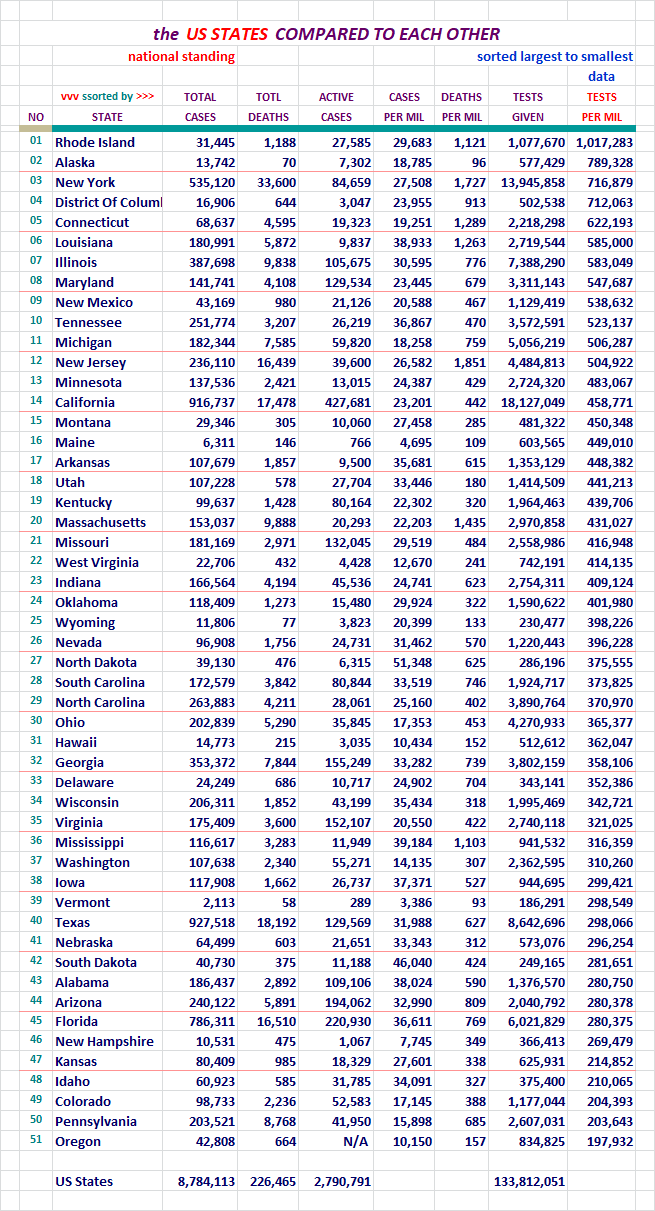
For your review...
For your review...
If this area interests you, please use this LINK to the source, and review
the lengthy description and explanation of it's development process.
There are two reports. The presentation above comes from the second one,
and the detailed segmented information below it, may interest you.
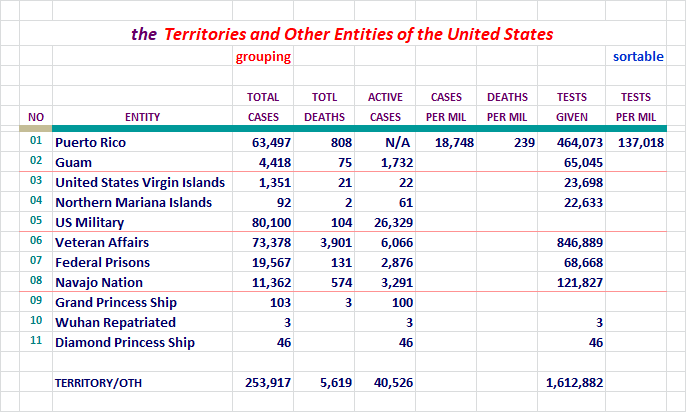
These can now also be found under the states on the Alphabetical list. The
states and these entity's numbers should be combined to match that of the
U. S. figures each day.
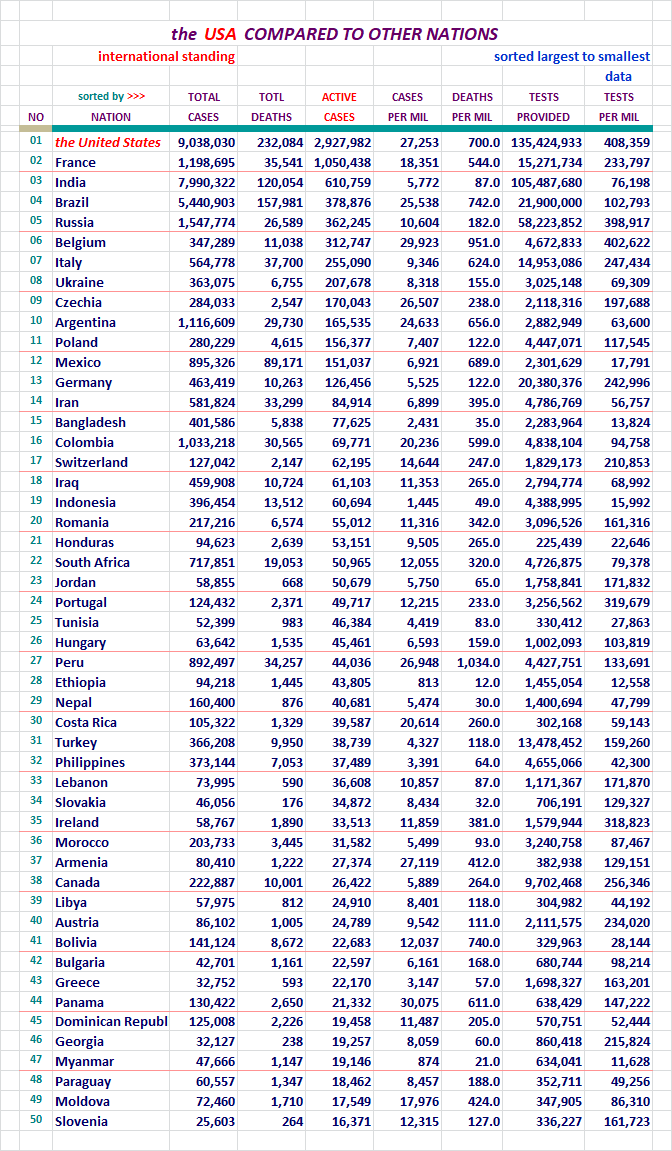
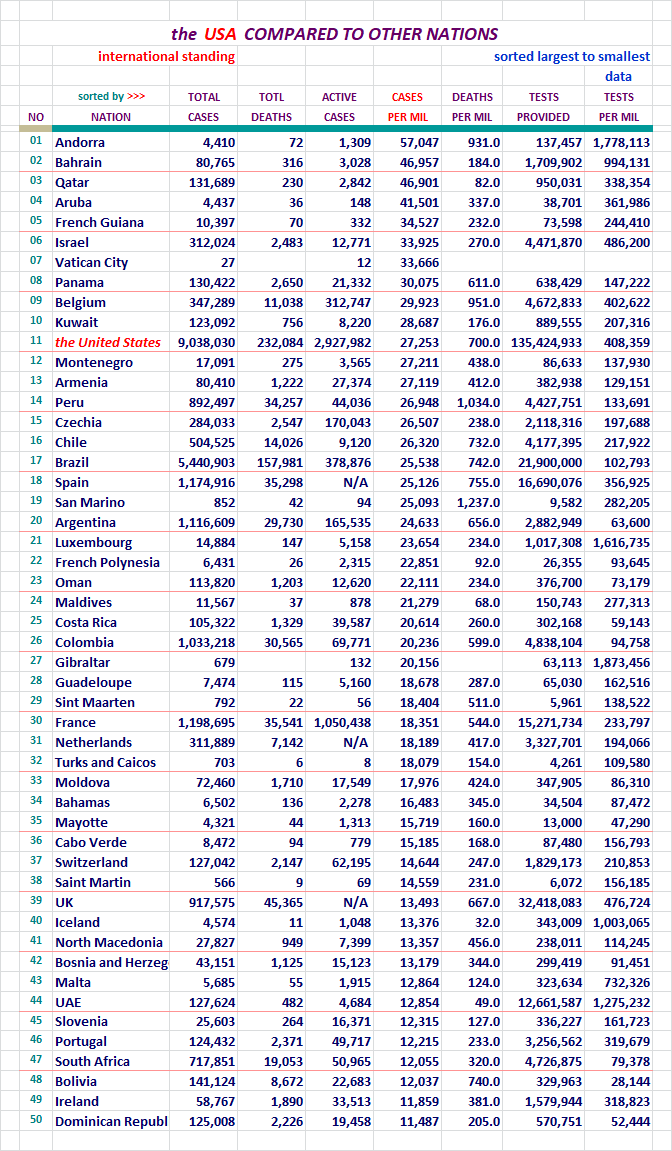
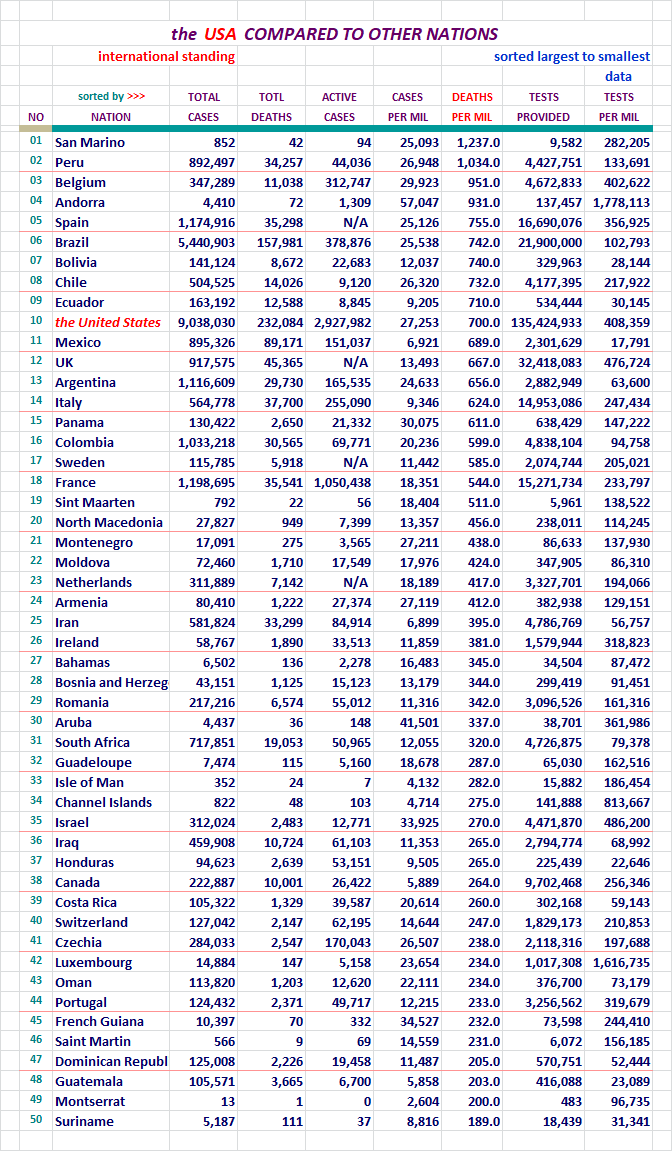
Section: 09
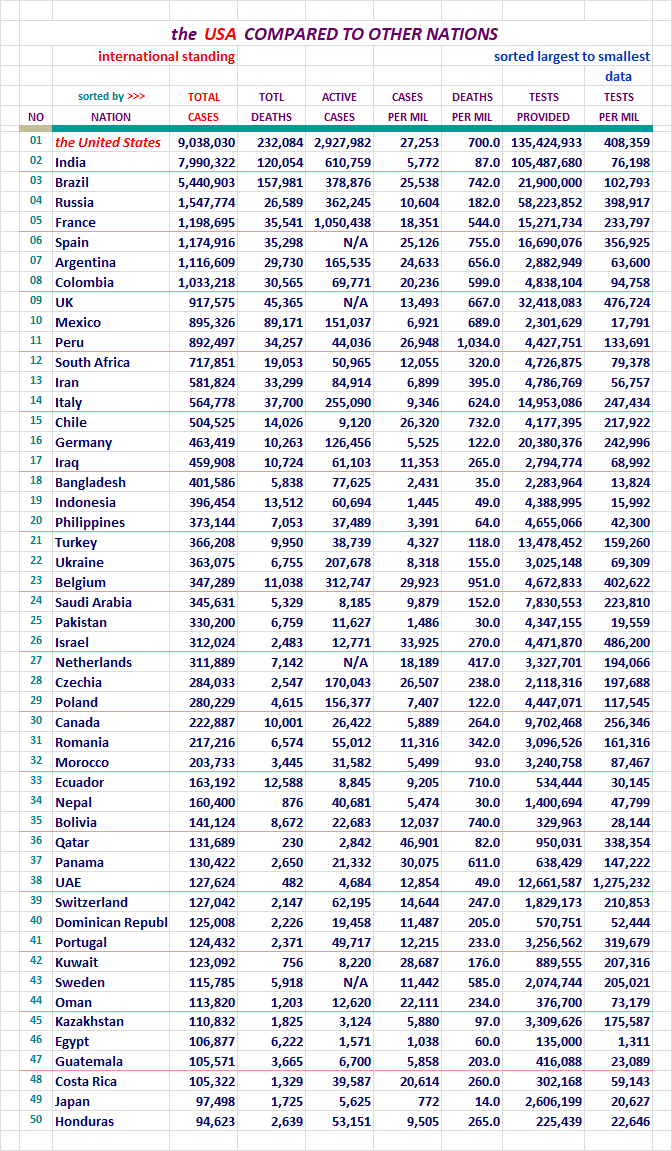
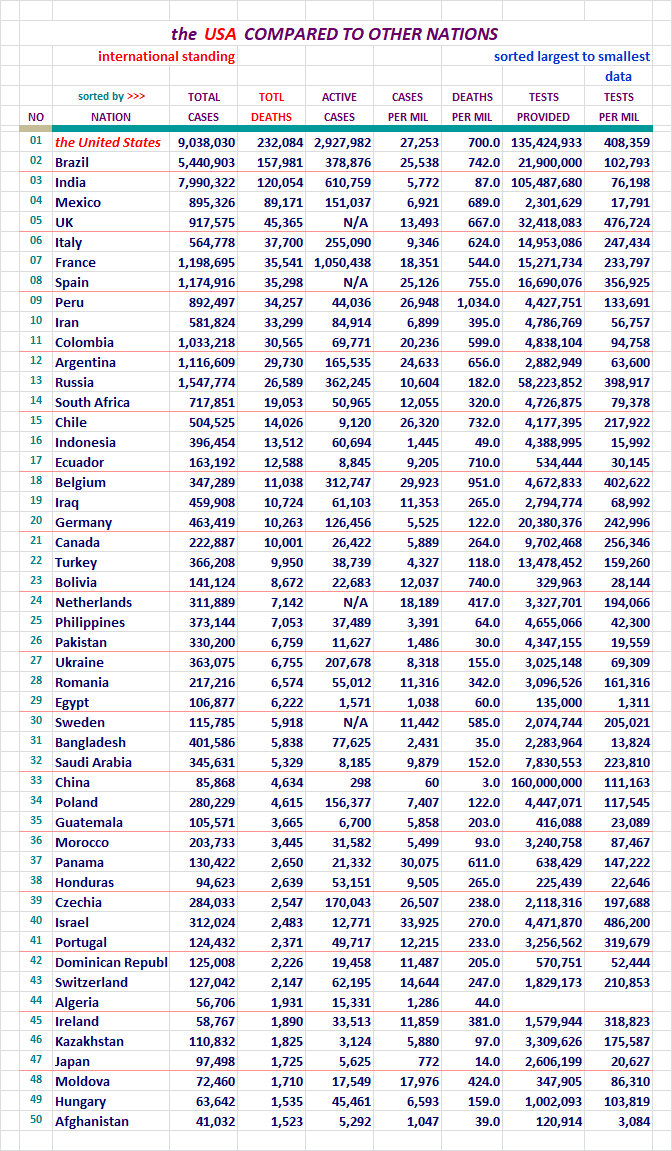
The United States, Where it Ranks With Other Nations?
Each of these pages is sorted differently. Look at the red header above
the columns to see which column was used for the sort on any given page.
The U. S. will be highlighted red here so we can find it easily in the list.
There was 215 nations on this list last night now. I didn't want to post
seven lists with 215 nations on it, so I picked the top 50. Coincidentally,
one report category had the U. S. at 41st, so it wasn't showing up on the
list with the 31 top nations on it. That wasn't the reason why I extended the
list length, but it did work out well.
I work on the nations right next to the states on my spreadsheet. The
states with the District of Columbia come in at a total of 51 lines.
I decided to keep the international reports near that length, and 50
was good enough.
Here we go... for your review.
For your review...
For your review...
For your review...
For your review...
For your review...
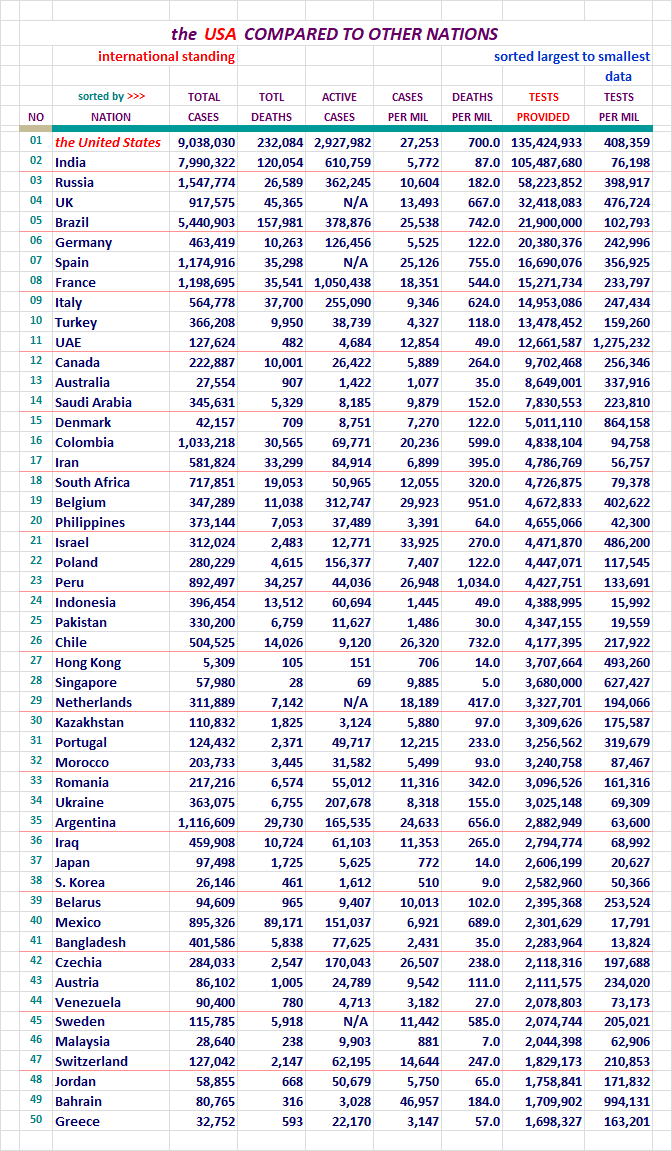
Around 06/23, China started putting out it's testing numbers. I thought
they were suspect. The number they put out was 90,410,000. Ours and most
everyone else's numbers are specific. For instance on 06/28, our number of
of tests at the ned of the day was 32,592,368. That specificity separates it
from the number China put out. It was rounded to the 10 thousandth place. In
addition, China did not update that number until 09/02/20. On that date they
raised the number to 160,000,000. As of October 3rd, 2020, they haven't updeded
it again. So I do not inlude China in the Nation's Comparison Sort regarding
Testing, and any place that reports out global testing numbers for a top level
comparison.
Please note that global testing on the Dashboard was only deducting China's
90,410,000 figure from 09/02 through 10/02/2020. I should have been
deducting the 160,000,000 figure, and all global figures during that period
were 69,590,000 tests too high.
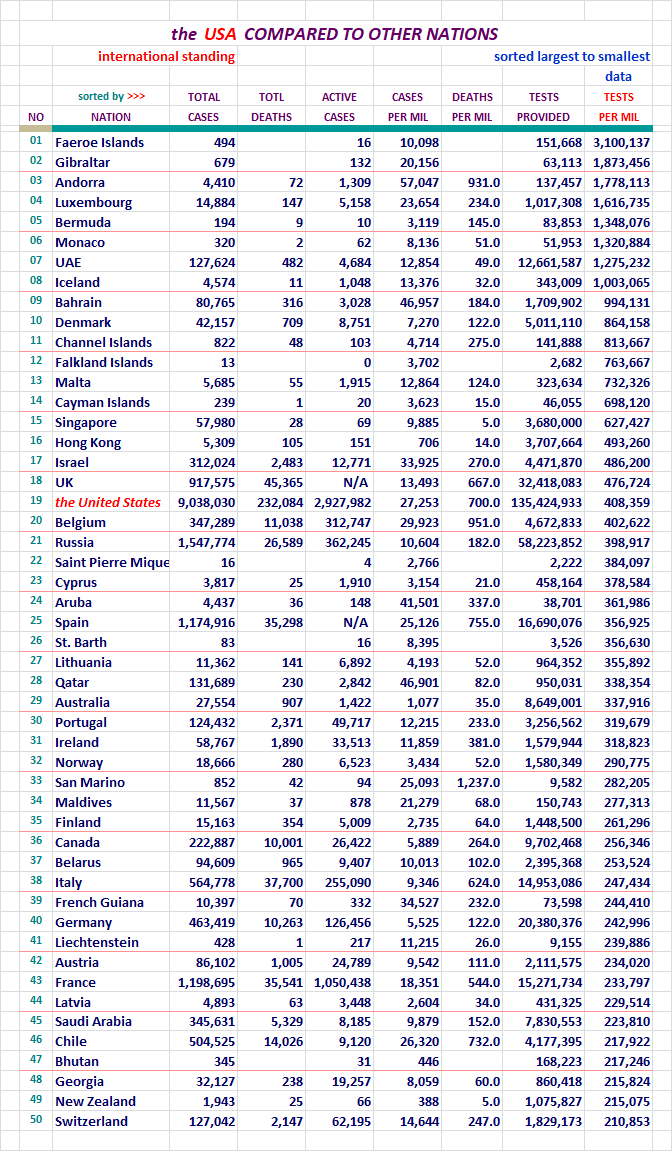
We remained in 19th place yesterday.
Section: 10
Here is what it is all about. From January 20th to the present.
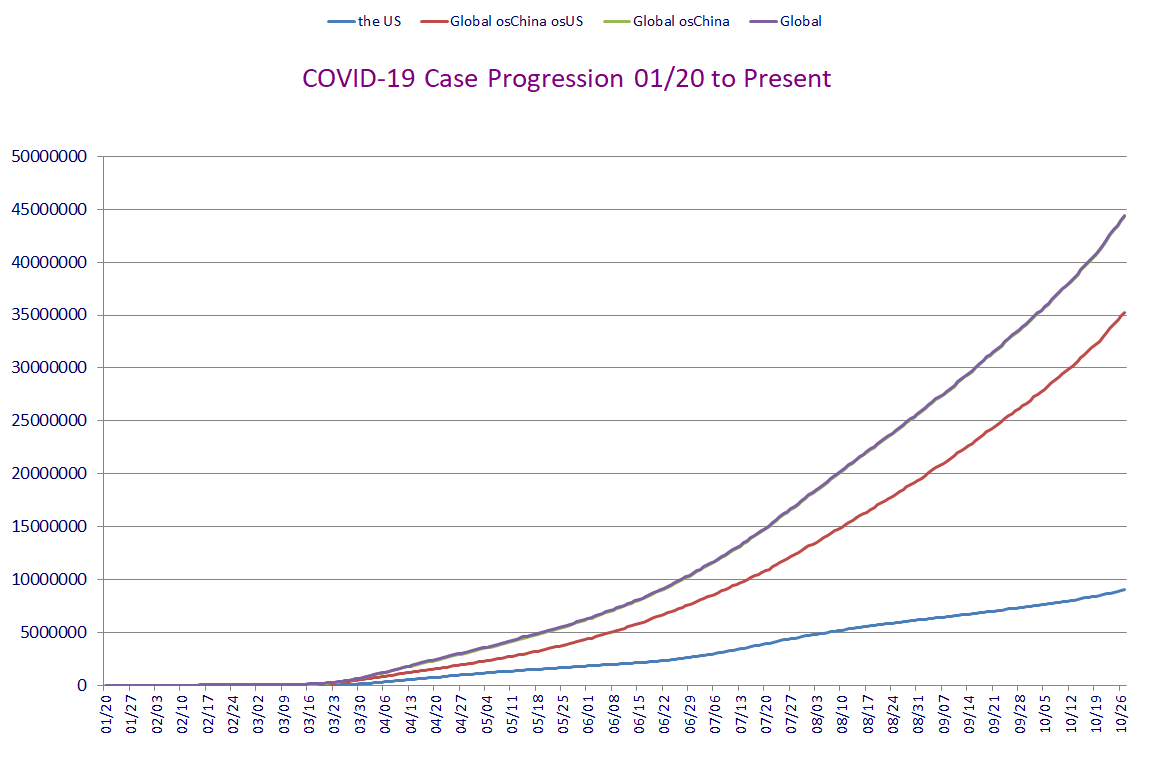
This concludes our look back at yesterday's data. Take care...

Section: 11
Data for this Report Sourced From:
LINK WorldoMeters
LINK Johns Hopkins University
The Center for Systems Science and Engineering (CSSE)
LINK United States Center for Disease Control - Provisional Numbers
Listed in the order of current utilization...
LINK You are Invited to Review My COVID-19 Spreadsheet (XLSX)
There is not an XLS version available for distribution at this time.
Section: 12
Other Features:
LINK US Counties200, States & DC51, Territories & Other Entities11, Nations219,
and the CDC Provisional Counts53
Five Excel Spreadsheet datasets you can sort for your own studies...
Section: 13
Links to other resources:
I cannot vouch for these sites. Please use your own judgement.
LINK Adventist Health Coronavirus Resource Hub - Scroll down for useful info
LINK Antibiotic Vitamin, the (Vitamin D)
Good article on Vitamin D's likely role in prevention of infection. Thanks Blam.
LINK CDC Data for Download - Scroll down - Excel required. Includes death stats.
LINK CDC National Center for Health Services
Provisional deaths as determined by review of vital documents. Much lower...
LINK CDC Secondary Data and Statistics - Portal Entry / Look around
LINK Coronavirus (COVID-19) Map
LINK Coronavirus infection risk may be reduced by Vitamin D
by Former CDC Chief Dr. Tom Frieden
LINK Coronavirus Spread Quickly Around the World in Late 2019, Study Shows
the University College London Genetics Institute
LINK COVID-19 Deaths Broken Out by Thirds, 05/07/20 Map of US Counties
Very revealing display of Concentrated Death Zones - thanks hoosiermama
LINK COVID-19 First U.S. Case, Treatment, features Remdesivir
New England Journal of Medicine article
LINK Cytokine Storm, med Actemra, Physician near death saved
LINK Diamond Princess Review at 634 Case Point of Eventual 712
LINK Hydroxychloroquine Article: International Poll
Daily Mail Reports, Most Effective Treatment According to 6,000 Physicians
LINK Hydroxychloroquine Has about 90 Percent Chance of Helping COVID-19 Patients
the Association of American Physicians and Surgeons, reports 91.6% of patients improved clinically
LINK IHME - Institute for Health Matrix and Evaluation
LINK National Institutes of Health - Cornavirus (COVID-19)
LINK Nasal Irrigation is the Key, COVID-19 Related
LINK New York City - interesting breakdown, borough, age, sex
LINK On the Origin of CCP Virus, A Documentary Movie (turn up the sound)
Epoch Times: I highly recommend this very well documented report.
LINK Rt COVID-19
Calculates and displays the Rt Factor for each state. Thanks FreedomPoster.
LINK World Health Organization

YAY!
The Serious cases/ total = 0.0057243 today, instead of 0.0057245 yesterday!!!
IDK...
Should be some dramatic improvements in the metrics- but there aren’t.
Look like one of my last raises...
Seriously, I don’t understand why improvements in treatment and therapeutics don’t show in the metrics!
Or the improvements in early discovery and younger age of found cases.
It makes no sense.
(But there are the numbers).
Thanks anyway, your efforts are the best on the web. And a tribute to Freepers.
Any comment?
There should be some metric evidence!
Check out some of the charts.
I think we are doing better, but it has been a while and
it's hard to remember those levels enough to compare to
what we're seeing now.
Check the really high numbers around 04/19:
Thank you for the nice comments. Take care.
Just acknowledging your “aggretory” work. Wish the paid media tried half as hard.
But we both think the US is “doing better”.
But that doesn’t show in the metrics!
(Except for my mostly facetious post above)
We KNOW treatment has improved substantially since the Spring.
That should show.
I just don’t know... Yeah, I’m looking for good news- but ‘honest’ good news.

Pennsylvania Nursing Home (LTC) death stats for October 28.
Numbers from PA Department of Health as of midnight October 27-28.
LTC deaths = 5757 (increase of 51*)
Total deaths = 8718 (increase of 22)
Cumulative LTC deaths as percentage of total = 66.0%
*any fifth grader knows that the LTC subset cannot be greater than the main set (total). But this is Pennsylvania where, when calculating occupancy 2000 = 2606.
So how did this happen?
Remember all those days when the LTC deaths were allegedly zero? Or single digit numbers? Seemed too good to be true.
Today was catch-up time; and now the LTC percentage has returned to 66% for the first time since October 22.
I took a look at daily fatality trends for several Southern Hemisphere and Equatorial countries vs. Northern Hemisphere countries. Adjusted for population, several European countries and Russia look like heck. Asian countries (S. Korea, Japan, etc., not including China due to distrust of their reports) are so low that the seemingly almost random variations are probably meaningless. They are likely, and perhaps should be, laughing at us. US fatalities are moderately high, and increasing, but not at this time trending sharply higher as are a good part of Europe and Russia. The Southern Hemisphere and Equatorial countries, esp. India and Brazil are seeing strongly decreasing fatalities. This after them, for a while there, looking like they were headed through the roof.
MUCH of this is clearly seasonal, and does not bode too well for us, given that we are not yet even 1/2 way into fall. The data from Korea, etc., plainly would seem to disprove some contentions popular on FR, at least as usually expressed / rationalized. Granted that their societies function differently than ours, even in “democracies” like S. Korea or Japan. That’s not to say I want to “turn Japanese”, to quote “The Vapors”, but it IS to say many FReepers misunderstand or misstate, perhaps deliberately, the problem(s) from a health care perspective.
OTOH, the European data raises serious questions. Did many Euro countries relax in practice, if not by edict, more than we? (Seems unlikely.) Did “Fall” simply arrive sooner? Sweden and Norway are smaller and have had somewhat different approaches*, yet, after their “first waves”, fatalities have remained low. Keeping in mind that they, doubly so for Norway, almost certainly have had nowhere near enough infections to attain “herd immunity”, why have they succeeded, and will they through Fall and Winter?
*FWIW, a good family friend in Norway tells me (close paraphrasal) “Everyone is responsible and follows the rules” (masks, social distancing), yet outside of that, reasonably normal activity has resumed.
Case numbers for both Sweden and Norway are ramping up, but, it may be too “early” to guess at their future fatalities: Will their fatalities follow the present US pattern, or that of France?
More generally: Is there any data yet on how long immunity will last?
Many questions. And perhaps the biggest of all: Will we accept the answers if we do not like them?
Europe 208673 cases and 2531 fatalities. Definitely not the place to be.
But the Democrats think we should be more like Europe.
Bet Sweden won’t be nearly as bad off.
That raises many questions. Does such areas have higher immunity baked into the cake via other methods, ie regional sars, diet, environment.
Well, Europe never pumped in the Trillions of money like we did. I’ll give them that.
Perhaps, but, recall that so far as we know, the initial outbreak in Wuhan / Hubei was fairly severe.
You are certainly correct about the "many questions" raised, however.
I can’t wait until this evening to share the latest and by far the greatest book-cook from the self-castrated oracle:
LTC deaths actually reported to have DECLINED by one from yesterday!
Yes, one less than on Wednesday, with total deaths increasing by 44.
Only in Tranniesylvania....
Yesterday WOM lists 1,030 fatalities for the US and a total number of 233,130 who've died. That's a DFI of 0.44. In the last projection, I made I used a 4 September beginning DFI ( 7 day avg) of 0.478, and an estimated 29 September ending DFI of 0.317.
And while a DFI of 0.44 is only for yesterday, the daily number sounds a bit above average (I haven't kept up with it lately), and my comment would be that we're about where we've been for some time now - at a plateau of just below 0.5%.
We see a rise in daily cases and numbers because the law of exponential growth is exerting itself again. It will continue to do so until we find a way to get the DFI way down.
It's still a severe, even deadly contagion for those older citizens. And the same goes for the younger population with other risk factors.
Disclaimer: Opinions posted on Free Republic are those of the individual posters and do not necessarily represent the opinion of Free Republic or its management. All materials posted herein are protected by copyright law and the exemption for fair use of copyrighted works.