Free Republic
Browse · Search
News/Activism
Topics · Post Article

To: ArrogantBustard
1) Satellite based measurement of stratospheric ozone began in 1978. The downslope in your chart begins in 1978. Large area measurement of stratospheric ozone was impossible prior to 1978.
2) Your chart ends in 1995. Satellite based observation of stratospheric ozone continues to this day. Where are the rest of the data?

Regarding 1, the Halley Bay measurements constitute the discovery data set for the ozone hole. They had to re-calibrate the satellite measuring ozone from space because they thought it was returning erroneous data. Once they did that, the satellite was capable of showing the area of ozone depletion; the ground-based instruments still provided the baseline.

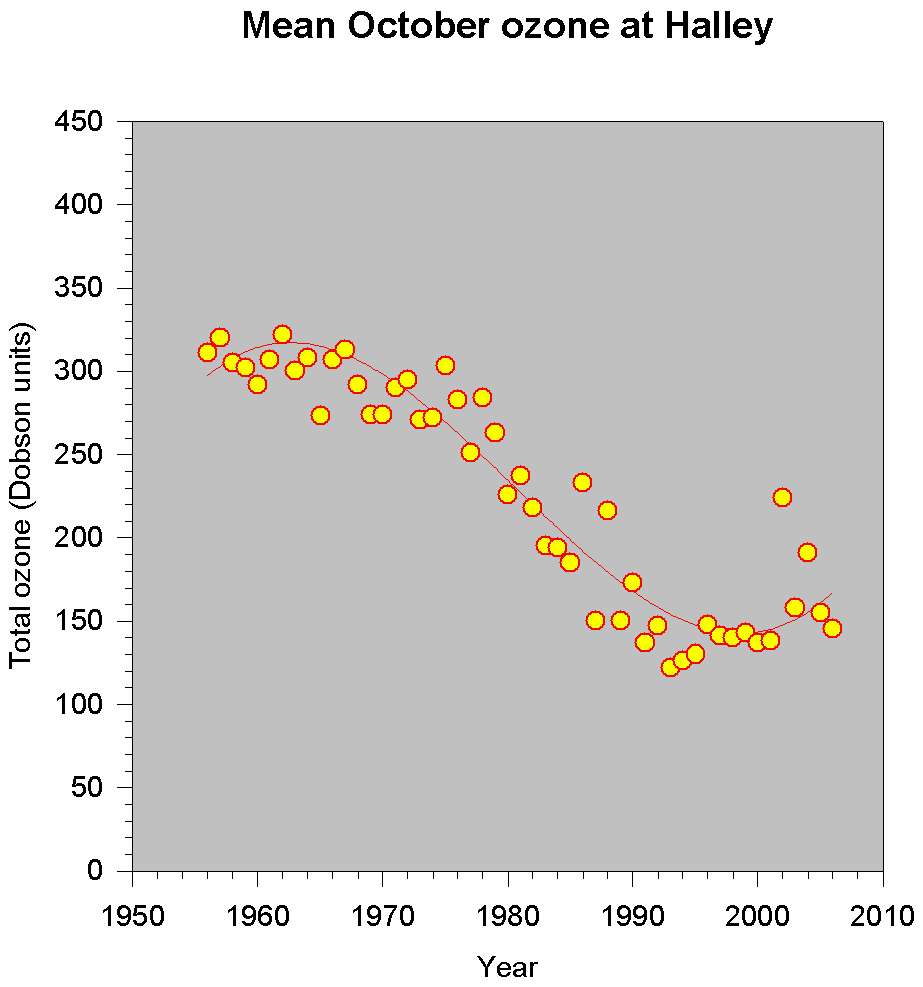
Regarding 2, it's an older Web site. After several minutes of arduous searching, here's more recent data (reduced for posting; click for BIG graph):


46 posted on 09/17/2003 12:35:04 PM PDT by cogitator
[ Post Reply | Private Reply | To 40 | View Replies ]


To: cogitator
Even more interesting graph. And a very interesting fit to the data. Sinusiodal. I wonder what the next 25 years will show... and the 25 years after that. Maybe there's more going on here than the anti-CFC crowd thinks.
49 posted on 09/17/2003 12:55:04 PM PDT by ArrogantBustard
[ Post Reply | Private Reply | To 46 | View Replies ]

Free Republic
Browse · Search
News/Activism
Topics · Post Article


FreeRepublic, LLC, PO BOX 9771, FRESNO, CA 93794
FreeRepublic.com is powered by software copyright 2000-2008 John Robinson