
Image: SOHO
SOLAR FLAREUP. Changes in the Sun's activity have been recorded since the invention of the telescope.
Posted on 04/17/2009 1:50:53 AM PDT by neverdem
Can this be a reason for global warming?
Anne M. Waple is a paleoclimatology researcher at the Climatology Laboratory of the Department of Geoscience at the University of Massachusetts in Amherst. She offers this answer.
|
|
Image: SOHO
SOLAR FLAREUP. Changes in the Sun's activity have been recorded since the invention of the telescope.
|
Since the telescope was invented in 1610, people have been regularly recording differences in the appearance of the sun. Although some observations were made earlier, it was really the telescope that allowed consistent sightings of dark blotches on the sun's surface. It was not until 1843, however, that Heinrich Schwabe, an amateur astronomer, declared that these sunspots appeared to come and go in a regular 11-year cycle.
Following Schwabe's announcement, there were many attempts at making correlations with the sunspot cycles. Everything from the economy to crop yields as well as weather was linked to 11-year cycles. But when the statistics were closely examined, there was little evidence that these apparent correlations were based in reality.
It was not until 1976 that a paper published in Science by John A. Eddy of Saginaw Valley State University renewed interest in the sun-climate relationship with a comprehensive analysis of many different historical records of solar observation. Once this evidence had been synthesized, it became much clearer that there were robust correlations between the temperature and sunspots.
From 1645 to 1715, a period known as the Maunder Minimum, there were virtually no sunspots observed, indicating a "quiet" period in the sun's activity. This period coincides with the height of a time known as the Little Ice Age, which was a period of lower temperatures in Europe and perhaps globally.
 |
|
Image: Mt. Wilson Observatory
CYCLICAL SUNSPOTS.The number of recorded sunspots waxes and wanes on an eleven-year cycle. Low activity from 1645 to 1715, a period known as the Maunder Minimum, coincided with the Little Ice Age.
|
Perhaps the most important development in the solar-climate link came in 1978. At that time, satellites that could measure the Total Solar Irradiance (TSI) received by the Earth from the Sun without atmospheric disturbance were launched. TSI is shown to be directly related to these "activity" cycles that Schwabe noticed 150 years ago. At the maxima of these cycles, there are more sunspots (which are magnetic phenomena that decrease total irradiance), but new instruments show that these dark sunspots are more than compensated for by bright areas on the sun, called faculae. Therefore, the overall irradiance increases in correspondence with higher numbers of sunspots.
The satellite data have now been able to capture two complete cycles (21 and 22). When Richard C. Willson of the Jet Propulsion Laboratory and Columbia University's Center for Climate Systems Research analyzed the data in the September 26, 1997 issue of Science, he noticed an increase in TSI of 0.036 percent from the previous minimum in 1986.
 |
|
RECENT CYCLES
|
There are certain issues regarding the accuracy of the satellite data. When the Active Cavity Radiometer Irradiance Monitor (ACRIM I) satellite ended its mission, there was a delay in launching ACRIM II, which meant that data from the Earth Radiation Budget Satellite (ERBS) satellite data had to be used during the intervening period. ERBS produces different absolute values from its measurements and is not able to calibrate itself as well as the ACRIM satellites. Still, it seems as though the precision of the data is sufficient to believe this increase in the minimum values.
But identifying this evident increase in minimum values as a trend provokes concern. Obviously it is difficult to suggest that this trend is real when there are only two minima ever measured in this way. Also if we are to relate this finding to climate variations, we have to be aware that the warming trend in the surface temperature goes far beyond the last two decades. Therefore, we must try to extend the solar record to assess whether its activity is indeed increasing at the minima of the cycles (and its irradiance is also increasing) and to assess its potential influence on the climate.
The solar record has been extended by the use of the historical sunspot records already mentioned. It is also believed that solar activity correlates to the amounts of isotopes such as 14C and 10Be, which can be found in tree rings and ice cores respectively. In addition, the analysis of ionized calcium emission (an indication of solar magnetic activity) can produce TSI estimates. Therefore estimates of the solar irradiance can be made from the analysis of these different proxies and comparison to the climate records can be undertaken.
 |
|
WARMING TREND
|
In 1995, Judith L. Lean of the Naval Research Laboratory and David Rind of NASA Goddard Institute for Space Studies made correlations between solar irradiance and the temperature curve since 1610. Their solar estimates were based on a number of different proxies and the temperature was taken from the Bradley and Jones Northern Hemisphere record. These results produced a correlation from 1610 to 1800 of 0.86, suggesting a predominant solar influence in the pre-industrial period. The authors also estimated that roughly half the observed warming from 1860 to the present could be attributable to the irradiance increase.
Of the 0.55 degree Celsius warming since 1860, 0.36 degrees Celsius have occurred since 1970, and the solar irradiance can only account for less than a third of this rise. This fact indicates that some other influence, or "forcing" or several different forcings, are becoming more influential in controlling the temperature change. It is thought that CO2 would be the most likely candidate in this industrial and post-industrial era.
Recent studies of global warming have necessitated a more comprehensive effort to quantify the natural climate variability so that the residual change may be attributed to the anthropogenic emissions of greenhouse gases. This attempt at quantification of the many different forces effect on the climate has re-emphasized the complexity of the climate system and the simultaneous interaction of many influences.
It is clear that the solar irradiance may indeed account for some of the temperature increases recorded over the last several decades. However, as the atmospheric CO2 rises--due to the almost exponential increase in emissions from industrial sources--the influence of solar variability on the Earth's climate will most likely decrease, and its relative contribution will be far surpassed by "greenhouse" gases.
Good article. Here’s my summary of the weirdly out-of-place last paragraph:
“Sunspots cause changes in global temperature. But CO2 is more important! Why? Shut up!”
quantify the natural climate variability
Yes, by all means, do that, instead of announcing that the debate is over.
This attempt at quantification... has re-emphasized the complexity of the climate system
But that doesn't keep them from depending on their computer models and arrogantly proclaiming that they know that man is causing global warming.
THERE IS NO GLOBAL WARMING. NONE, NADA, ZIP.
From 1645 to 1715, a period known as the Maunder Minimum, there were virtually no sunspots observed, indicating a “quiet” period in the sun’s activity. This period coincides with the height of a time known as the Little Ice Age,Al Gore scratches head.
ping
The entire idea that the sun could somehow be responsible for global warming is an idea that could never be accepted by the liberals, the mainstream press or mainstream academia.
Such an idea-were it accepted- would leave man totally out of the equation, as no economic or political solution could ever hope to affect the behavior of the sun.
Wrong. Computer models show that the area where I live is expected to warm by 27 degrees F over the next ten hours alone, all due to the increased CO2 from daytime human activity. Over the next 10 weeks, the models show an expected additional increase of 20-30 degrees F, again due to human activity. Fortunately, Community Orgnizer 44 is on the job, and his carbon tax and other tax increases are, according to the model, going to get that runaway warming slowed down by the end of the day and under control by the end of the year.
This is significant because Scientific American has been a major player in pushing the global warming story line. They have published lots of articles on the subject, their editors accept it as a given in their pieces, and they have on at least one occasion devoted more or less an entire issue to mounting an attack on the credibility of an individual researcher, a Dane named Bjorn Lomborg.
For Scientific American to publish anything in the least skeptical on this subject without a at least four or five authors on the rebuttal side, with sidebar pieces on Anne Waple’s connections to the oil industry, is noteworthy.
The increase in temperature over the next few weeks or Global warming ,yeah its called CLIMATE CHANGE ,or better known as SPRING.
The greatest tax rip-off in history; Global Warming.
(baaaaaaaaaaarf, baaaaaaaaaaaaaaaaaaaaaaaarf, baarrrrfffff)
IMHO
"Recent studies of global warming have necessitated a more comprehensive effort to quantify the natural climate variability so that the residual change may be attributed to the anthropogenic emissions of greenhouse gases."
So she admits that the goal is to attribute climate change to anthropogenic emissions of greenhouse gases.
BTW, if you missed the earlier thread on FR, there is a great article here from Monckton's testimony to the U.S. Congress.
http://scienceandpublicpolicy.org/reprint/markey_barton_letter.html
Take another look at the date: 1997!
If you look at the chart below, you will see that sunspot activity (during solar maxes--the individual peaks every apprx 11 yrs) has been relatively high since about 1900 and almost non-existent for the period between about 1625 and 1725. This period is known as the Maunder (sunspot) Minimum or "Little Ice Age".-etl

____________________________________________________
From BBC News [yr: 2004]:
"A new [2004] analysis shows that the Sun is more active now than it has been at anytime in the previous 1,000 years. Scientists based at the Institute for Astronomy in Zurich used ice cores from Greenland to construct a picture of our star's activity in the past. They say that over the last century the number of sunspots rose at the same time that the Earth's climate became steadily warmer."..."In particular, it has been noted that between about 1645 and 1715, few sunspots were seen on the Sun's surface.
This period is called the Maunder Minimum after the English astronomer who studied it. It coincided with a spell of prolonged cold weather often referred to as the "Little Ice Age". Solar scientists strongly suspect there is a link between the two events - but the exact mechanism remains elusive."
http://news.bbc.co.uk/1/hi/sci/tech/3869753.stm
____________________________________________________
It's really hard to imagine how this little ball of fire could have any impact on our climate at all. /s
But the main arguments being made for a solar-climate connection is not so much to do with the heat of the Sun (the sun isn't getting warmer) but rather with its magnetic cycles. When the Sun is more magnetically active (typically around the peak of the 11 year sunspot cycle --we are a couple of yrs away at the moment), the Sun's magnetic field is better able to deflect away incoming galactic cosmic rays (highly energetic charged particles coming from outside the solar system). The GCRs are thought to help in the formation of low-level cumulus clouds -the type of clouds that BLOCK sunlight and help cool the Earth. So when the Sun's MF is acting up (not like now -the next sunspot max is expected in about 2011 or 2012), less GCRs reach the Earth's atmosphere, less low level, sunlight-blocking clouds form, and more sunlight gets through to warm the Earth's surface...naturally. Clouds are basically made up of tiny water droplets. When minute particles in the atmosphere become ionized by incoming GCRs they become very 'attractive' to water molecules, in a purely chemical sense of the word. The process by which the Sun's increased magnetic field deflects incoming cosmic rays is very similar to the way magnetic fields steer electrons in a cathode ray tube (old-time television tube) or electrons and other charged particles around the ring of a subatomic particle accelerator.-etl
____________________________________________________
There's an excellent new book out on the subject titled The Chilling Stars. It's written by one of the top scientists advancing this theory (Henrik Svensmark).

http://www.sciencedaily.com/books/t/1840468157-the_chilling_stars_the_new_theory_of_climate_change.htm
____________________________________________________
And here is the website for the place where he does his research:
2008: "The Center for Sun-Climate Research at the DNSC investigates the connection between variations in the intensity of cosmic rays and climatic changes on Earth. This field of research has been given the name 'cosmoclimatology'"..."Cosmic ray intensities – and therefore cloudiness – keep changing because the Sun's magnetic field varies in its ability to repel cosmic rays coming from the Galaxy, before they can reach the Earth." :
http://www.spacecenter.dk/research/sun-climate
____________________________________________________
From a well-referenced wikipedia.com column (see wiki link for ref 14):
"Sunspot numbers over the past 11,400 years have been reconstructed using dendrochronologically dated radiocarbon concentrations. The level of solar activity during the past 70 years is exceptional — the last period of similar magnitude occurred over 8,000 years ago. The Sun was at a similarly high level of magnetic activity for only ~10% of the past 11,400 years, and almost all of the earlier high-activity periods were shorter than the present episode.[14]"
[14] ^Solanki, Sami K.; Usoskin, Ilya G.; Kromer, Bernd; Schüssler, Manfred & Beer, Jürg (2004), “Unusual activity of the Sun during recent decades compared to the previous 11,000 years”, Nature 431: 1084–1087, doi:10.1038/nature02995, . Retrieved on 17 April 2007 , "11,000 Year Sunspot Number Reconstruction". Global Change Master Directory. Retrieved on 2005-03-11.
____________________________________________________
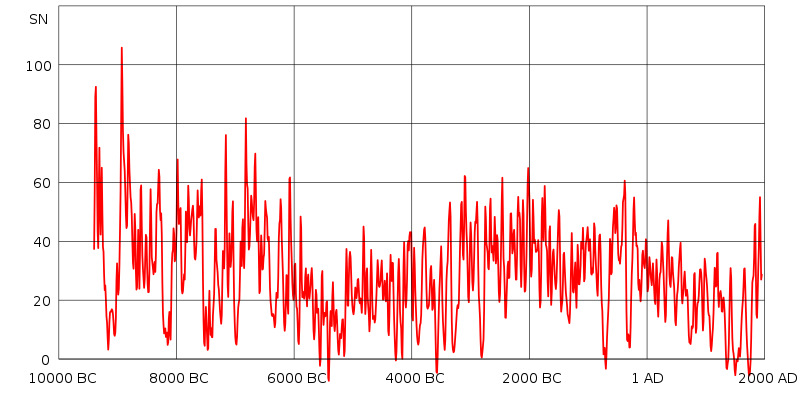
"Reconstruction of solar activity over 11,400 years. Period of equally high activity over 8,000 years ago marked.
Present period is on [the right]. Values since 1900 not shown."
http://en.wikipedia.org/wiki/Solar_variation
____________________________________________________
From NASA's Solar and Heliospheric Observatory's "Not So Frequently Asked Questions" section:
Q-Does the number of sunspots have any effect on the climate here on Earth?
A-Sunspots are slightly cooler areas on the surface of the Sun, due to the intense magnetic fields, so they radiate a little less energy than the surroundings. However, there are usually nearby areas associated with the sunspots that are a little hotter (called falculae), and they more than compensate. The result is that there is a little bit more radiation coming from the Sun when it has more sunspots, but the effect is so small that it has very little impact on the weather and climate on Earth.
However, there are more important indirect effects: sunspots are associated with what we call "active regions", with large magnetic structures containing very hot material (being held in place by the magnetism). This causes more ultraviolet (or UV) radiation (the rays that give you a suntan or sunburn), and extreme ultraviolet radiation (EUV). These types of radiation have an impact on the chemistry of the upper atmosphere (e.g. producing ozone). Since some of these products act as greenhouse gases, the number of sunspots (through association with active regions) may influence the climate in this way.
Many active regions produce giant outflows of material that are called Coronal Mass Ejections. These ejections drag with them some of the more intense magnetic fields that are found in the active regions. The magnetic fields act as a shield for high-energy particles coming from various sources in our galaxy (outside the solar system). These "cosmic rays" (CRs) cause ionization of molecules in the atmosphere, and thereby can cause clouds to form (because the ionized molecules or dust particle can act as "seeds" for drop formation).
If clouds are formed very high in the atmosphere, the net result is a heating of the Earth - it acts as a "blanket" that keeps warmth in.
If clouds are formed lower down in the atmosphere, they reflect sunlight better than they keep heat inside, so the net result is cooling. Which processes are dominant is still a matter of research.
http://sohowww.nascom.nasa.gov/classroom/notsofaq.html#SUNSPOT_CLIMATE
____________________________________________________
NASA graph of sunspot activity over the past 400 years [note the profound lack of sunspot activity during the "Little Ice Age" period (apprx 1650-1720), AND the sharp INCREASE particularly during the past 60 years:

http://science.nasa.gov/ssl/pad/solar/images/ssn_yearly.jpg
____________________________________________________

100,000-Year Climate Pattern Linked To Sun's Magnetic Cycles:
ScienceDaily (Jun. 7, 2002) HANOVER, N.H.
Thanks to new calculations by a Dartmouth geochemist, scientists are now looking at the earth's climate history in a new light. Mukul Sharma, Assistant Professor of Earth Sciences at Dartmouth, examined existing sets of geophysical data and noticed something remarkable: the sun's magnetic activity is varying in 100,000-year cycles, a much longer time span than previously thought, and this solar activity, in turn, may likely cause the 100,000-year climate cycles on earth. This research helps scientists understand past climate trends and prepare for future ones.
http://www.sciencedaily.com/releases/2002/06/020607073439.htm
______________________________________
From NASA.gov, September 30, 2008:
Coinciding with the string of blank suns is a 50-year record low in solar wind pressure, a recent discovery of the Ulysses spacecraft. (See the Science@NASA story Solar Wind Loses Pressure.) The pressure drop began years before the current minimum, so it is unclear how the two phenomena are connected, if at all. This is another mystery for SDO and the others.
...
"There is also the matter of solar irradiance," adds Pesnell. "Researchers are now seeing the dimmest sun in their records. The change is small, just a fraction of a percent, but significant. Questions about effects on climate are natural if the sun continues to dim."
Article:
Spotless Sun: Blankest Year of the Space Age [50 years]
______________________________________________________
Astronomers who count sunspots have announced that 2008 is now the "blankest year" of the Space Age
As of Sept. 27, 2008, the sun had been blank, i.e., had no visible sunspots, on 200 days of the year. To find a year with more blank suns, you have to go back to 1954, three years before the launch of Sputnik, when the sun was blank 241 times.
"Sunspot counts are at a 50-year low," says solar physicist David Hathaway of the NASA Marshall Space Flight Center. "We're experiencing a deep minimum of the solar cycle."
And it is a very quiet time. If solar activity continues as low as it has been, 2008 could rack up a whopping 290 spotless days by the end of December, making it a century-level year in terms of spotlessness.
Hathaway cautions that this development may sound more exciting than it actually is: "While the solar minimum of 2008 is shaping up to be the deepest of the Space Age, it is still unremarkable compared to the long and deep solar minima of the late 19th and early 20th centuries." Those earlier minima routinely racked up 200 to 300 spotless days per year.
Some solar physicists are welcoming the lull.
"This gives us a chance to study the sun without the complications of sunspots," says Dean Pesnell of the Goddard Space Flight Center. "Right now we have the best instrumentation in history looking at the sun. There is a whole fleet of spacecraft devoted to solar physics--SOHO, Hinode, ACE, STEREO and others. We're bound to learn new things during this long solar minimum."
As an example he offers helioseismology: "By monitoring the sun's vibrating surface, helioseismologists can probe the stellar interior in much the same way geologists use earthquakes to probe inside Earth. With sunspots out of the way, we gain a better view of the sun's subsurface winds and inner magnetic dynamo."
"There is also the matter of solar irradiance," adds Pesnell. "Researchers are now seeing the dimmest sun in their records. The change is small, just a fraction of a percent, but significant. Questions about effects on climate are natural if the sun continues to dim."
Pesnell is NASA's project scientist for the Solar Dynamics Observatory (SDO), a new spacecraft equipped to study both solar irradiance and helioseismic waves. Construction of SDO is complete, he says, and it has passed pre-launch vibration and thermal testing. "We are ready to launch! Solar minimum is a great time to go."
Coinciding with the string of blank suns is a 50-year record low in solar wind pressure, a recent discovery of the Ulysses spacecraft. (See the Science@NASA story Solar Wind Loses Pressure.) The pressure drop began years before the current minimum, so it is unclear how the two phenomena are connected, if at all. This is another mystery for SDO and the others.
Who knew the blank sun could be so interesting?
More to come...
http://science.nasa.gov/headlines/y2008/30sep_blankyear.htm
Related article:
Solar Wind Loses Power, Hits 50-year Low - Sept. 23, 2008
http://science.nasa.gov/headlines/y2008/23sep_solarwind.htm
Solar Warming ... Bush’s fault.
That is certainly a significant observation. However, from the title to the conclusions, to the twists and turns in between, the authors go out of their way to spin this article into skepticism of solar driven temperatures. Their tone and emphasis is clearly obvious, and their bias is more evident than that usually found in a a freshman high school term paper.
The LEADERS of the “Manmade Global Warmimg” movement don’t really care whether it’s true or not . What they want is global taxation & loss of sovereignty for the US.
I can't wait for the colder temps to start shrinking the atmospheric CO2, so it becomes obvious to all that this was all a bunch of horsepucky to begin with.
"Almost exponential increase from industrial emissions" is a totally laughable lie in a ocean of lies.
Disclaimer: Opinions posted on Free Republic are those of the individual posters and do not necessarily represent the opinion of Free Republic or its management. All materials posted herein are protected by copyright law and the exemption for fair use of copyrighted works.

