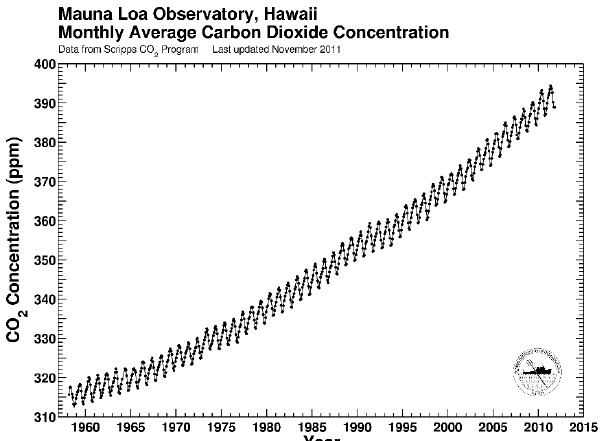
Figure1 The Keeling curve Image: Scripps Institute
Posted on 12/09/2012 7:26:39 AM PST by Ernest_at_the_Beach
Guest post by Tom Fuller
The physics behind the theory of global warming are solid. CO2 is a greenhouse gas, we’re emitting industrial levels of it, with China now in the lead for emissions. A significant portion remains in the atmosphere for a fairly long time, though the residence time is widely disputed. This residence of CO2 retards the cooling of the Earth and temperatures warm as a result.
One of the few non-controversial datasets in climate change is the Keeling curve, the graph of the concentrations of CO2 in the atmosphere reproduced here:
Figure1 The Keeling curve Image: Scripps Institute
We see concentrations rising steadily from 315 parts per million in 1960 to 395 ppm last year. It’s close to 400 ppm now.
Human emissions of CO2 caused by burning of fossil fuels and production of cement have risen similarly:
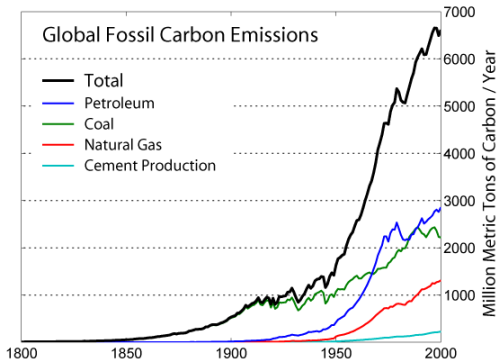
Figure 2 global emissions Image: Wikipedia
Emissions have climbed at an even higher rate than concentrations.
And the third data source to look at (for simplicity’s sake–we could actually look at dozens of data sources) is temperature changes. This chart shows the global average temperature change from a ‘normal’ 30-year range from 1950-1980. It comes from the Goddard Institute for Space Studies, led by scientist James Hansen.
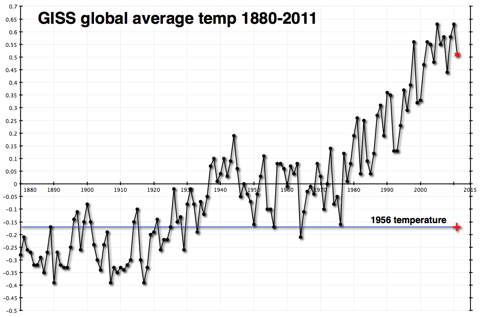
Figure 3 GISS global temperature anomalies Image: NASA GISS
This shows a fairly constant rise in temperatures since 1978.
Once again, you don’t have to be a climate scientist to think that there seems to be a connection. The physical theory published first by Svante Arrhenius over 100 years ago and elaborated on by a century’s worth of scientists has observational evidence that tends to confirm it. I certainly believe in it.
In fact, I believe that global temperatures will probably rise by about 2 degrees Celsius over the course of this century. The difference in estimated temperature rises from different sources almost always comes from the differences in estimated atmospheric sensitivity to concentrations of CO2 in the atmosphere. Having extra CO2 in the atmosphere warms the atmosphere, which is presumed to produce more water vapor, which is also a greenhouse gas and would contribute more warming than the CO2 by itself. How much extra warming would ensue is pretty much the heart and soul of the debate over global warming.
Those who think that there isn’t much of an additional effect (that sensitivity of the atmosphere is low) have been chuckling very publicly because temperatures haven’t risen very much (if at all) since the big El Nino year of 1998. This is not hugely surprising, as the shape of the data is uneven, a sawtooth with ups and downs that can last a decade or longer. But it is happening at an inconvenient time politically for those who are worried that sensitivity is high. They are trying to get the world to prepare for warming of 4.5C or higher, without much success.
Here’s what temperatures look like more recently.
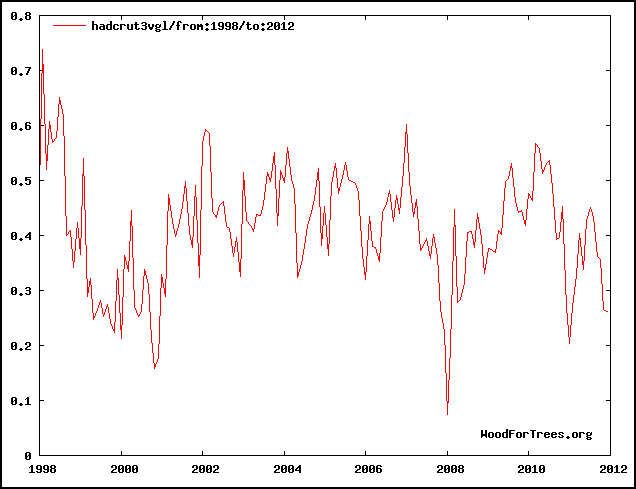
Figure 4 Hadcrut3 global mean temperature 1998 to 2012 Image: Woodfortrees.org
By itself, this chart doesn’t explain very much. As I said, it is not uncommon or unexpected for the temperature record to have flat or declining periods that last a decade or more.
However, I have a problem. The Carbon Dioxide Information Analysis Center (CDIAC) has estimates of how much CO2 humans have emitted since 1750. (Confusingly, they convert the CO2 to tons of carbon with a fixed formula.) That chart is the first one way up there at the top of the post. It rises dramatically
But looking at the data global.1751_2009 (3), one thing jumps out at me. CDIAC writes “Since 1751 approximately 356 billion metric tonnes of carbon have been released to the atmosphere from the consumption of fossil fuels and cement production.” And they helpfully provide an Excel spreadsheet showing their estimates by year.
And almost one-third of that number, 110 billion metric tonnes, have occurred since that time in 1998 when temperatures reached their temporary plateau.
| 1998 | 6644 |
| 1999 | 6611 |
| 2000 | 6766 |
| 2001 | 6929 |
| 2002 | 6998 |
| 2003 | 7421 |
| 2004 | 7812 |
| 2005 | 8106 |
| 2006 | 8372 |
| 2007 | 8572 |
| 2008 | 8769 |
| 2009 | 8738 |
Because heat moves somewhat sluggishly through the earth’s oceans, and because there is a lag factor in other earth systems, we do not expect a hair-trigger reaction to increases in CO2 emissions and concentrations.
But one-third of all human emissions of CO2 have occurred since 1998. And temperatures haven’t budged as a result.
This does not ‘disprove’ global warming–at all. I still believe that temperatures will climb this century, mostly as a result of the brute force effect of the 3,000 quads of energy we will burn every year starting in 2075–the reason I started this weblog.
However it makes it exceedingly difficult to use the past 15 years as evidence of a very high sensitivity of the atmosphere to CO2 concentrations. And it makes me feel more comfortable about my ‘lukewarm’ estimate of 2C temperature rises as opposed to the more alarming 4.5C rises put forward by some of those who are most active in the movement to reduce emissions drastically.
And it makes me wonder about why people don’t include relevant data when they discuss these issues. Is it really that politically incorrect to show real data, even if that data doesn’t advance your case?
Tom Fuller blogs at: 3000Quads and is co-author with Steve Mosher of the CRUTape Letters.
New ice age is due in 2083 see Uni ersity of Mexico
The power base of globalism: Global government idealists in for the hope of a UN taxation power on oil and land use; Universities and enviornmentalists for the bazillions in European and American research money; Corporations and businesses looking for money for product development and sales. European and American government and politicans seeing the opportunity for massive new taxation and power. Third worlders and UN employees looking for a steady stream of wealth transfer (enslavement) from the West to their bank accounts.
Thanks Ernest!
Disclaimer: Opinions posted on Free Republic are those of the individual posters and do not necessarily represent the opinion of Free Republic or its management. All materials posted herein are protected by copyright law and the exemption for fair use of copyrighted works.