Skip to comments.
New Orleans Levee Failure Assessment - Part V
numerous
Posted on 11/07/2005 8:54:03 PM PST by jeffers
New Orleans Levee Failure Analysis - Part V
Contents
Introduction and Basic Levee Construction, Section and Elevation Details
Section 1. Pre-Landfall Flooding in Kenner and Western Metairie of East Jefferson Parish
Section 2. Analysis of the 17th Street and London Canal Breaches and Post Katrina Flood Sequence in Downtown New Orleans
Section 3. Surge Sequence for the Industrial Canal Basin, Analysis of the Five Major Breaches and east Orleans Parish Flooding
Section 4. Flood Sequence for St. Bernard Parish and the Lower Ninth Ward, MRGO Reach Failure Analysis
Section 5. Contributory Causality, Political and Funding Issues Leading to Levee Failures
Introduction:
This is part five of a five part series analyzing and assessing the New Orleans flood resulting from landfall of Hurricane Katrina. Parts 1 through 4 can be found at the links below.
Part 1 is a timeline sequence of who reported what flood events and when it was reported. It can be found here:
Part I: Hurricane Katrina Flood Report Sequence
Part 2 is a discussion of the levee system's subsidence prior to Hurricane Katrina. It can be found here:
Part II: Pre-Katrina Levee Assessment
Part 3 is a discussion of the overall storm surge sequence and levee failure mechanisms relating to the 17th Street Canal and London Canal seawall breaches. It can be found here:
Part III: Downtown New Orleans Levee Failures
Part 4 is a discussion of breaching and topping in St. Bernards and east Orleans Parish. it can be found here:
Part IV: New Orleans Levee Failure Assessment
Some elements of this discussion will occur out of the sequence in which they occurred, to facilitate understanding of the processes involved, and to minimize the bandwidth required to download similar images more than once. The correct sequence would be
1. Pre-Katrina Flooding in Kenner
2. MRGO Topping and Breaching
3. Industrial Canal Breaching
4. St. Bernard Parish Flooding
5. Flooding from the 17th and London Canal Breaches
In this discussion, issues involving the 17th Street Canal and London Canal Breaches are instead discussed immediately following the PreKatrina Kenner Flooding, since both sets of events affected overlapping areas and use similar graphics.
Analysis and conclusions for levee failures and flooding in Plaquemines Parish is largely omitted in this effort. The Plaquemines levees were designed for a maximum Categtory 3 storm, were instead subject to Category 4 winds and Category 5 storm surge, and simply failed under loads that exceeded anything they were designed to withstand.
Basic Levee Construction
Two main types of levee protection systems were in general use prior to Katrina's landfall, one being older earthen levees, modernized and raised with the addition of concrete capwalls, commonly referred to as an I-wall, and typically in service around downtown New Orleans and the Industrial Canal area, and the other being earthen levees in use around the remaining three sides of east Orleans and St. Bernard Parish.
The following images detail typical examples of the concrete capwall (I-wall) type levees in use around downtown New Orleans and the Industrial Canal, and were obtained from Army Corps of Engineers Field Engineering Manuals, specifically "Design and Construction of Levees", "Retaining and Flood Walls", and "Design of Sheet Pile Walls", all available at:
CoE Engineering Manuals http://www.usace.army.mil/inet/usace-docs/eng-manuals/em.htm

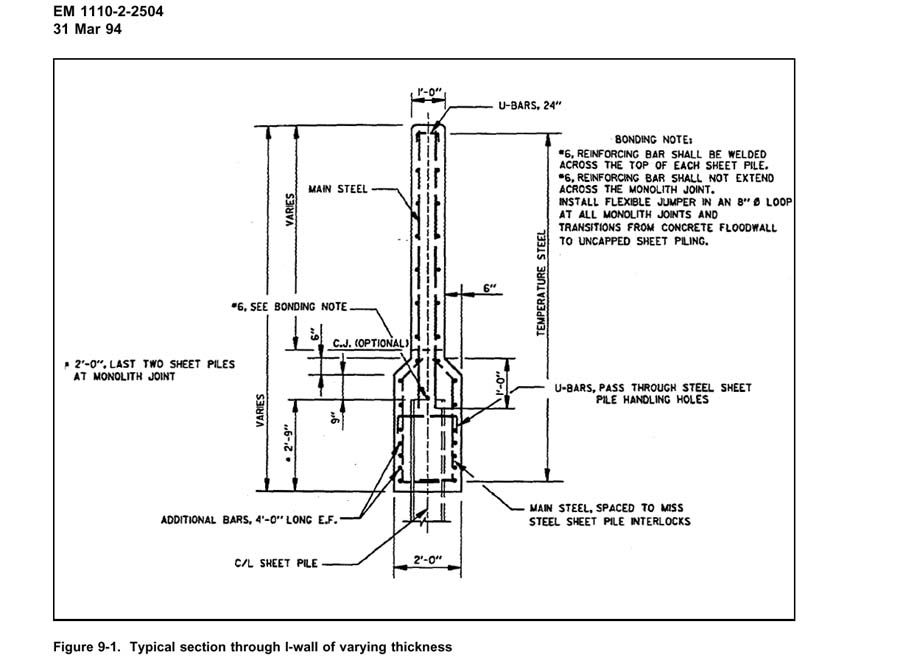
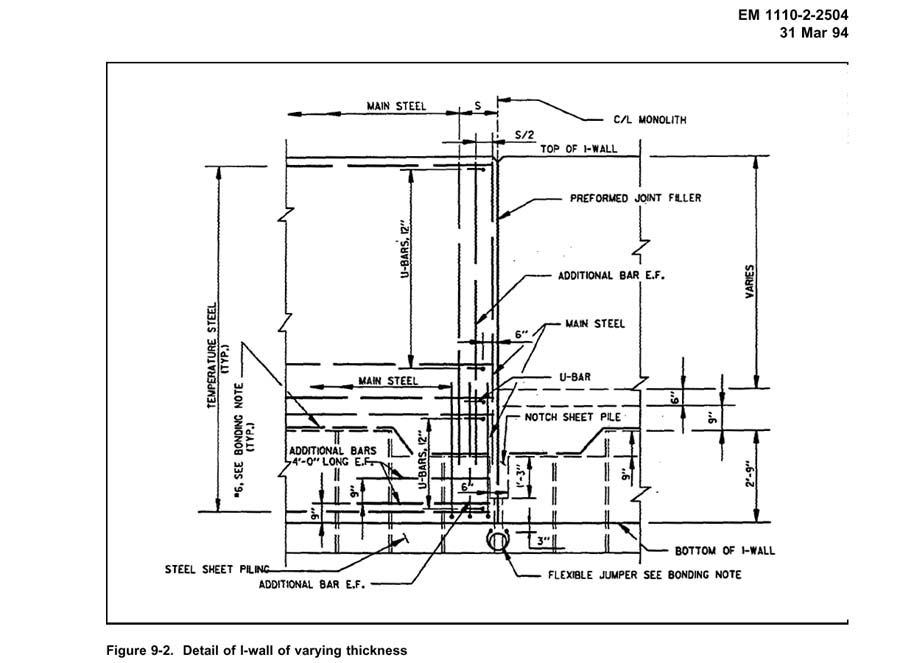
In the case of the 17th Street and London Canal levees, the sheet piles were driven to depths of 17.5 and 16 feet respectively.
The image below is a typical cross section of an earthen levee, similar to the type in service along the northern, eastern, and southern reaches of east Orleans and St. Bernards Parishes.

Generally, the failed sections of earthen levee around St. Bernard and east Orleans Parishes do not appear to have included sheetpiling or other core construction. In a very few instances, evidence of a sheetpile core is now exposed and in general, these occurrences tend to be present where older pre-existing canals and natural waterways cut across the levee's intended location, probably due to recognition that otherwise seepage and percolation would be more of a problem at these locations.
TOPICS: Business/Economy; Crime/Corruption; Culture/Society; Extended News; Front Page News; Government; Miscellaneous; News/Current Events; Politics/Elections; Technical; US: Louisiana; Your Opinion/Questions
KEYWORDS: 229; blanco; canal; canals; corruption; flooding; hurricane; katrina; katrinafailures; landrieu; levee; leveeboard; levees; louisiana; nagin; neworleans; rita; wilma
Navigation: use the links below to view more comments.
first 1-20, 21-40, 41-49 next last
(continued below)
1
posted on
11/07/2005 8:54:04 PM PST
by
jeffers
To: jeffers
Section 1. Pre Storm Flooding in Jefferson Parish East (0345-1500 CDT)
Prior to Katrina's arrival near New Orleans, several reports of flooding were posted by various news agencies, notably in areas northeast, (Transcontinental Drive and Kawanee Avenue), and southwest (Duncan Canal and 1200 block of Williams Drive) of Kenner, Louisiana, a subsection of urban New Orleans just west of downtown, on the east bank of the Mississippi River.
0345 AM, Monday, August 29, 2005
"Some East Jefferson drainage canals were topping out as huge pumps struggled to suck rainfall out of neighborhoods and move it over the levee into Lake Pontchartrain.
Watching the progress of the storm from Jefferson Parish's emergency operations center in Marrero, Walter Maestri sounded an early note of optimism at 3:45 a.m., as Katrina jogged a bit off course. But he also cautioned that conditions could deteriorate as the day progresses.
"It looks like we've done fairly well," he said. "We have had no reports of serious wind damage, and we don't see any indication of tidal surge problems. "But of course it's still really early. The next four to five hours will tell the tale."
Some East Jefferson drainage canals were topping out as huge pumps struggled to suck rainfall out of neighborhoods and move it over the levee into Lake Pontchartrain.
Street flooding was reported in the vicinty of Transcontinental Drive and Kawanee Avenue, a frequent trouble spot about halfway between the Suburban and Elmwood canals, Maestri said. Rain was falling there at the rate of three inches per hour."
0345 CDT Report Source
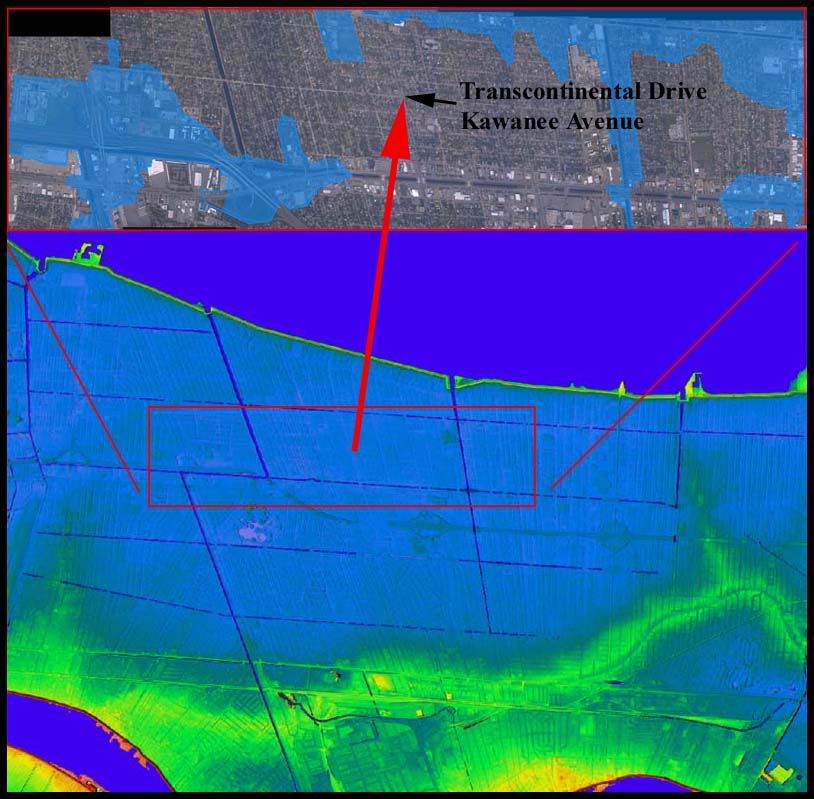
The image above is comprised of several elements. The top pane is a composite of 9 high resolution (4096 by 4096 pixels each) aerial images taken a few days after Hurricane Katrina. The transparent blue overlay in the top pane is the result of close-up examination for flooding indicators, such as debris patterns inconsistent with eyewall winds and evidence of soil transport.
The lower pane is a 3 meter (9 feet) per pixel Digital Elevation Model (DEM) including most of Kenner and western Metairie, Louisiana. This DEM was rendered with sea level artificially reduced to negative 10 below sea level feet in order to display areas inside the levee protection systems in their normally dry, pre-storm state.
The following was posted between 0645 and 0730 CDT, Monday, August 29th, 2005:
In Kenner, police Capt. Steve Caraway said the department's officers were pulled from the streets around 4:45 a.m., after the gusts became too intense.
Caraway said there were reports of street flooding in the 900 to 1200 blocks of Williams Boulevard. He also said there were reports that the Duncan Canal was close to overflowing.
Wind gusts of 84 mph were recorded at airport around 6 a.m.
~0700 CDT Report Source
The section of the Duncan Canal referenced in the above report is west of Kenner, near the New Orleans International-Moisant Field airport, where that canal goes underground to pass beneath the runway flowing WNW towards Lake Pontchartrain. Most evidence of flooding in this area appears to have been the result of the canal filling, almost certainly due to precipitation from pre-Katrina rain bands, to the point where the underground tunnels could no longer accomodate the flow, which then backed up and spilled over into surrounding areas. Other canals in this area which also pass underground for short sections show similar evidence of localized flooding.
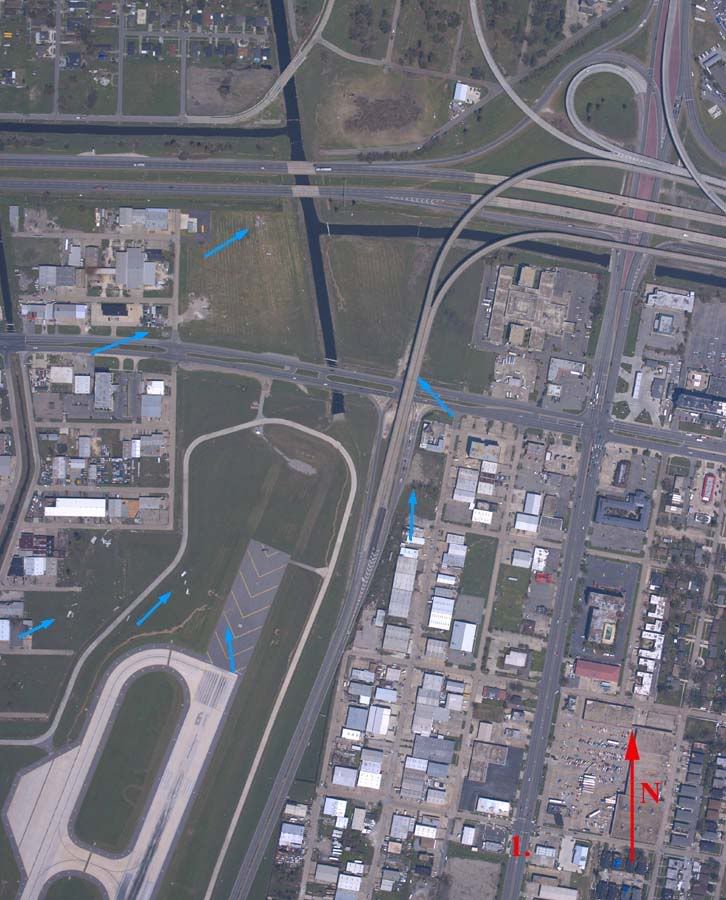
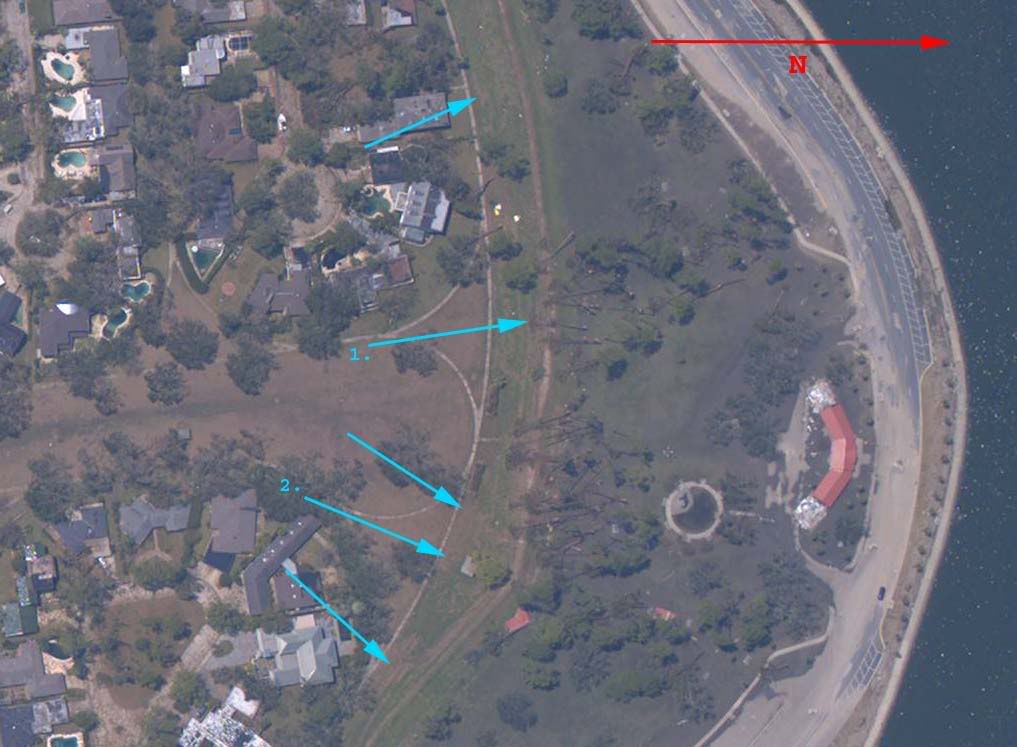
The above aerial photograph shows where the Duncan Canal emerges from underground near the north end of the airport, with the 2500 block of Williams Boulevard indicated by the red numeral 1. The center of Kenner is 4 blocks (2800 feet) south of this intersection. Evidence of flooding is indicated at the blue arrows.
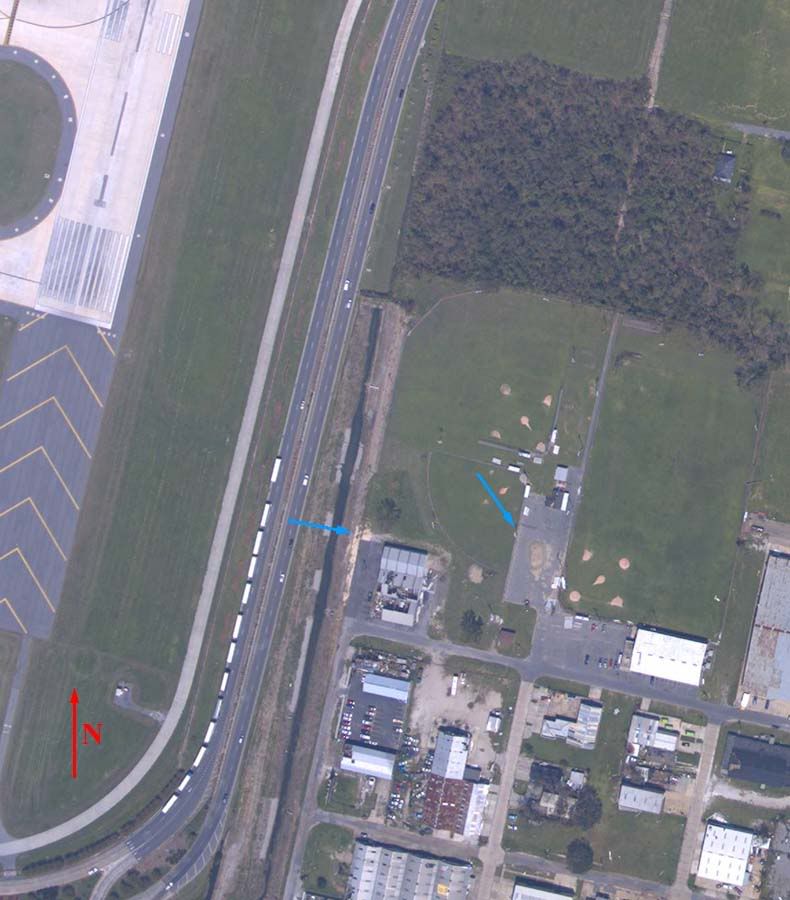
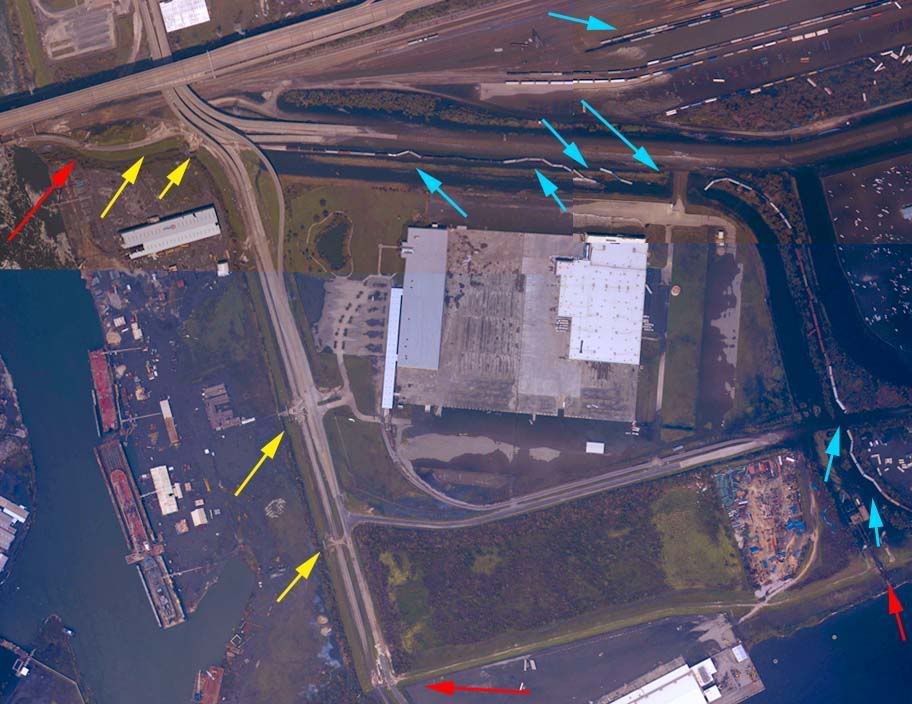
This above aerial photograph shows the area where the Duncan Canal goes underground southeast of the airport. The 1200 block of Williams Boulevard is out of the frame immediately east of the image's northeast corner. Flooding is indicated by the blue arrows. Those familiar with certain questions raised during the evacuations of downtown New Orleans may find other items of interest (13 of them, outbound) in this image.
Later in the day, as the rainfall continued to overwhelm canal pumps, the flooding continued to worsen, in areas further north of Kenner, much closer to the Lake, as evidenced by this report:
Kenner flooding serious
Monday, 1:45 p.m.
Williams Boulevard in Kenner is flooded north of I-10 to just before the lake levee, officials said.
Officials said the flooding appears to be more severe than seen on May 8, 1995. However, Lake Pontchartrain did not overtop levees. Throughout Williams and elsewhere in Kenner, businesses, homes and apartments are dealing with flooding and significant roof damage.
Chateau Boulevard is a zig-zag of trees and power lines blocking one of Kenner's main arteries.
1345 CDT Report Source
As noted in the 1:45 pm report above, any topping of the Lake Pontchartrain levees in this area was minimal, resulting in soil transport visible only at the highest zoom levels in the aerial images, which did not even reach the base of the inner levee surface. The flooding described above could therefore only have originated from rain and overflowing canals in Jefferson Parish. No levee breaches exist or contributed to this flooding.
Monday, 10:20 p.m.
Jefferson Parish's Chief Administrative Assistant Tim Whitmer said the damage from Hurricane Katrina was almost equally split between the east bank and the West Bank. "We have widespread devastation in the parish," he said.
Between 8 and 10 p.m., he said about 80 employees had arrived for work and said more were continuing to show up.
Widespread flooding also was reported in Kenner in East Jefferson, particularly north of the interstate.
The first step on Tuesday, Whitmer said, is to get all remaining flood water pumped out of the streets. Whitmer said parish officials expect to get most of the pumping stations online overnight, with the possible exception of the Duncan Canal and Bonnabel stations, which lost their roofs in the storm.
Workers were evacuated from those stations for safety reasons, he said. Work crews will inspect the stations Tuesday to determine if there is any additional damage besides the roofs.
Whitmer said he had been told by Sheriff's Office officials that Old Metairie was fairly dry and that by late afternoon, Levee District officials reported water levels dropping on Airline Drive in Kenner.
2220 CDT Report Source
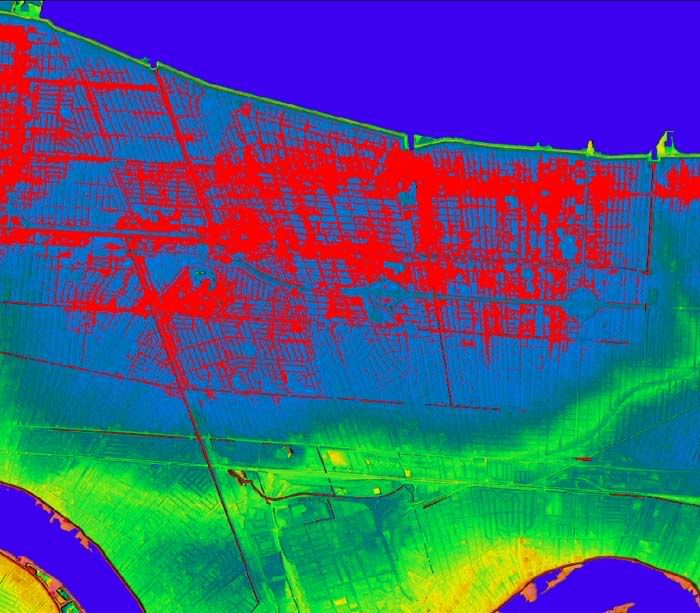
The above image is rendered from the same 3 meter per pixel DEM as used previously, this time with sea level (rendered in red) simulated at a level of negative 4.8 feet, the level which most closely matches the flood levels indicated by the aerial imagery analysis in Photo 1, applied to the wider Metairie/Kenner area. This analysis is based on two critical assumptions. One, that flooding through the Kenner/Metairie area was consistent, i.e., all the canals filled and all of them overflowed. This may or may not have been the case. Two, that all flooding that occurred left evidence still visible when the aerial imagery was captured. This is almost certainly inaccurate, as the area of Transcontinental Drive and Kawanee Avenue, referenced in the first available report of flooding, does not show evidence of current or prior high water as of the time the aerial imagery was taken. Because of this, this image may overestimate flooding that took place in areas where the pumps may have continued to run, and this image also almost certainly underestimates flooding that took place in areas where the pumps were either deliberately shut down, failed, or were unable to keep up with the rainfall.
Note in the original aerial imagery, all of the these flooded areas had already been drained and had dried (some still damp, but no standing water) before the sections of New Orleans that flooded as a result of levee breaches had even begun draining operations.
Aaron Broussard's decision to evacuate the Jefferson Parish pump operators may have played a role in this flooding. Because it has not been widely reported whether the pumps were abandoned while still in operation, or whether they were shutdown pror to the evacuation, it is currently unclear what impact the decision to evacuate the pump operators may have had. If the pumps were shut down prior to evacuation, or failed due to being unsupervised during that period, the damage directly resulting from that decision may be measured in the millions or billions of dollars.
2
posted on
11/07/2005 8:55:04 PM PST
by
jeffers
To: jeffers
Section 2. Analysis of the 17th Street and London Canal Breaches and Post Katrina Flood Sequence in Downtown New Orleans
The images below clearly indicate the failure mechanism in the 17th Street Canal and London Canal I-Wall breaches. In the first image, from the 17th Street Canal breach, a layer of weak or weakened subsoil succumbed to lateral loads imposed by elevated water levels fed into the canal by storm surge on Lake Pontchartrain's southern shore, allowing the entire cross section of the embankment and capwall to be displaced an estimated 42 feet from their pre-storm position.
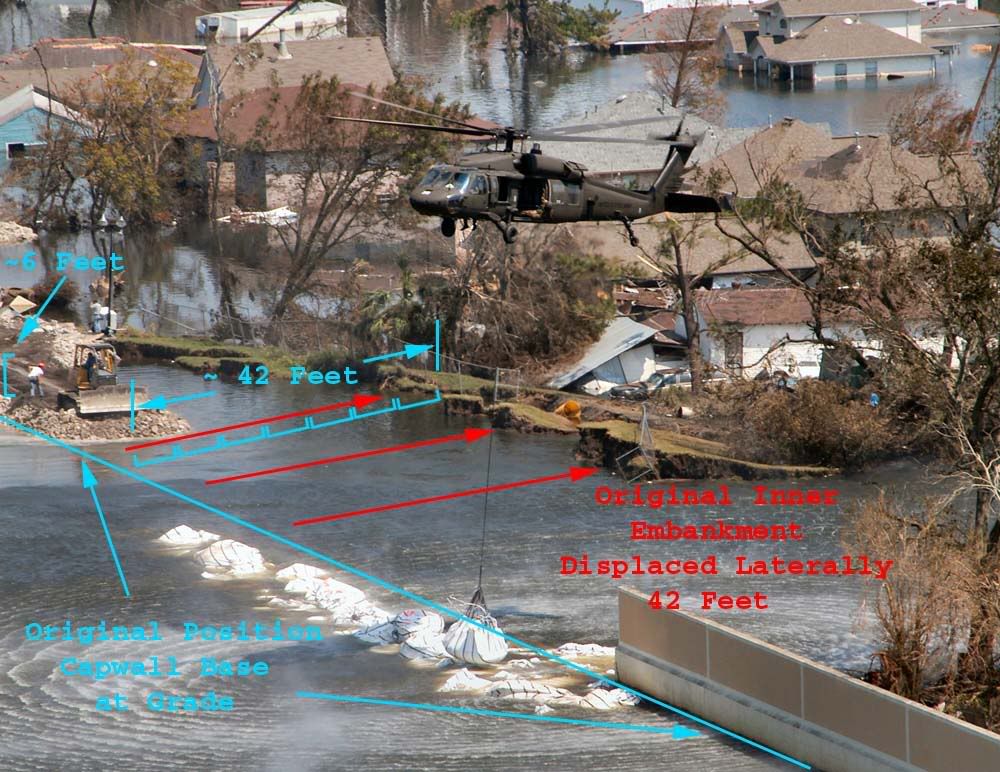
Similar evidence is shown in the image below from the southern London Canal breach.
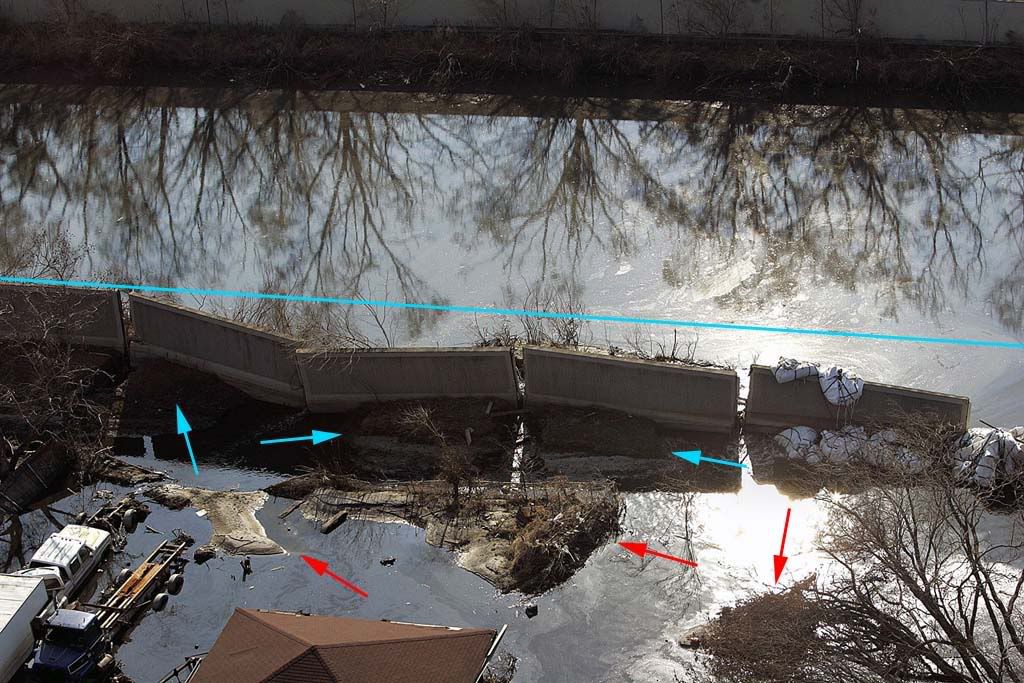
In addition, the image above gives some indication of the depth of the weak or weakened layer at this location. The cross-image blue line represents the approximate original position of the capwall's crown prior to the storm. Sections of the inner embankment were displaced as outlined above by the pressure of the high water on the canal side of the capwall, noted in the image at the blue arrows.
The red arrows, however, denote area of soil displacement which originated well behind the embankment and above the weak or weakened layer, and which were displaced and folded upwards when the embankment and capwall pushed them back in the course of its own displacement. These are secondary effects and almost certainly due to the same weak layer at some depth below original grade.
Because the post storm imagery indicates similar failure mechanisms between the 17th Street and London Canal breaches, the following discussion will not discriminate between the two locations.
At some point prior to failure, the resistence to lateral displacement of certain sections of the embankment, resistance owed primarily to the embankment and capwall's weight, footprint area, and the weak layer's "coefficient of friction", was approached by the potential energy of the weight of the surge water pushing in against the levee. When the two opposing forces reached equal magnitude, that section of the levee was essentially "floating" on top of the weak or weakened subsurface soil layer. This condition probably extended over a wide area, as original soil tests indicate that the weak soil layer was not an isolated occurrence. The variables which ordained certain sections to failure, while allowing other sections to survive, may never be fully known, but analysis of these must include the following possibilities:
1. Weak layer depth. A shallow weak area would necessarily support a lesser weight of soil above it, decreasing the resistance of all supported layers to lateral displacement, by reducing the force normal to the weak layer.
2. Embankment variations in cross section. Again, lower volumetric cross sections would exert less normal force (weight) on the standard layer/weak layer interface, and therefore allow less resistance to lateral displacement.
3. Percolation, seepage, and liquid entrainment in the weak layer and surrounding layers. As the water levels in the canal increased, pore pressure in the surrounding soils increased, almost certainly increasing percolation and entrainment. A saturated soil layer would have a net bouyant effect on anything immersed or supported by that layer. Percoaltion could also displace soil at critical locations, resulting in subsidence and loss of coherent structure in both supporting and supported layers. Transport of clay or slurry into or along the slipping interface between the weak layer and the displaced layers would further reduce resistence to lateral displacement.
4. Static and dynamic hydraulic forces. All three I-Wall failures occurred in close proximity to roadway bridges over the canals. Of these, the 17th Canal breach and the northern London Canal breach occurred just south of the roadway bridges, "downstream" to the flow of surge south from Lake Pontchartrain. The southern London Canal breach occurred just upstream from the bridge. Turbulence, standing waves, increasing or decreasing flow rates, helical flow regimes or standing vortices, all a potential result of bridge abutments, abutment foundations, piers, or pier foundations could contribute to localized variations, both static and dynamic with respect to time, in the hydraulic pressure exerted on certain sections of the I-wall system.
Regardless of what contributory factors led to the localized breaches, the breaches did in fact occur, setting in motion a precise chain of events culminating in the situational evidence available today. As the hydraulic pressure approached and then exceeded the levee section's ability to resist lateral displacement, the I-wall and embankment began to slide backwards, at first as a complete unit. Very soon there-after, however, the joints between the capwall's monolithic concrete sections came into tension as the no longer straight capwall attempted to lengthen to accomodate the new non-linear path. While these joints in many cases did not immediately fail, they also did not retain their watertight integrity, as evidenced in the post storm images above, allowing surge to flow in between capwall monoliths, eroding and scouring localized segments of the levee embankment.
With the full depth of the water's force applied to the capwall and sheet-piling, and only a partial depth of the force applied to the unprotected side of the levee embankment, in many instances the sheet-piling, capwall monoliths, and protected side of the embankment continued to be displaced, further and further from their original positions, leaving the outer embankment behind, in some cases all the way back in its pre-storm original position.
As the canal side of the embankment separated from the sheetpilings, the sheet pilings lost a great deal of support, allowing them greater latitude to deform and/or to lean backwards. Whether the sheet-pilings and capwall monoliths parted company at this point is immaterial, once freed of the embankment they rotated flat so as to offer the least resistence to the now flowing surge water, much as the links of a chain will orient themselves in accordance with a similar viscuous flow, stretching and in some cases rupturing the link mechanisms between capwall monoliths (sections). In many respects, the capwalls offered us valuable assistence. Although the breaching was now structurally complete, the flattened capwall monoliths offered some protection to the rear embankment, preserving the evidence for us to analyse after the floodwaters receeded, much as a rip-rap facing protects a surviving levee embankment from flow, scouring, and direct immersion.
The flooding of the New Orleans downtown area originated from five major breaches, two in the Industrial Canal area, two along the London Canal, and one along the 17th Street Canal. The low lying sections of the urban area filled first, then became conduits for floodwaters to reach areas of higher elevation. The flooding seems to have stopped at the 3.0 to 3.5 foot ASL mark. Shortly after Katrina's passage, water levels in Lake Pontchartrain were measured at 5.5 feet ASL and dropping. Due to the relatively small area of the breaches and the large area of the city below sea level, the levels did not equalize until the Lake levels had dropped to between 3 and 3.5 feet ASL. The image below indicates the sources and directions of the major flooding sequences. Note that the ridge from Metairie extending west and south prevented floodwaters from levee breaches from reaching the Kenner and surrounding areas. The flooding in those areas was entirely due to failed, deliberately shut down, or overloaded pump stations in Jefferson Parish.
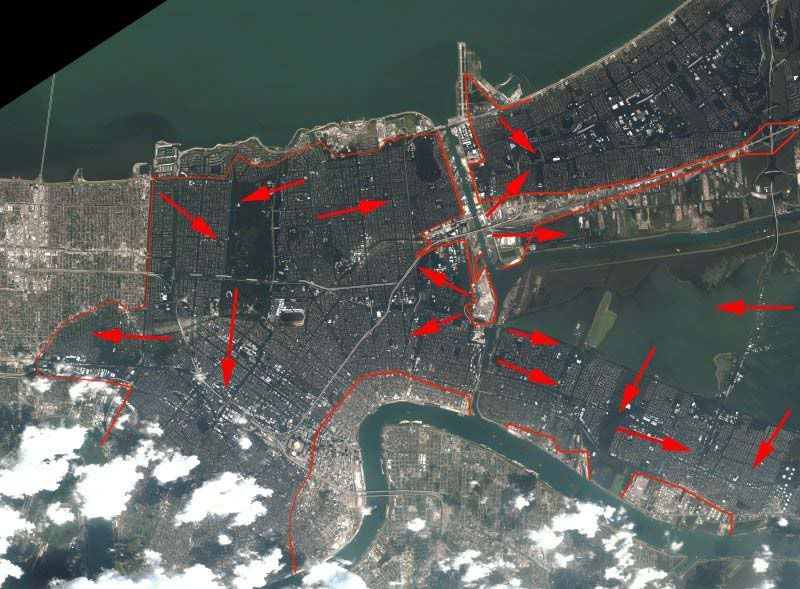
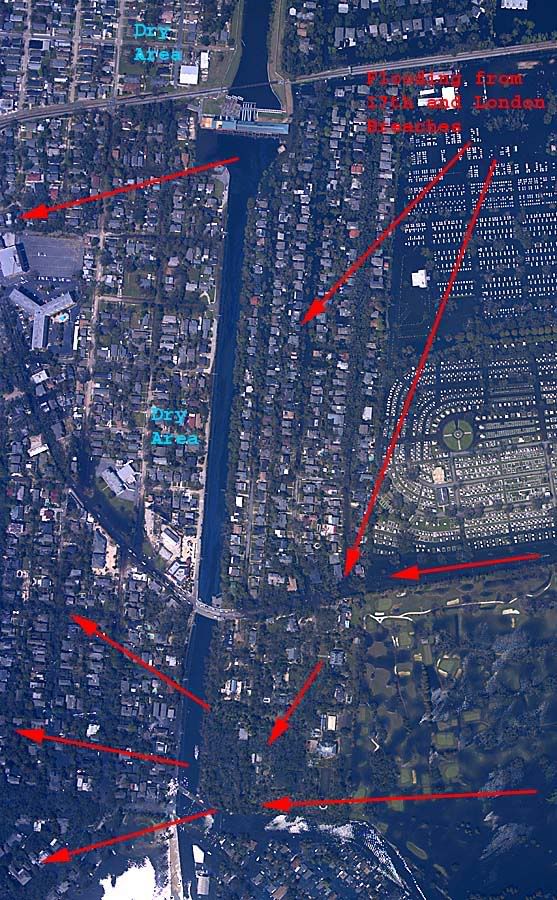
There were many media and anecdotal reports of a second breach along the 17th Street Canal, which led to the Metairie flooding south of Airline Drive. The best data available does not support these claims. Instead, as the flood levels from the previously discussed breaches deepened, eventually the water level topped the lower, inland canal walls south of the 17th Street Canal pumping station, on both sides of the canal, and flowed west from there, as evidenced in the image below.
Prior to Katrina's arrival, counter-clockwise winds along the northern and western reaches of the storm caused a surge along Lake Pontchartrain's southern shore. While some have debated the maximum depth of this surge, which was equaled in the connected 17th Street and London canals, the available evidence clearly shows that the Lake Pontchartrain levees were topped by storm surge or prolonged wave action.
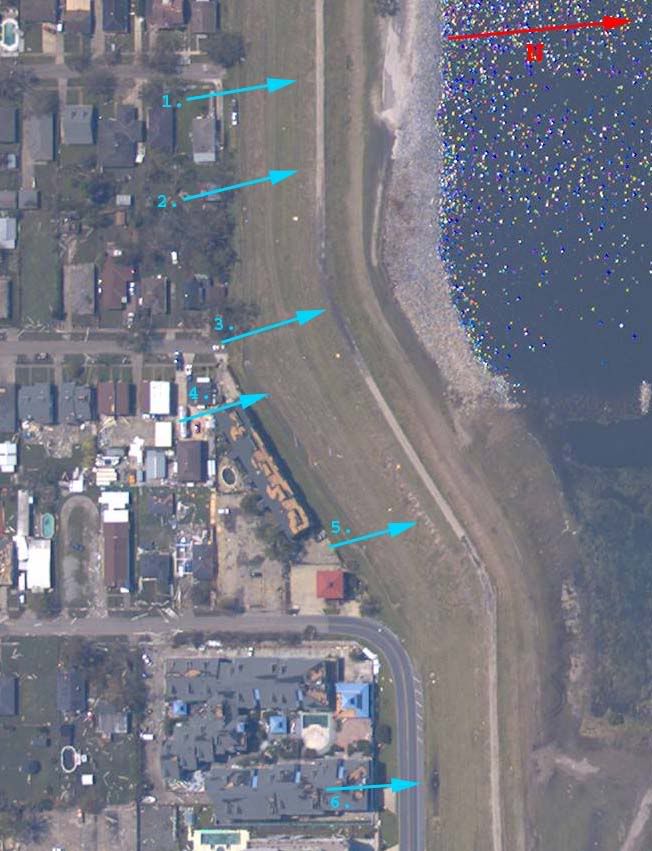
The above image clearly indicates topping of the Lake Pontchartrain levee immediately west of the 17th Street Canal outlet. Arrows at 1, 2, 4, and 5, point out evidence of fill transport, scouring, and topping at all elevations of the protected inner face of the embankment, base to crown. The dark area indicated by arrow 3 shows ponding still evident along the bike path atop the levee, and arrow 6 denotes ponding still evident along the inner base of the levee embankment. Per CoE documents, this section of the Lake Pontchartrain levee stands 14.5 feet ASL.
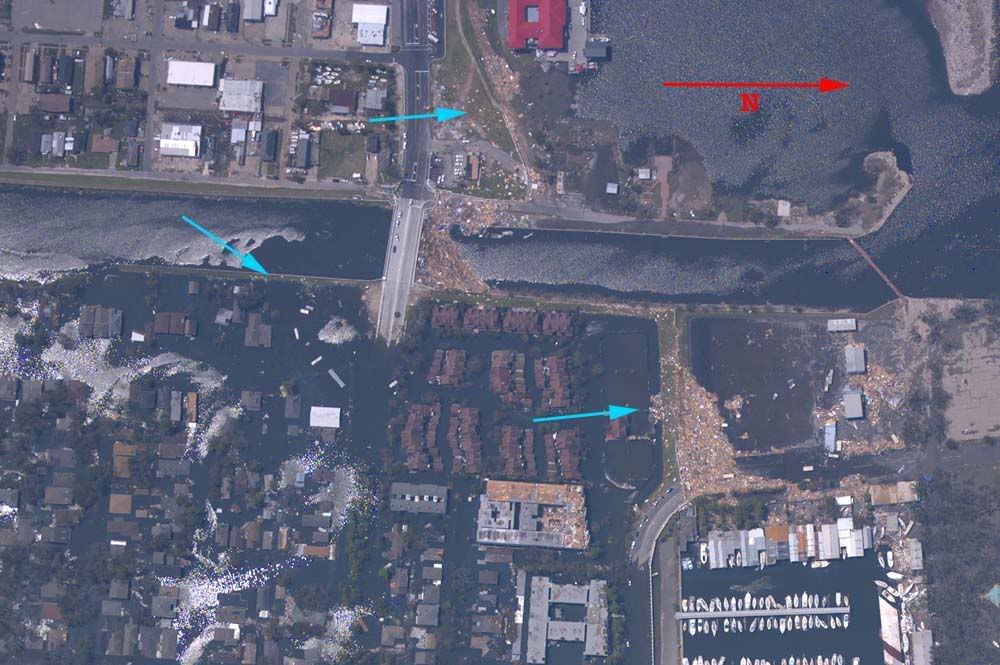
The above image clearly indicates topping of the Lake Pontchartrain levee immediately east of the 17th Street Canal outlet. The 17th Street Canal breach is shown at left center of the image. The blue arrows indicate locations where surge transported significant quantities of storm debris over the Lake levee's crown to deposit it on and below the levee's inner face. Per CoE documents, this section of the Lake Pontchartrain levee stands 13.5 feet ASL.
The above image clearly indicates topping of the Lake Pontchartrain levee immediately west of the London Canal outlet. The arrow at 1 indicates large trees transported by the surge over the crown of the levee embankment. The arrow at 2 indicates surge transported debris from the structure at right center to its present location, inside the protective embankment. The other arrows indicate fill transport and scouring along the inner face of the levee embankment. Per CoE documents, this section of the Lake Pontchartrain levee stands 17.5 feet ASL.
With both the London and 17th Street Canal outlets fully open to Lake Pontchartrain, demonstrated surge levels ranging from 13.5 to 17.5 feet above sea level would also have topped the 13.5 foot ASL Canal I-Walls. The city of New Orleans and the State of Louisiana, along with considerable federal funding, paid for storm surge protection to 11.5 feet ASL.
"The New Orleans area's last line of defense against hurricane flooding is a 475-mile-long system of levees, locks, sea walls and floodgates averaging about 16 feet high. The Army Corps of Engineers says the system will protect the city and suburbs from a Category 3 hurricane that pushes in enough seawater to raise Lake Pontchartrain 11.5 feet above sea level -- high over the head of anyone standing on the other side of a levee."
Source
The city received protection to levels of 13.5 to 17.5 feet ASL in the vast majority of locations, two to six feet above what was paid for, yet three locations unfortunately did fail under the impact of surge well in excess of the pre-approved design specifications, and allowed the city to flood. Although additional design considerations might have protected the entire I-wall system to Katrina's fury, and allowed the downtown area to escape the resulting devastating post storm flood damage, this must be attributed to an act of nature rather than a design or construction failure. New Orleans got all it paid for in I-walls, and then some.
3
posted on
11/07/2005 8:56:27 PM PST
by
jeffers
To: jeffers
Section 3. Surge Sequence for the Industrial Canal Basin, Analysis of the Five Major Breaches and east Orleans Parish Flooding
Subsection A - Storm Overview and Intercoastal Waterway Surge
Subsection B - Pre-conditions and Initial Industrial Canal Main Basin Surge
Subsection C - Topping and Breaching in the Industrial Canal and Related Ancilliary Basins
Subsection A-1. Storm Overview
In a timeline perspective, subsequent to the Kenner area pre-Katrina flooding, the next significant events to occur took place in the Industrial Canal area, immediately east of downtown New Orleans, west of the Ninth Ward (and St. Bernards Parish), and west of east Orleans Parish. Because all of these events and failures were interrelated, this analysis presents them as part of a unified sequence rather than isolated events.
Before proceeding to data and analysis, it is helpful to understand certain factors of the storm's large scale geometry, and how this geometry interacted with natural and manmade landforms in its path.
Prior to and during Katrina's arrival near New Orleans, the storm was moving almost due north, specifically, 357.2 degrees magnetic, based on the National Hurricane Center plots at 0709 and 1000 CDT. The inner radius of Katrina's eyewall was estimated to be 20 miles, with the strongest winds estimated to occupy an annular (doughnut shaped) area extending 10 additional miles from the inner eyewall. The now famous "jog to the east" which allowed New Orleans to "dodge a bullet" began sometime between 0200 CDT and 0323 CDT based on the respective NHC plots for those times. This had the effect of displacing the storm's circulation center 2.58 miles to the east.
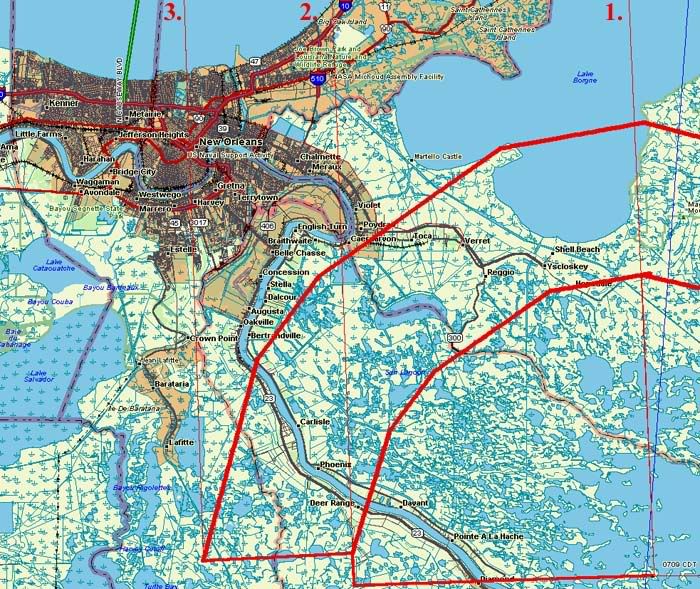
As shown, the inner eyewall passed roughly 3 miles east of Chalmette, and the outer eyewall passed directly over the Super Dome in downtown New Orleans.
Though early post storm media reports that New Orleans had "dodged a bullet" were completely inaccurate on the basis with which they were presented, New Orleans did in fact, dodge the bullet, a potentially fatal one.
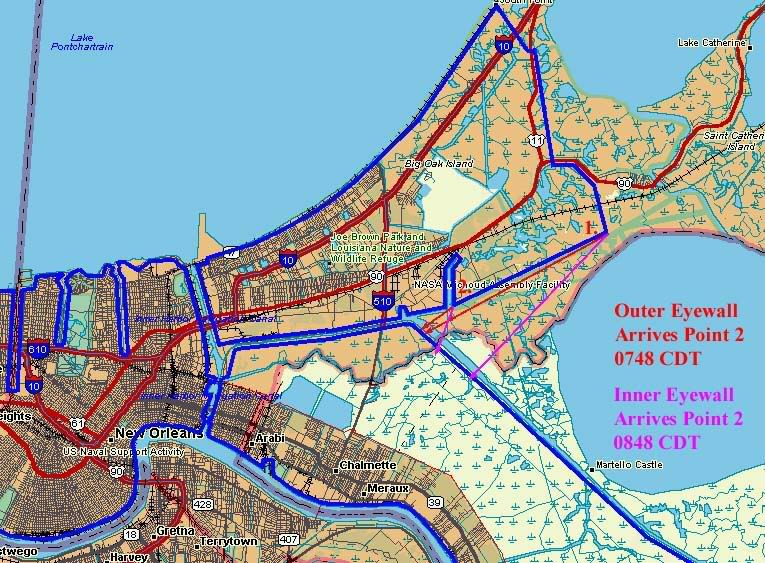
The above image is a subset of the previous one, and it outlines the hurricane protection levee system for the greater New Orleans metropolitan area, with two critical points indicated at numbers 1 and 2. Assuming that the winds at the outer eyewall were tangential to the eyewall's circumference, the wind directions associated with the eyewall's arrival are denoted by the respective red arrows at these two points. Due to the decreasing radius of the storm relative distance as the storm's center passed east of New Orleans, the wind direction changed as the storm passed, with the violet arrows denoting the wind direction as the inner eyewall transited the two critical points.
Subsection A-2. Intercoastal Waterway Surge 0730 - 0815 CDT
As shown in the above image, that reach of the levee system between points 1 and 2 acted as a protective barrier to the eastern mouth of the Intercoastal Waterway because the wind direction was unable to push Gulf water directly into the Intercoastal Waterway and thence, into the Industrial Canal basin. Instead, the Intercoastal Canal was subject to a secondary effect which greatly reduced the resultant flooding. Instead of pushing water directly into the canal, the wind's direction at all points in time during eyewall passage built up a surge effect against the St Bernards north east levee reach. Blocked by that levee, the surge then was partially returned (flow in the opposite direction of then current winds) by subsurface currents, and partially spilled sideways to the wind, meaning that a much smaller portion of the surge entered the Intercoastal Waterway Canal.
Had hurricane Katrina followed a track even as little as 5 miles west of its actual path, the reach of levee between points 1 and 2 on the earlier image, instead of serving as a protective barrier, would have acted to funnel storm surge from an area of Lake Borgne as wide as ten miles, into the 2000 foot wide Intercoastal Waterway, with unthinkable results. In addition to causing catastrophic damage to the levee system (and therefore to those areas these levees protect) all along the Intercoastal Waterway, a wall of water would have roared into the Industrial Canal basin, overwhelming levees on all sides, and then proceeding with the full force of wind driven surge into the heart of downtown New Orleans. Although it is difficult to make accurate estimates of the resulting effects, speculation cannot help but raise the possibility that significant portions of the high rise buildings in the downtown area could have been at risk of total structural failure, along with, and in addition to any and all smaller structures. In such an event, receeding floodwaters may have revealed no trace of the city which once stood there, the debris having been carried off to other locations, as documented for large areas of Galveston, Texas after the great 1900 storm. Even though New Orleans avoided this fate, the actual events proved more than destructive enough, as will be demonstrated very shortly.
Shortly after Katrina's passage, scientists from LSU, Notre Dame, and other facilities made public results from super-computer surge estimates, which may indicate higher surge levels and a greater funneling effect than what actually took place.
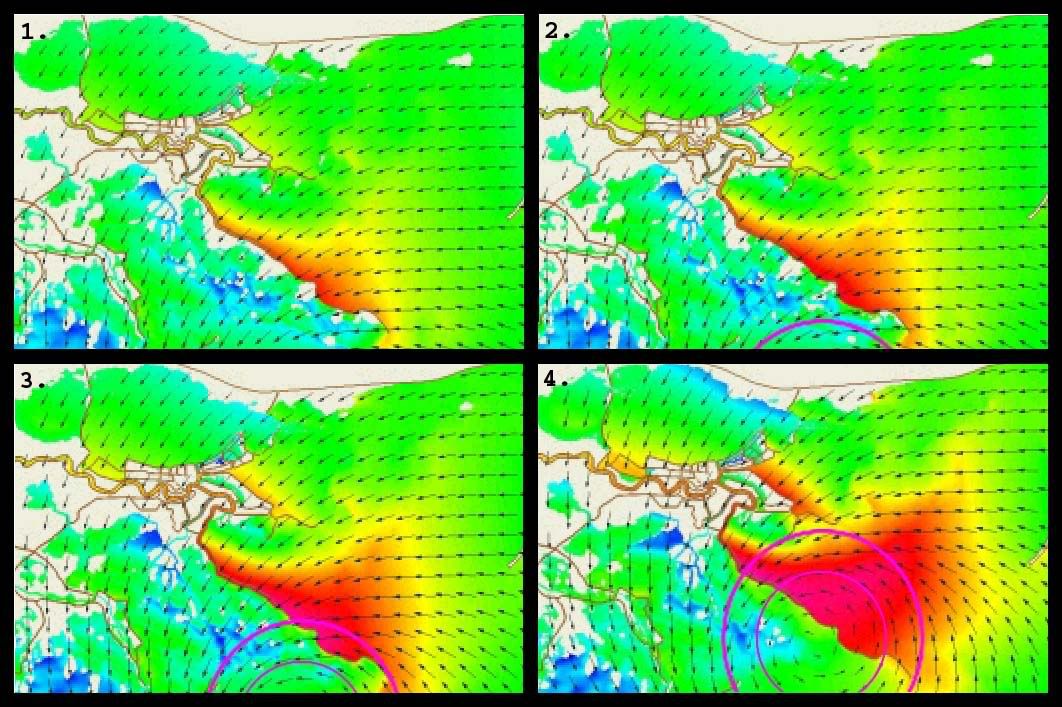
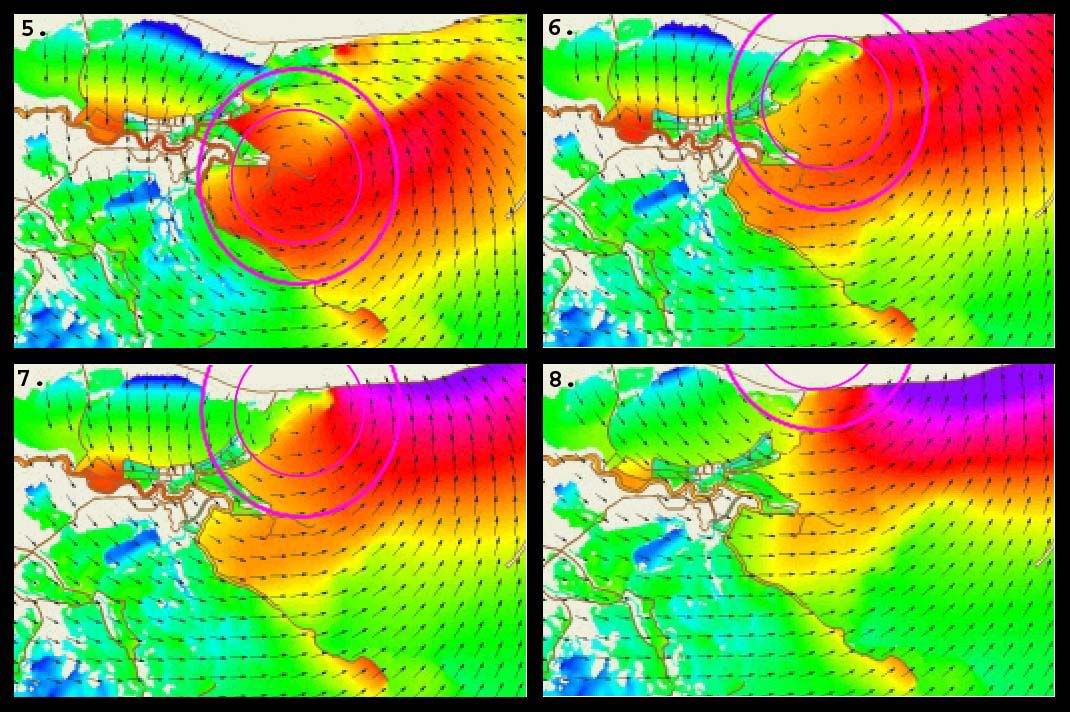
The above images are reproduced from the animated output of LSU's ADCIRC run simulating Katrina's storm surge as modelled by super-computer. For illustration, a scale representation of an eyewall with inner radius of 20 statute miles and outer radius of 30 statute miles has been overlaid where appropriate.
In panes 1, 2, and 3 of the first image, minor surge effects gather in the Borgne Lake basin, due to winds roughly perpendicular to the eastern reach of the Primary Protection Levee of St. Bernards Parish. The southeastern reach of the east Orleans levee is protecting the MRGO (Mississippi River Gulf Outlet)/Intercoastal Waterway junction from funneling effects, as discussed earlier.
In pane 4 of the first image, the surge begins to accumulate to deeper levels over time and with the approach of stronger winds nearer the eyewall. The wind direction is still perpendicular to the MRGO, and the east Orleans levee is still protecting the junction from direct surge effect.
In pane 5 of the second image, the surge projection indicates that significant funneling is underway, a projection not substantiated by empirical data available after the storm. Ths appears to be from secondary effects as outlined below. One, the general trend over time as the storm's center approaches is for surge to accumulate in the Lake Boegne Basin. Two, tangential winds due north of Katrina's center are shown driving still more surge into Lake Borgne, pushing that surge already accumulated in Lake Borgne deeper into the Intercoastal Waterway, and this is where the model begins to diverge from reality. The model isn't "wrong" per se, any error is a matter of degree, not occurence.
While the ADCIRC code is generally reputed to represent the best available simulation software, it can only be as accurate as the components used to support it allow it to be. The primary supporting algorithms and data come from two other sources.
One:
The grid/topography/bathymetry that was used in the simulation was the S08 model run with the ADCIRC code. The S08 model was developed for the U.S. Army Corps of Engineers New Orleans District.
and two:
Atmospheric wind and pressure fields were generated with a U.S. Army Corps of Engineers version of Vince Cardone’s PBL Hurricane Simulator using 1.5 hourly interpolated track and storm information from NWS/NOAA and posted by Unisys at http://weather.unisys.com/hurricane/atlantic/2005/KATRINA/track.dat
ADCIRC/Katrina Source Information
Of these two supporting models, it is most likely that the windfield simulation generated output that to a certain degree, did not match reality well enough to account for the empirical evidence available only much later. Katrina was undergoing an eyewall replacement cycle as it came ashore, and the windfelds just inside the inner eyewall as represented in the model do not match well with anecdotal reports from persons who experienced passage of that eyewall over Poydras, south east of Chalmette, in St Bernards Parish. In the model the windfield continues inside the inner eyewall, ramping down in velocity slower than witnesses report. This would not be unexpected if the windfield modelling software was not perfectly aligned in tracking the vagaries of the eyewall replacement cycle. However, a calmer than depicted windfield within the inner eye would have significant effect on the surge model, especially in the secondary funneling effects under current discussion.
Looking closely at pane 5 in the second image, we see that a large percentage of the windfield driving surge directly west into Lake Borgne lies inside the eyewall. If the windfield simulation miscalculated velocity magnitudes in this area, if actual realtime velocities were lower than those modelled, much of the funneling effect depicted by the ADCIRC model would not have actually taken place.
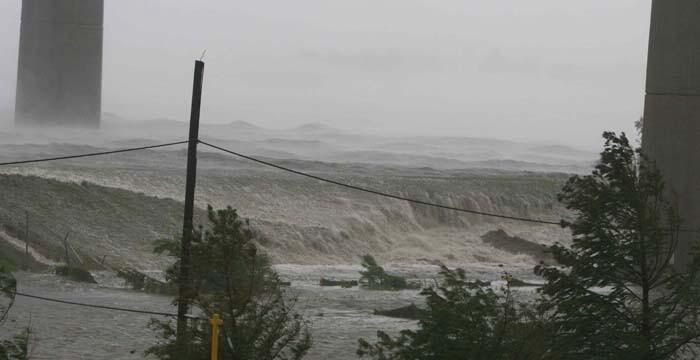
This means that at any given time, the maximum flow of water into the Industrial Canal basin was limited to the width of the Intercoastal Waterway, and by the heigth of those levees, generally 14 feet ASL. This is also corroborated by the image below, showing less than one foot of water spilling over the northern levee of the Intercoastal Waterway beneath the Paris Road bridge, a result of a storm driven wave, not general surge levels. The average water levels on the unprotected (Canal) side of the levee appear to be 2 to 3 feet below the levee, or at about 15 feet ASL.
 Subsection B - Industrial Canal Main Basin Surge 0745 - 0845 CDT
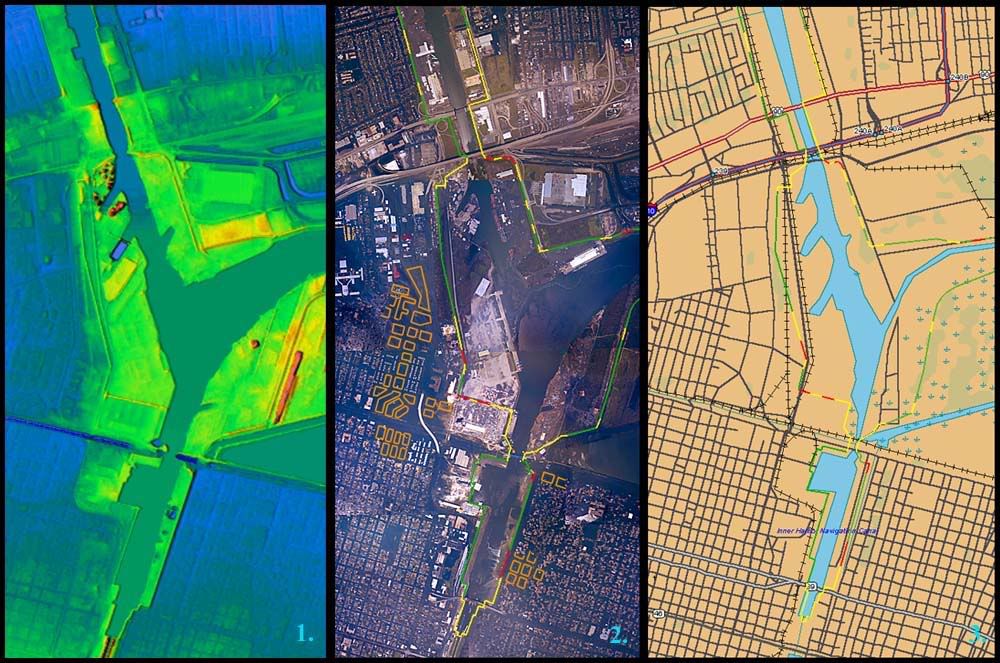
The image above is comprised of three main elements. Pane 1, at left, is rendered from a 3 meter per pixel National Elevation Database Digital Elevation Model (NED DEM). Pane 2, center, is a mosaic of 11 high resolution (4096 x 4096 pixels each) aerial photographs taken by NOAA shortly after the storm. Overlaid is a graphic representation of the Hurricane Protection Levee System, with sections that survived Katrina visibly intact displayed in green, levee sections which show visible evidence of being overtopped by storm surge displayed in yellow, and visibly breached sections displayed in red. The orange polygons indicate city blocks of structures shown by the DEM rendering, which have been erased by the storm, levee breaches, and subsequent flooding. This substantiates flood flow direction and sequencing, and also allows the viewer to evaluate for themself the validity of claims that the storm or political influences showed preference for any specific area. Pane 3 is a streetmap of the area, with the Hurricane Protection Levee System again overlaid using the same color coding system as Pane 2.
The earlier section which discussed storm geometry left off with a 14 foot surge proceeding west along the Intercoastal Waterway, towards the Industrial Canal, which runs generally north-south. The Intercoastal Waterway being a straight run between levees of generally similar distances apart, which imparted little in the way of dynamics or additional physical factors to the approaching storm surge, we now pick up the sequence as this water arrives at the western end of the Intercoastal Waterway and begins spilling into the Industrial Canal Basin.
Had this surge arrived as a wall of water entering the Industrial Canal Basin, the damage would have been catastrophic to all surrounding areas. Water weighs roughly 7.5 pounds per gallon, close to 70 pounds per cubic foot, and the cross section of the Intercoastal Waterway runs roughly 2000 feet wide. With a head of 14 feet ASL, such a flood translates to a mass on the order of roughly 1000 tons for just the leading one foot thickness. With the weight of the water extending behind the head of the flood 6.13 miles to the east entrance of the Intercoastal Waterway, the total mass involved rises to 31,719,072 tons. Had this flood arrived as a wall of water, much of downtown New Orleans would no longer exist. The damage that demonstrably did result, however, indicates that this flood arrived faster than a slow rise, perhaps what a beach tide might exhibit, but we currently do not have any way to estimate the slope of the advancing face of the flood. Therefore we settle for describing it as something between a wall and a tide.
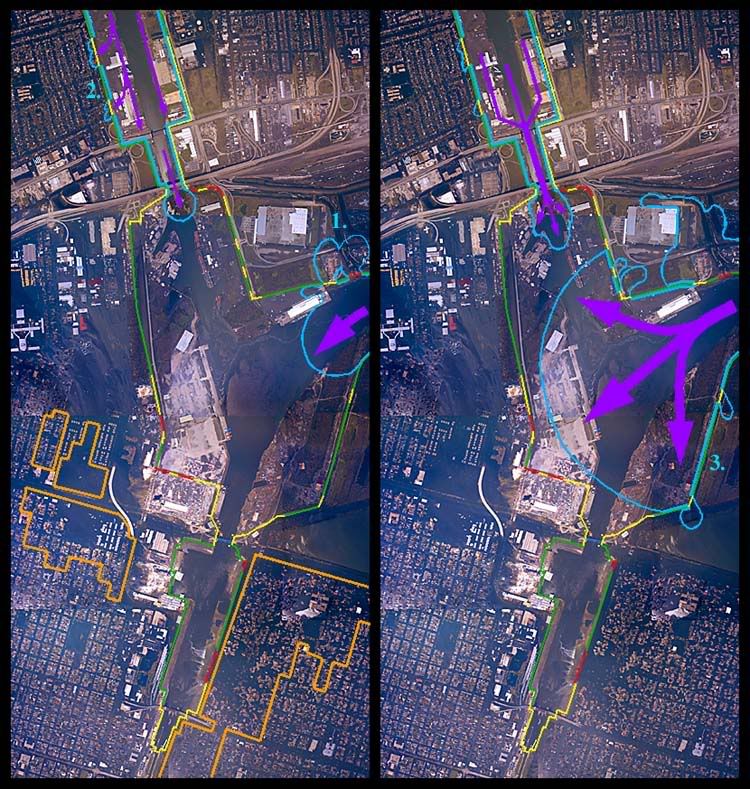
In Pane 1 (left) of the above image, the main surge from the Intercoastal Waterway is shown entering the Industrial Canal. A large white rectangular structure blocks some of its path along the northern flank and probably added to levee topping effect, a possible breach, and flooding indicated at point 1. It is unclear whether the red section of levee breached or was topped for a sustained period of time, but a significant amount of water entered the protected area here, enough to knock several railroad cars off their tracks and float Conex shipping containers several hundred yards from their original positions.
A combined effect of minimal surge well out ahead of Katrina, passing from the Gulf into Lake Pontchartrain, and Lake water driven southwest by winds on the far northwest quadrant of the storm, elevated Lake levels on the southern lakeshore, which then fed into the northern entrance of the Industrial Canal. On reaching the constriction formed by the abutments of the I-10 bridge (top center, Pane 1) this water began to back up, allowing minor topping to occur west of the Industrial Canal at location 2.
Possible standing waves created by the white rectangular structure, or causes unknown led to moderate levee topping north of location 3 in Pane two. A more serious topping occurred south of location 3 in the corner formed by the narrowing levee walls near the Florida Canal and Florida Canal bridge.
The main thrust of the surge, following the southwestward curving exit from the Intercoastal Waterway into the Industrial Canal moves towards the levee corner centered in Pane 2, setting the stage for the events depicted in Pane 3, below.
Floodwaters "clipping the corner" along the right flank of the main flow, northwest of the white rectangular structure topped, damaged, or destroyed a floodgate at this corner and soil transport from the overhead imagery indicates that minor flooding took place inside the protected area here.
Water continues spilling into the main Industrial Canal Basin from Lake Pontchartrain at reduced rates under the I-10 bridge.
Subsection C - Topping and Breaching in the Industrial Canal Main Basin 0755 - 0810 CDT
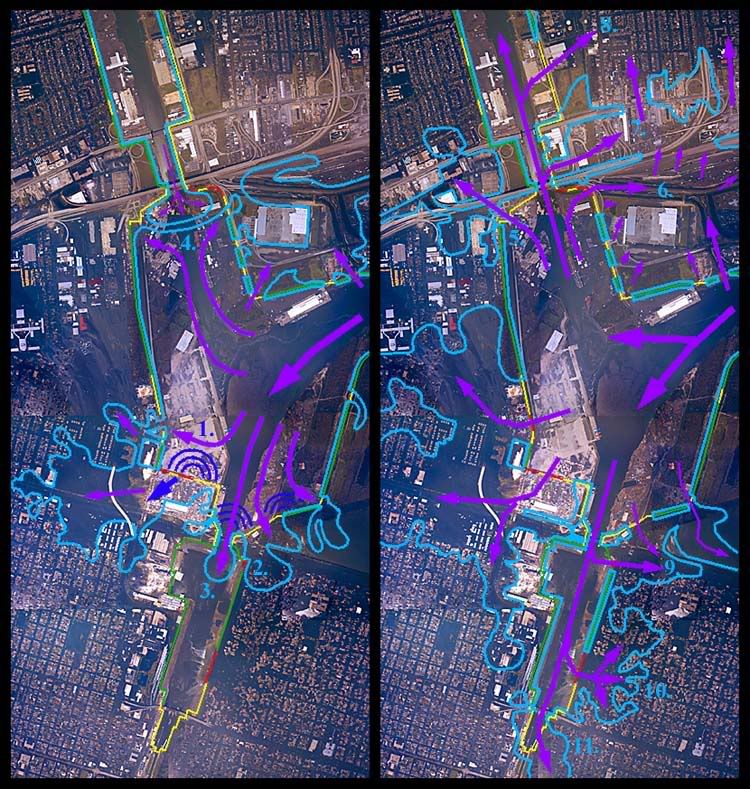
At this part of the sequence, events begin occurring rapidly. For simplicity, individual events are assigned a number and labelled below. Events 1 through 4 refer to depictions in Pane 3 (left) of the image above, and events 5 through 11 refer to depictions in Pane 4 of the above image.
1. As the large and rapidly spreading "front" of the advancing surge expands into the Industrial Canal Basin, it encounters an obstacle which essentially comprises a wall blocking its path. Though not continuous, or fully closed, the tiny opening beneath the Florida Street Bridge may as well not exist for all the force it is able to dissipate in allowing a miniscule portion of the main surge to pass through, south towards the Industrial Canal Lock.
Liquids in general, and water specifically, do not compress, as anyone who's ever smacked the top of a pop bottle full of water can attest. (This is not a recommended experiment.) The force is transmitted at high speeds through the liquid and transferred to any bounding material at the periphery of the liquid. In the example of the pop bottle, the bottom glass can easily shatter outward with high velocity. From Einsteinian physics we know that the results are the same whether the hand is moving and impacts the bottle, or whether the bottle, and therefore the water in it, are moving and impact a human palm.
In the case of a walled and floored container, open at the top, such as a cakepan or the Industrial Canal main basin, an impact to the outside of the container will transmit shockwaves into the liquid inside, some of which travel towards the surface, where they dissipate on reaching and being transmitted into the atmosphere above the surface of the liquid. The "container" effect is less, because even though the liquid still cannot be compressed, energy can escape at the surface, but under the surface, the shock waves still propagate, and movement of these shockwaves towards the surface is inhibited and slowed by the weight of the water above the main lines of shockwave propagation. Again, the Einstein/Lorentz Transforms demonstrate that it makes no difference whether a moving seawall strikes a still body of water, or a moving wall of water strikes a rooted seawall, the energy transfer effects remain the same.
For these reasons, when the head of the floodwaters smacked into the rapidly constricting levees north of the Florida Canal bridge, two things happened simultaneously. One, a tremendous amount of force was transferred to these levees, and two, (Newton's equal and opposite reaction), a "hydrostatic shock wave" was reflected back into the water, propagating generally in reverse of the current flow. Examples of these shockwaves are depicted in Pane 3 by the sets of dark blue concentric arcs.
The primary repercussion of this series of collisions was for floodwaters to almost immediately top all involved sections of the levees in this area, noted at locations 1 and 2 in Pane 3. The tremendous forces imparted to the levee caused nearly instantaneous breaching as shown by the red lines near location 1, and it would not be surprising if onsite analysis provided evidence that these two breaches occurred explosively, with levee material being embedded in structures at some distance from their original locations.
There has been a single, uncorroborated report that a floodgate allowing railroad access through the levee system had been damaged two to three weeks prior to Katrina's arrival, and left open as a result. If this report turns out to be true, then there are three locations where this might have happened. The most likely location is in the corner currently under discussion. Possibility two is in the "clipped corner" near the white rectangular structure discussed in the last section, and possible location three is just south of the east abutment of the I-10 bridge.
The results of such a floodgate being left open at location 1 are both hugely significant, and at the same time, inconsequential. I do not believe that this corner of the levee system would have survived the surge in any event, possible floodgate open or not. However, the closeup aerial imagery clearly demonstrates that the force of the floodwaters entering this breach was of a magnitude sufficient to level large areas of manmade structures, numerous entire city blocks. Even a floodgate that held for a minute or two before failing, allowing water to flow over the levee system at first, rather than through, could have reduced the impact of the ensuing rapid flooding.
At nearly the same time as the levee breached and/or was topped, the reflected shockwaves were being driven nearly head-on into the continuing current flowing from the mouth of the Intercoastal Waterway. This diverted enough of the current to the west as to cause breaching and scouring along the western reaches of the levee corner.
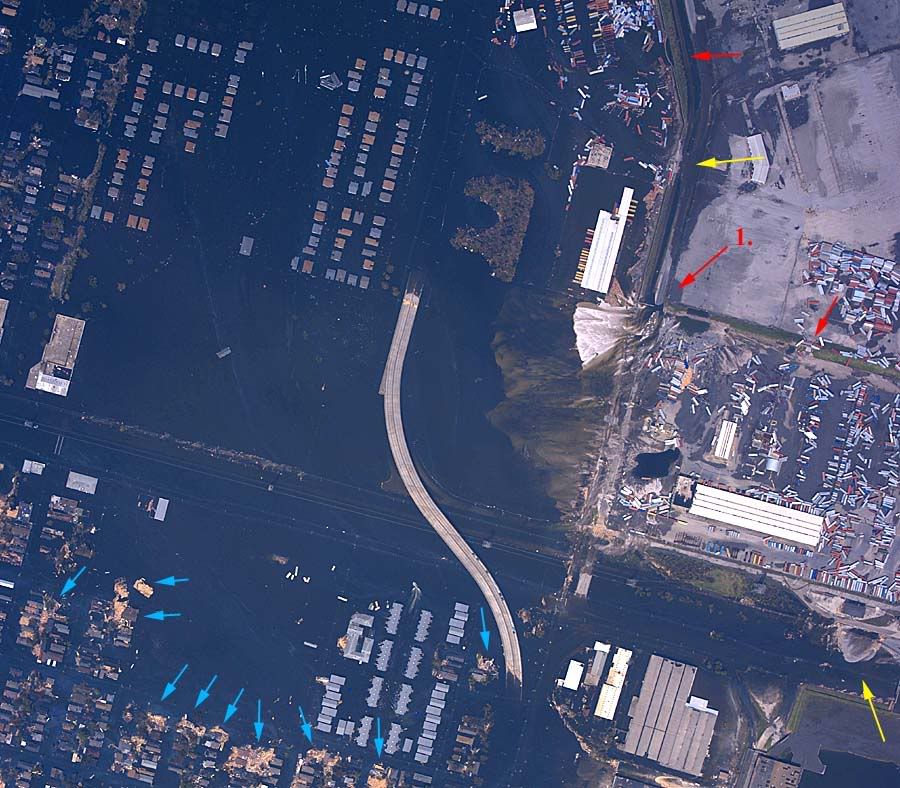
In the image above, the possibly open floodgate and certain corner breach is indicated by arrow 1. Two other breaches are indicated by the other red arrows, and significant scouring, topping, and subsequent flood flow damage effects are seen at the nearby yellow arrow. The yellow arrow in the lower right corner of the image points out another significant scour effect and soil transport from topping, which took place near a pumping facility there. Large quantities of wood frame structures destroyed or transported by the surge are indicated by blue arrows. One of the blue arrows points to a probable multi-unit residential structure transported nearly intact at least one city block in displacement. Behind it (downstream) is another probable multi-unit residential structure which is no more than 50% intact.
2. On the eastern side of the Industrial Canal near the Florida bridge (bottom center) the angle of the levee with respect to the primary current allowed that reach to largely survive, topped instead of breached. A significant quantity of water flowed into the protected area here, and close up inspections of the aerial images show scour marks and soil transport leading directly to the breach indicated near location 2 (Pane 3). It is highly likely that this breach actually occurred later in the sequence, but this scouring undoubtedly led to a weakened condition for the levee corner at this point, and probably was the deciding factor in that eventual breach.
3. In spite of reflected shockwaves and the constriction of the opposite side levees at the Florida bridge, quantities of surge water continued to flow into the next basin, adjacent to the Industrial Canal Lock.
4. 5. and 6.
At the northern end of the main Industrial Canal basin, the surge flowing north from the Intercoastal Waterway apparantly met a smaller surge flowing south from Lake Pontchartrain at location 4 in Pane 3. Three things most likely happened at this point, one, a standing wave of impressive proportions probably formed, (which no living human probably saw, and if he had, no-one would have believed him) before the much larger surge flowing north defeated the Lake surge flowing south, and two and three, substantial amounts of water were diverted left and right of the collision, as indicated at locations 5 and 6 of Pane 4. These lateral currents quickly impacted the levees on either side south of the I-10 bridge, with explosive or near explosive impacts (red arows on closeup image). To the west of the Industrial Canal, significant soil transport and scouring are evident, and this area probably would have breached except for the lucky fact that the levee here is part of the on/off ramp for the interstate exit, capped with pavement and much thicker in cross section than a typical earthen levee. East of the Industrial Canal, lateral flows did breach the levee in one location, and caused a near breach scour nearby (yellow arrows) that allowed large quantities of water into the protected areas. Near (slightly southeast) the numeral 6 in Pane 3, the floodwaters racing through this breach in a mostly easterly direction derailed 14 railway freight cars, with presumably 4 of them no longer in evidence in any imagery available (blue arrows on closeup image indicate derailed freight cars). Northeast of that location numerous Conex type railway containers were removed from their flatcars and transported east southeast into the scrub and woods there.
7. and 8. After passing northbound beneath the I-10 bridge, the surge waters topped levees east of the Industrial Canal, both north and south of the highway 90 bridge. Although no breaching is visible, scour patterns and soil transport indicate a considerable volume of water passed through this area. Between this flow and the flow through the breaches described in point six of this section, a significant percentage of the total east Orleans urban area flooding is probably accounted for. The remainder probably came through a topped floodgate/breach near the Lakeview Airport, with a possibly measurable amount coming over the Lake Pontchartrain levees along the northern extent of the Parish. It is possible that surge waters from other breaches east and south of east Orleans Parish contributed to the total, but the water in the urban areas seems to have risen slowly, as no scouring or soil transport is visible in the aerial images from the area. Therefore, precise analysis of the east Orleans Parish flooding sequence is not now, and may never be available.
9. A corner section of levee, probably severely undermined from surge that over topped a nearby earthen levee failed here, releasing water into New Orlean's 9th Ward. This may be the only true case of levee failure due to scouring at the base in the whole region affected by Katrina. Rebound from the northern lock gates may have been a contributory factor.
10. and 11. Three main factors involved here. One, rebounding shockwaves from the northern lock gate and associated levee reaches would have ramped up lateral loads on the failed section by an order of magnitude or more. Two, these sections probably suffered significant and prolonged topping. Some levee heigth maps show this area's levees to be only 13 feet ASL, while the main Industrial Canal Basin levees are 15 feet ASL. The earlier this section (10.) failed, the less that scouring was a contributing factor to the failure. The National Weather Service issued a flood warning containing the information that the levee was breached by a runaway barge at 0814 CDT, and all anecdotal accounts of flooding are referenced to times later than this. I've seen National Weather get tornado warnings out within a few minutes of receiving the information from the Skywarn network, so it is likely that this breach occurred between 0805 and 0810 CDT. That the first report available also includes information that the barge was at fault at the very least indicates that the barge couldn't have floated through the breach very long after it occurred, and indeed supports evidence that the barge itself was a major contributing factor to the breach. Exhaustive searching has failed to turn up any other barges of similar appearance in the Industrial Canal or Intercoastal Waterway, so attempting to find the pre-storm location of this barge's mooring or ownership has yet to yield results. Determining whether or not the barge caused the levee breach should be a simple matter to anyone with access to the site. Both the barge and the now exposed failed capwall sections should bear significant evidence to demonstrate any collisions which may have occurred.
The southern end of this basin, the lock gate, and the eastern wall of the lock itself suffered severe overtopping, with the resultant floodwaters exhibiting sufficient power to dislodge numerous residential and other structures from their foundations.
The water from the breaches referenced above, as well as the instances of topping probably were the main factors in the 9th Ward flooding, but probably not the main cause for flooding in Chalmette and Arabi. More detail on this subject in the St. Bernard section.
4
posted on
11/07/2005 8:57:33 PM PST
by
jeffers
To: jeffers
Section 4. Lower Ninth Ward and St. Bernard Parish Flood Sequence
Reference Map
Subsection A. Selected Anecdotal Reports
Subsection B. Indications of Scouring and Material Transport Direction
Subsection C. Flood Sequence in St. Bernards Parish
Subsection D. Causal Failure Analysis for the MRGO Primary Protection Reach
Reference Map
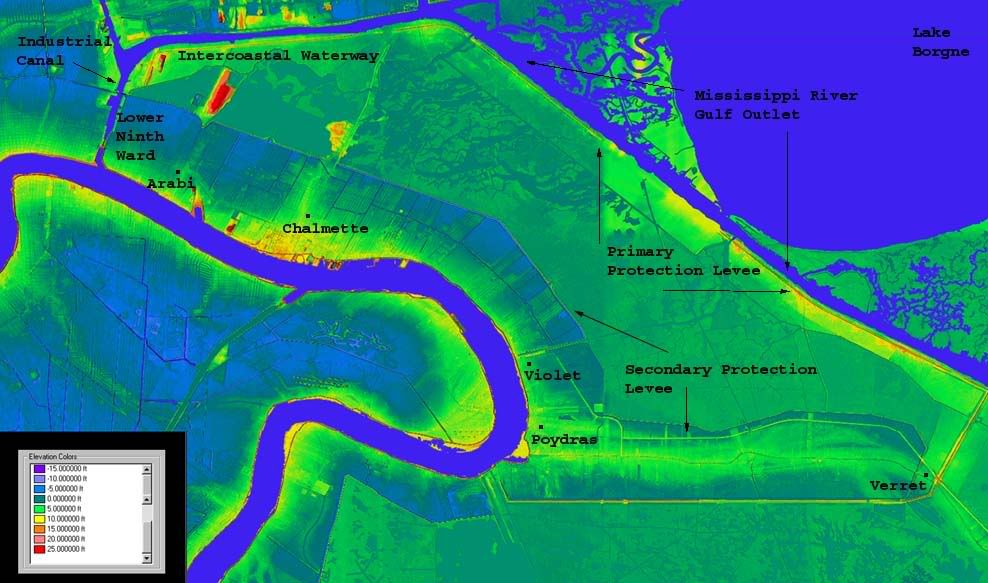
The above image is rendered from a 3 meter per pixel DEM, showing the St. Bernards (and Lower Ninth Ward) Hurricane Protection Levee system, with sea level artificially lowered to negative 15 feet in order to display the protected areas in their normally dry state.
This image is to serve as both a geographical reference point for the following discussion, and also as an elevation reference for future images used for correlation purposes.
Subsection A - Anecdotal Reports
St. Bernards Parish suffered not one flood but two.
Clearly, the first reports indicate that the Lower 9th Ward flooded first, with Arabi close behind. The National Weather Service Flood Warning resulting from the Industrial Canal breach at 0814, together with the following account, demonstrate this:
"Arabi resident Donald Bordelon told a Times-Picayune reporter via cell phone that at 8:30 a.m. there was just wind damage the homes on his block of Schnell Drive. But 40 minutes later, floodwaters had risen over the stove in his kitchen, as he scrambled to ready his boat for an evacuation."
http://www.nola.com/newslogs/breakingtp/index.ssf?/mtlogs/nola_Times-Picayune/archives/2005_08.html#074977
Given the time proximity of the NWS and Bordelon reports, along with the absence of early flooding reports from points east of Arabi, it is likely that floodwaters from the westernmost St Bernards breaches on the Industrial Canal reached Arabi much earlier than floodwaters from the eastern breaches along the MRGO.
From further south, and later, in Poydras, south of Violet, we get this report:
It was 11 a.m. on Monday Aug. 29, and the Campo men were in a celebratory mood. Katrina's eye and its vicious 145-mph winds had passed close to the area but they had come through unscathed in the house just 200 yards from the river levee. They really weren't surprised.
When I built my house, I chose that land in Poydras because everyone said it had never flooded there, ever; Kenny said. That's why we evacuated there. We had locked down grandpa's house, the hoist and the business on Sunday, our families had gone to Baton Rouge, and we'd come to my house because – like grandpa said – it never floods in Poydras.
And after the first part of Katrina passed, it still hadn't flooded.
With a new generator purring, the men watched the storm's progress on TV and were preparing to have some lunch. Kenny went outside bare-chested and bare-footed to pick up the few shingles blown off his roof. That's when he heard a peculiar hissing sound, and looked up the street.
Water was coming down the street, then from the other yards, then up the street, it was just pouring in from everywhere, he said. By the time I got back to the house, it was up to my knees.
His alarms dumbfounded his father and grandfather.
"Kenny comes in yelling, "We got to get out of here! We got to go!" and I didn't know what he was talking about," Ken Sr. said. "Then, the water started coming in the house.
The men ran to their two pickup trucks, Blackie joining Kenny in one, Ken Sr., in the other, and with the water rising fast made a hurried, fateful decision.
"As we're getting in the pickups, I'm thinking about where we should go",Ken recalled. At first I thought we should try to get to St. Bernard High School, then maybe the courthouse. But the levee was right there, so we just took off and drove up to the top of the levee.
Let me tell you, maybe 15 minutes had passed since Kenny saw that water until the time we got to the top of the levee, but by then there was seven feet of water in his house, and it was still rising. We were on the only high ground left. If we'd tried to go anywhere else, we would have all drowned.
They were safe, but only for the moment. Katrina's winds returned, blowing from the northwest with a vengeance."
http://www.macchuck.com/Katrina/stories/Campo.html
It's difficult to place much credibility in the time of day given with this report. For the southwest quadrant of Katrina's inner eyewall to have passed over Poydras at some time after 11 AM CDT, the inner eye would have had to have a diameter of 95 miles, since the reported location of the eye center at that time was slightly south of Picayune, Mississippi.
Katrina Track Timeline
It is possible that this is a time zone discrepancy, and that the time reference actually refers to 10 AM CDT. This would give an eyewall radius of 28 miles, and given the 1000 CDT position, much more in line with the estimated eyewall radius at landfall of 20 to 24 miles.
However, what is clear is that the flooding in Poydras occurred much later than that in Arabi, giving us a general direction and sequence of the flow pattern. These anecdotal reports, coupled with analysis from aerial imagery, allow a fairly detailed picture of the flood sequencing to emerge.
Subsection B. Indications of Scouring and Material Transport Direction

In the above image, each red arrow represents soil, vehicle, or structure displaced by moving water, visible from aerial photographs. This data leads to the following probable sequence of the St. Bernard Parish flooding.
Subsection C. Flood Sequence in St. Bernards Parish
1. 0730 - 0800 CDT: Levee sections all along the MRGO are topped, at first by localized waves, later perhaps more extensively, especially along sections subject to subsidence.
2. 0745 - 0830 CDT: A storm surge of approximately 15 to 18 feet is funnelled west along the Intercoastal Waterway, then north and south into the Industrial Canal. As it enters the Industrial Canal, the surge is probably not more than 14 feet, the excess having been bled off along the 14 foot levee south of the Intercoastal Waterway during transit.
3. 0800 - 1000 CDT: Storm surge begins breaching low sections along the MRGO, gradually filling the basin between the Primary and Secondary Protection levees. Paris Road, visible on the above image extending northeast of Chalmette to the Intercoastal Waterway forms a temporary protective barrier until the basin fills to a depth of about 5 feet ASL, at which point surge begins spilling over (initially at the northern end of the Paris road) into the basin north of Chalmette and south of the Intercoastal Waterway. This is augmented by minor topping of the Intercoastal Waterway's southern levee.
4. 0805 - 0810 CDT: Surge driven flow and possibly a loose barge breach two sections of the east levee of the Industrial Canal, spilling into the Lower Ninth Ward from the west. This flood fills the Ninth Ward, northern Arabi, and western Chalmette to depths of between 5 to 8 feet. The Paris Road ridge running north north east from Chalmette prevent most of this water from flooding areas further east.
5. 0930 - 1000 CDT: As the basin between the Primary and Secondary Protection levees fill to depths of between 6 and 8 feet ASL, large sections of the Secondary Protection levee are topped, and surge begins spilling into eastern Chalmette, Violet, Poydras, and northern Verret. At this time or slightly earlier, surge flowing west down the Violet Canal towards the Mississippi River tops and then breaches levees on both sides of the canal, spilling into areas north, east and south of Violet.
6. 0945 - 1030 CDT: As the basin from Chalmette south to the north bank of the Violet Canal fills to approximately 6 feet ASL, the Paris Road embankment is topped, and water begins flowing back into west Chalmette, Arabi, and the Lower Ninth Ward, slower this time because of the gradual addition of deeper flooding. There is variability in the exact timing and depths that the reversal in flow took place. Floodwaters from the Industrial Canal breaches probably reached heigths of 5 to 8 feet, and some flow over the Paris Road west to east occurred before the deepening water east of Chalmette outpaced this flow and reversed it. The relative absence of structures displaced by moving water around Chalmette indicate that the transition from eastward to westward flow was accomplished non-violently. During this same approximate period, water from the basins due north of Chalmette and Arabi began topping the Secondary Portection levee and into those towns respectively. Again, little structural damage from this flow is visible on the overhead images, except for those residences and buildings directly adjacent to the Secondary levee.
7. 1000 - 1100 CDT: As Katrina moved north, winds on the southwest quadrant gradually changed from southward, to southeast, eventually blowing directly towards the east as Katrina's now disintegrating center moved further and further away. At the point where the primary winds turned parallel to the Primary Protection levee along the MRGO, wind driven surge stopped entering the breaches there, and at the point when the surge levels in MRGO dropped below levels inside the protected (no longer) areas, water began flowing out of the breaches into the MRGO. Somewhere in this general time period, west moving floodwaters from Chalmette and Arabi reached the Industrial Canal breaches and water began flowing from the protected areas out into the Industrial Canal. At this point photographs show flood levels in the Ninth Ward at or very close to the tops of the levee, or 13 feet ASL. Because the Secondary Protection levee is only ten feet ASL near Arabi, dropping to 7.5 feet near Verret, as the water between the Primary and Secondary Protection levees flowed out the MRGO breaches, floodwaters in eastern Chalmette, Violet, Poydras and Verret reversed direction and began flowing over the Secondary Protection levee, causing significant scouring to the outside (unprotected) face, and possibly additional breaches, notably northwest of Verret and immediately south of the Violet Canal. Even several days later when the aerial photographs were taken, floodwaters inside the Secondary levee from Chalmette to Verret were still deeper than those outside, between the Primary and Secondary levees.
Subsection D. Causal Failure Analysis for the MRGO Primary Protection Levee
Of the easternmost sections or reaches of the St. Bernards Parish primary protection levee, 87.9 percent are within the aerial photography grid covered by the National Oceanographic and Atmospheric Administration shortly after the storm. Of the portion visible, 60.5 percent of the eastern reach is partially or totally destroyed.
Post storm analysis strongly suggests the causal factors behind these breaches, and further refines the failure mechanism. Portions of the levee embankment which underwent higher pre-storm subsidence rates than adjacent sections, failed, and portions of the levee embankment which sank more slowly than the surrounding areas survived the storm. This claim is not made lightly. Correspondence between the two factors averages 87.5% for the entire length of the levee embankment visible on the aerial photographs, with minimum correspondence of 70% and multiple areas with 100% correspondence between subsidence and failure, and further, also exhibiting 100% correspondence between low subsidence rates and levee survival.
In the images below, the following conventions are used. The upper pane is an extract from the relevent aerial photograph depicting that section of the levee, and the lower pane is rendered from 3 meter per pixel Digital Elevation Models with sea level artificially raised or lowered to approximate surge effects and to demonstrate the localized height differentials in the levee crown.
Black arrows indicate terrain feature location commonality between the two different types of imagery. Light blue arrows indicate areas which exhibited low rates of subsidence and survived the storm with minimal fill transport, cratering, or breaching. Red arrows indicate areas with high subsidence rates which significantly or completely failed during the storm. Green arrows, where they appear, indicate areas where the presence or absence of subsidence in the elevation models does not correspond to levee survival or failure visible in the aerial imagery.
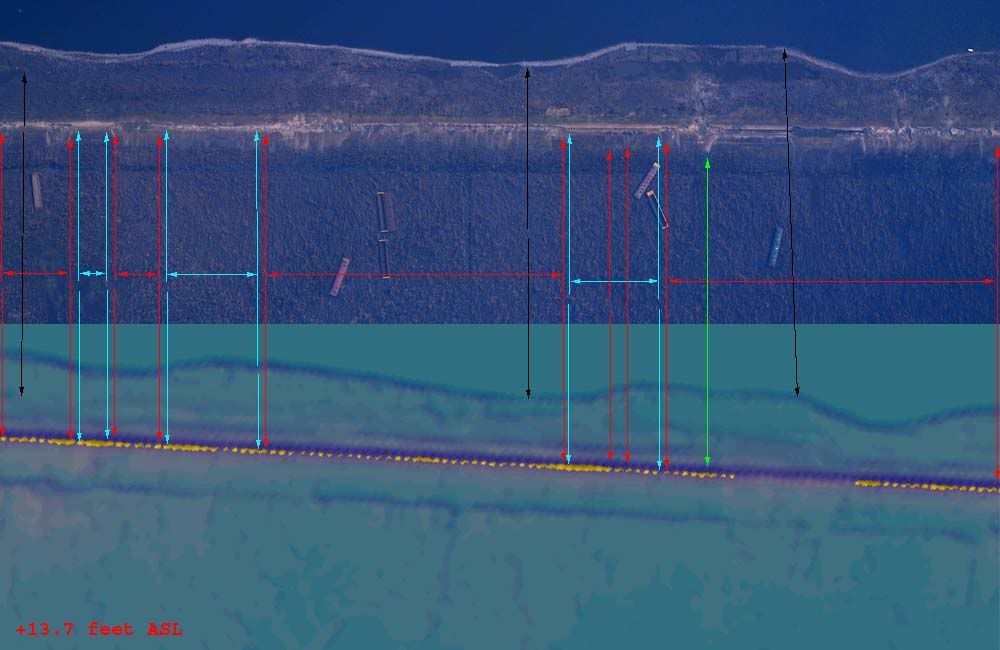
In the above image, sea level was artificially raised to 13.7 feet ASL before segments of the levee crown began disappearing below the water's "surface". Correspondence between subsidence and survival or failure is judged to exceed 90 percent. The green arrow indicates a full breach visible in the aerial photograph which corresponds with an area of low subsidence relative to the adjacent segments, but which also resides within a larger levee segment almost totally destroyed during the storm. While technically refuting the proposed subsidence/survival correlation, this is probably a case where subsidence related failure on either side of the breach led to localized isolation of that segment, with surge flowing into protected areas on both sides of it, inducing failure at a later point in time. Correspondence between pre-storm subsidence and levee survival or failure elsewhere within the image is judged at 100 percent.
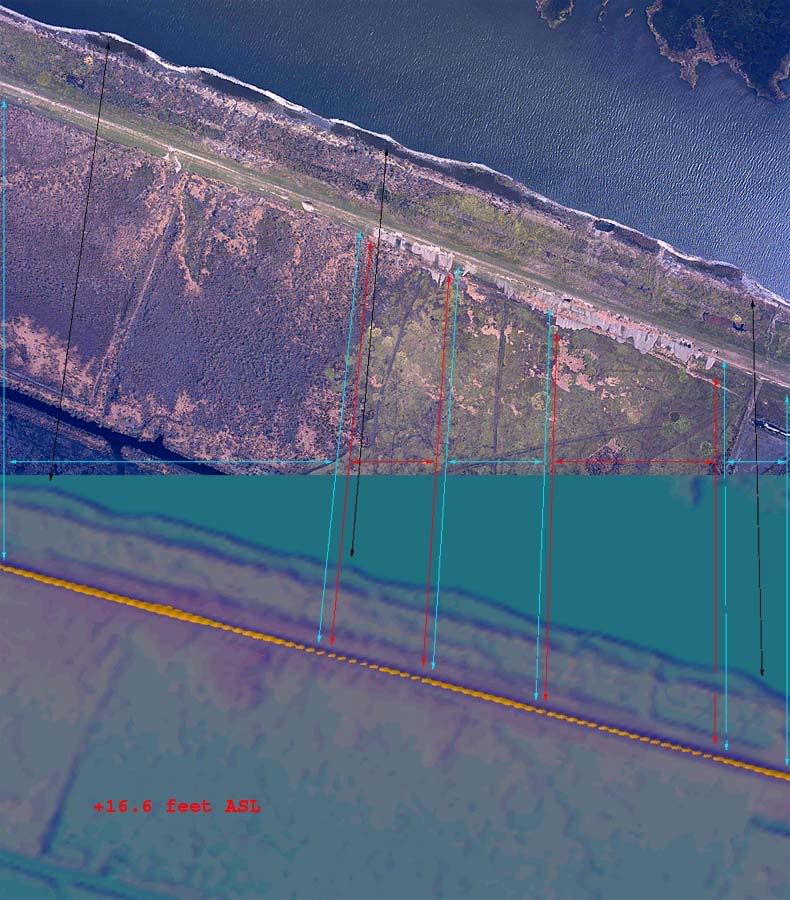
In this image, sea level has been artificially raised to 16.6 feet ASL, and correspondence between pre-storm subsidence and levee survival or failure is judged at 100 percent.
The following images are arranged in order of descending correspondence between pre-storm subsidence and levee survival or failure, and are made available as links instead of being displayed here in order to reduce bandwidth requirements and page load times. Image 6 never existed, image 7 is physically adjacent to image 5 within constraints imposed by data availability, a previous numbering scheme was maintained to preserve file system cross references, and therefore, no link to Image 6 is presented.
Correlation 8
Artificial surge level at 16.3 feet ASL, correspondence between pre-storm subsidence and levee survival or failure judged to be at 100 percent.
Correlation 7
Artificial surge level at 16.1 feet ASL, correspondence between pre-storm subsidence and levee survival or failure judged to be at 95+ percent.
Correlation 5
Artificial surge level at 14.5 feet ASL, correspondence between pre-storm subsidence and levee survival or failure judged to be at 90+ percent.
Correlation 3
Artificial surge level at 14.9 feet ASL, correspondence between pre-storm subsidence and levee survival or failure judged to be at 80 percent.
Correlation 2
Artificial surge level at 15.3 feet ASL, correspondence between pre-storm subsidence and levee survival or failure judged to be at 70 percent.
Correlation 1
Artificial surge level at 12.0 feet ASL, correspondence between pre-storm subsidence and levee survival or failure judged to be at 75 percent. The flowing breach immediately to the right (southeast) of the Bienvenue Bayou flood control gate structure was a deliberate breach per CoE sources.
With the correspondence between pre-storm subsidence and levee survival or failure firmly established, it becomes possible to investigate deeper into the precise failure mechanisms that led to the open breaching and cratering of the Primary Protection System.
It would be simple to conclude that the segments of the levee subject to the highest subsidence rates were topped by Katrina's storm surge, and that the topping scoured the embankments down to their post Katrina levels of survival. This conclusion, however, is not in accordance with the data available. Had Katrina's surge reached a maximum of only 12 feet ASL, then all sections of the levee other than those depicted in image 1 would not have been topped, would not have been scoured, would not have been breached, and the correspondence we see between pre-storm subsidence and levee survival and failure would not exist.
Had Katrina's surge reached 16.6 feet ASL, the level necessary to produce the 100 percent correspondence we see in many areas, between pre-storm subsidence and levee survival and failure, the entire eastern reach of the Primary Protection System would have been topped, all then subject to the same scouring, and the entire reach exhibiting total or near total breaching. Again, the correspondence we see between pre-storm subsidence and levee survival and failure would not exist.
Instead, we must reach for another failure mechanism, one which explains why segments of the levee which were subject to the highest rates of pre-Katrina subsidence were also most subject to full or partial breaching and cratering, independent of being topped. Two such mechanisms immediately come to mind.
One such mechanism deals with the quality of the soil upon which the levee rests. If the foundational soil layers beneath the Primary Protection System were not homogenous throughout the entire eastern reach, then some areas of these foundational layers would display differing qualities of soil cohesion, compressability, percolation and seepage, and shear strength. The levee segments resting on these weak areas of foundation soils would show a tendency to sink faster than areas resting on better foundation layers, and the weak foundation would allow percolation and seepage to undermine the structure above it, possibly leading to early failure.
The other failure mechanism deals with the stability and integrity of the levee embankment itself. During construction, design specifications clearly indicate the soils to be used in any levee layer, the thickness of each layer, and the methods necessary to compact each layer before adding additional material on top of that which has already been laid. Differential settlement rates along adjoining levee segments could impose significant stress to compacted fill layers, including shear, bending moment, and tension. This stress could disrupt each layer's cohesiveness and ability to resist lateral loads. In extreme cases, cracks could develop which could in turn allow percolation through the embankment, carrying away fill as surge flow through the cracks continued and increased.
The two most obvious failure mechanisms that correlate pre-storm subsidence and levee failure than, are foundational issues, and issues within the embankment itself. If foundation issues turn out to best represent the post storm data available, then both the subsidence and failures result from the same root cause. If, however, embankment cohesivness issues turns out to be the primary failure mechanism, then the subsidence created secondary effects, which in turn led to the breaching. This is a critical issue. If the foundation directly caused the breaches, then causality has to be traced back to the design criteria used, and the question asked whether the design performed as expected. If the subsidence and resultant cohesional losses caused the breaches, then the chain of causality can ignore design criteria, and concentrate of the levee maintenence procedures in use prior to Katrina's landfall. Is it possible to determine, with the evidence available, which of these mechanisms was the most likely culprit?
The answer is "yes", almost certainly.
If the storm surge's initial penetration occurred at the foundation layers of the embankment, then scouring and gravity would cause most, if not all breaches to be total ones, with the crown of the levee, all the way down to the embankment's base, dissolved in the surge flow and transported away from the site of the breach. Any partial breaches would take the form of tunnels, where the embankment's base was scoured away and the crown survived intact.
If the storm surge instead penetrated the levee through compacted soil layers disturbed through differential settlement, the breaching would have taken place from the crown of the levee downward. Partial breaches would take the form of notches cut into the levee crown, with the embankment's base surviving intact.
Analysis of the aerial photographs clearly shows which mechanism was the case. Combined aggregate analysis of all of the photographic evidence shows that Katrina removed and transported 60.5 percent of the lineal length of the east reach's crown, while removing and transporting only 6.1 percent of the embankment's base. At least 90 percent of the breaching that occurred, took place from the crown downward, and did not scour away the embankment all the way to the base. There is no visible evidence of tunneling in any of the available photographic data. Additionally, even that 6.1 percent of the eastern reach which was scoured down to the embankment's base is not proven to have occurred from the base upward. All we know is that these sections are missing, not whether the scouring began at the top or bottom. In light of the complete absence of tunneling, and the 90 percent of the breaching we know began at the crown of the levee, it is a safe assumption to conclude that all breaching began at the levee crown, and that none began at the base.
In arriving at the breakdown between partial and full breaching, each image was split into two parts, analyzed seperately, and averaged together to arrive at the sum totals. The breakdown is shown in the image below.
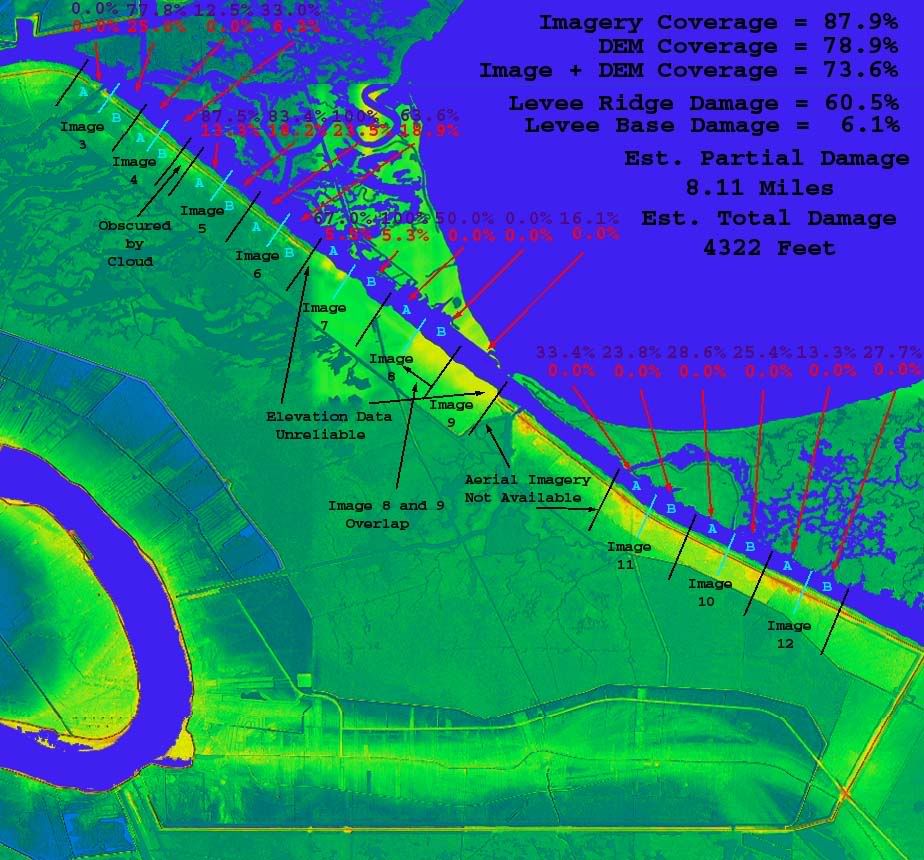
This image is rendered from a larger view of the same 3 meter per pixel DEMs used in the correlational analysis. The extent of each image is shown in black, the subsections used for closer inspection are shown in light blue, fill transport occurring at the crown only, as a percentage of total length is shown in violet, and fill transport where scouring cut all the way to the embankment's base, as a percentage of total length is shown in red.
The conclusion then is inescapable. Sections of the levee sank, after construction, a process known as subsidence, and accounted for in maintenence scheduling, disrupting compacted fill layers within the embankment, which then failed under the onslaught of Hurricane Katria's storm surge. The failures took place from the levee crown and proceeded downward, most affecting those areas which exhibited the most pre-storm subsidence, and the most affected layers were those which proportionally sank the furthest vertical distance, usually those layers nearest the embankment's crown. The primary culprit in this failure then becomes levee maintenence, not levee design criteria. Questions related to who was aware of the subsidence prior to hurricane Katrina, and what was done to mitigate this deterioration are addressed in the following section.
5
posted on
11/07/2005 9:00:28 PM PST
by
jeffers
To: jeffers
Section 5. Contributory Causality, Political and Funding Issues Leading to Levee Failures
The preceeding sections allow us to understand how the New Orleans levees failed, but not why they failed and allowed an entire American city to flood.
A brief history of the New Orleans levee system may be found here, and will allow the reader to understand the genesis and evolution of the levee system which failed during the passage of hurricane Katrina in August of 2005.
New Orleans Levee History
An understanding of the major players responsible for designing, funding, constructing, and maintaining the New Orleans levee system is also in order. They are:
1. The Louisiana District of the US Army Corps of Engineers
Their Mission Statement:
Our Mission
The New Orleans District, through partnering, provides for navigation, flood and hurricane protection, environmental stewardship, and other water resource needs to benefit the people of southern Louisiana and the nation.
From their "Who We Are" page:
"Responsibilities of the New Orleans District, U.S. Army Corps of Engineers, are almost entirely in civil works. Flood control, navigation and the environment are the big jobs. About 1,000 of our more than 1,300 employees are headquartered along the Mississippi River in the Uptown neighborhood of New Orleans. Our district covers 30,000 square miles of south Louisiana, from Alexandria to the Gulf. Our program for fiscal year 2005 is about $462 million through April, including $57 million of emergency supplemental appropriations." "Civil Works. We design, build and operate environmental projects, flood control reservoirs, levees and floodwalls, and navigation locks and dams." "We plan, engineer and design, and manage contractors for construction projects. We also operate and maintain many of our projects. Other projects are turned over to local sponsors for operation and maintenance. "
You can find their website with links to an array of information here:
CoE Homepage
2. The US Congress
Where the money comes from. The President proposes the budget, Congress either approves it or sends it back for changes.
3. The Orleans Levee Board
MISSION STATEMENT
The Orleans Levee District is dedicated to protecting the lives and property of the citizens of Orleans Parish by constructing, operating and maintaining the Mississippi River and Hurricane Protection Flood Control Systems and to providing safe and secure facilities for aviation, marine and recreational activities.
VISION
The Orleans Levee District is to be a proactive, public orientated, fiscally responsible, ethical and highly respected flood protection and service organization.
STATEMENT OF PURPOSE
The Orleans Levee District (the District) and its Board of Commissioners were established by Act 93 of the 1890 General Assembly (Legislature) of the State of Louisiana. The District is primarily responsible for the operation and maintenance of levees, embankments, seawalls, jetties, breakwaters, water basins, and other hurricane and flood protection improvements surrounding the City of New Orleans, including the southern shores of Lake Pontchartrain and along the Mississippi River. The District is responsible for the maintenance of 129 miles of levees and floodwalls, 189 floodgates, 97 flood valves, and two flood control structures. To enhance flood protection, the District, and the United States Corps of Engineers (USACE), participate and cost share in several joint flood protection projects relative to the Lake Pontchartrain and Vicinity Hurricane Protection Plan (LPVHPP). Act 292 of the 1928 Louisiana Legislature authorized the District to dedicate, construct, operate, and maintain public parks, beaches, marinas, aviation fields, and other like facilities.
Orleans Levee Board Homepage
4. The Louisiana Governor
Appoints 6 of the 8 members of the Orleans Levee Board
5. Louisiana Congressmen and women, and Louisiana Senators.
These individuals receive analysis and recommendations from the Army Corps of Engineers, decide priorities, draft legislation to fund priority proposals, and lobby other members of Congress to see them passed.
The first question in examining the levee failures that allowed New Orleans and the surrounding areas is "Who all knew that the levees were sinking and weakening?
1. The US Army Corps of Engineers knew the levees were sinking:
IMPACTS OF BUDGET SHORTFALL. In Orleans Parish, two major pump stations are threatened by hurricane storm surges. Major contracts need to be awarded to provide fronting protection for them. Also, several levees have settled and need to be raised to provide the design protection. The current funding shortfalls in fiscal year 2005 and fiscal year 2006 will prevent the Corps from addressing these pressing needs.
CoE Press Release
2. The St. Bernards Parish Levee Board knew the levees were sinking:
On the eve of hurricane season, St. Bernard Parish's levees are in good shape except for several stretches that are more than two feet lower than they should be, according to the head of the Lake Borgne Basin Levee District.
Levee District Executive Director Bob Turner said the levees passed their annual inspection this month with the Army Corps of Engineers, although the district is still hoping to get $4 million to $6 million in federal money to lift some low spots to the preferred 17 ½-foot level.
Turner said the hurricane levees are about two feet lower than they should be for 3,000- to 4,000-foot stretches along the Mississippi River-Gulf Outlet between Bayou Bienvenue and Bayou Dupre. There are also low spots between Verrett and Caernarvon.
Link
3. Governor Blanco knew the whole coast was sinking, and lobbied for and received $540 million to do something about it.
Louisiana is in good financial shape to begin the job of rebuilding its disappearing coastline, Gov. Kathleen Blanco said Wednesday, although there are nagging concerns about how the state can spend $540 million in federal money included in the energy bill approved in July.
Link
4. The Orleans Levee Board knew the levees were sinking:
From Levee Board for the New Orleans Levee District minutes, March 1, 2005,
Mr. Spencer introduced Mr. Al Naomi, project manager for the USACE to address any questions the Committee may have concerning projects. Mr. Naomi reported that we do have a critical funding need. There are four major projects in Orleans Parish; protecting Pump Station 3 on Broad Street, protecting Pump Station # 7 at the Orleans Avenue Canal, the Robert E. Lee Bridge, over London Avenue Canal and a major levee enlargement in East New Orleans. This levee is approximately 3 feet below grade. All of these projects are vital in protecting the city. Should one of the pump stations fail because of storm surge, it would be very critical. Each pump station costs approximately $10 million to protect, the levee enlargement project cost is $5 million.
Orleans Levee District Board Minutes, March 01 2005
If the sinking levees were common knowlege among all or nearly all of those responsible for them, and were labelled "extremely critical" by the Orleans Levee District Board, what actions did each of them take to address the problem?
The Corps of Engineers did little or nothing, but not because they didn't want to. They simply were not granted the funding necessary to perform the scheduled levee lifts:
""I needed $11 million this year, and I got $5.5 million," Naomi said. "I need $22.5 million next year to do everything that needs doing, and the first $4.5 million of that will go to pay four contractors who couldn't get paid this year."
Naomi said the corps already owes four contractors more than $2 million for hurricane protection work they've done this year without pay, and he expects the figure to climb to about $4.5 million by Sept. 30, the end of the federal fiscal year."
Link
That's not to say that the CoE was destitute:
Before Hurricane Katrina breached a levee on the New Orleans Industrial Canal, the Army Corps of Engineers had already launched a $748 million construction project at that very location. But the project had nothing to do with flood control. The Corps was building a huge new lock for the canal, an effort to accommodate steadily increasing barge traffic.
Except that barge traffic on the canal has been steadily decreasing.
In Katrina's wake, Louisiana politicians and other critics have complained about paltry funding for the Army Corps in general and Louisiana projects in particular. But over the five years of President Bush's administration, Louisiana has received far more money for Corps civil works projects than any other state, about $1.9 billion; California was a distant second with less than $1.4 billion, even though its population is more than seven times as large.
Much of that Louisiana money was spent to try to keep low-lying New Orleans dry. But hundreds of millions of dollars have gone to unrelated water projects demanded by the state's congressional delegation and approved by the Corps, often after economic analyses that turned out to be inaccurate. Despite a series of independent investigations criticizing Army Corps construction projects as wasteful pork-barrel spending, Louisiana's representatives have kept bringing home the bacon.
For example, after a $194 million deepening project for the Port of Iberia flunked a Corps cost-benefit analysis, Sen. Mary Landrieu (D-La.) tucked language into an emergency Iraq spending bill ordering the agency to redo its calculations. The Corps also spends tens of millions of dollars a year dredging little-used waterways such as the Mississippi River Gulf Outlet, the Atchafalaya River and the Red River -- now known as the J. Bennett Johnston Waterway, in honor of the project's congressional godfather -- for barge traffic that is less than forecast.
In fact, barge traffic on the canal had been plummeting since 1994, but the Corps left that data out of its study. And barges have continued to avoid the canal since the study was finished, even though they are visiting the port in increased numbers.
Link
Before claiming that the CoE misspent their funding, or misjudged what the priorities should have been, it is important to understand the limits placed on the CoE's ability to decide priorities and allocate funding. The CoE can't build anything on their own, they have to have a congressional mandate, and external funding. Funding bills are introduced into the US Congress or Senate by Louisiana Congressmen and Congresswomen. Louisiana Congress representatives take their cues from campaign contributors, and from the Orleans Levee Board, specifically, the Board of Commissioners of the Orleans District.
"In fact, more than any other federal agency, the Corps is controlled by Congress; its $4.7 billion civil works budget consists almost entirely of "earmarks" inserted by individual legislators. The Corps must determine that the economic benefits of its projects exceed the costs, but marginal projects such as the Port of Iberia deepening -- which squeaked by with a 1.03 benefit-cost ratio -- are as eligible for funding as the New Orleans levees."
Link
But the Orleans Levee Board has other, higher priorities than maintaining the levees:
Fantasy island Times-Picayune, The (New Orleans, LA) February 2, 2005
Between 1989 and 1997, the Orleans Levee Board squandered $2.8 million on plans for an artificial island in Lake Pontchartrain. Supporters wanted to dredge the lake bottom to build a 4-mile-long island with beaches, fishing and camping areas, hotels and an amusement park.
Levee Board settles suit for $45,000 - Orleans agency spied on radio show host Times-Picayune, The (New Orleans, LA) June 4, 2005 Author: Frank Donze Staff writer Estimated printed pages: 2
Nearly four years after radio talk show host Robert Namer filed an invasion of privacy lawsuit against the Orleans Levee Board for hiring private investigators to spy on him, the agency has settled the case for $45,000.
As part of the deal, Namer also has received $15,000 from Gerard Metzger, a lawyer under contract with the Levee Board who coordinated a yearlong probe into Namer's background at taxpayer expense.
Namer said that while he is pleased with the settlement, he is "saddened" that the money didn't come out of the pockets of board President James Huey and the other "rogue" staff members who orchestrated the cloak-and-dagger investigation of a man who for years has been the board's most vocal critic.
Records show that the Levee Board spent about $45,000 on the investigation that Huey launched in early 1997 and ended about a year later. Counting nearly $14,000 in legal expenses to settle the Namer suit, the entire escapade cost Orleans Parish taxpayers about $104,000.
By 1998, Louisiana's state government had a $2 billion construction budget, but less than one tenth of one percent of that -- $1.98 million -- was dedicated to levee improvements in the New Orleans area. State appropriators were able to find $22 million that year to renovate a new home for the Louisiana Supreme Court and $35 million for one phase of an expansion to the New Orleans convention center.
No new state money had been allocated to the area's hurricane protection projects as of October of 2002, leaving the available 65 percent federal matching funds for such construction untouched.
Louisiana Commissioner of Administration Mark Drennen told local officials that, if they reduced their requests for state funding in other, less critical areas, they would have a better chance of getting the requested funds for levee improvements. The newspaper reported that in 2000 and 2001, "the Bond Commission has approved or pledged millions of dollars for projects in Jefferson Parish, including construction of the Tournament Players Club golf course near Westwego, the relocation of Hickory Avenue in Jefferson (Parish) and historic district development in Westwego."
There is no record of such discretionary funding requests being reduced or withdrawn, but in October of 2003, nearby St. Charles Parish did receive a federal grant for $475,000 to build bike paths on top of its levees.
Earlier this year, the levee board did complete a $2.5 million restoration project. After months of delays, officials rolled away fencing to reveal the restored 1962 Mardi Gras fountain in a four-acre park featuring a new 600-foot plaza between famous Lakeshore Drive and the sea wall. Link
More recently, this year, in fact, minutes from the Orleans Levee Board meetings show that the following projects also received higher priority and funding than scheduled levee maintenence:
*To award a contract to Lou-Con, Inc., the lowest responsible bidder, in the amount of $118,000.00, and to establish a budget in the amount of $135,000.00 to include contingencies, for the New Orleans Lakefront Airport Fuel Farm Tank Cleaning and Mechanical Improvements Project; and to authorize the President or Chief Engineer to sign any and all documents necessary to carry out the above.
Orleans Levee District Board Minutes, July 20, 2005
*To authorize the District to seek bids for equipment, infrastructure and maintenance for the Marina fuel facility at South Shore Harbor in accordance with State law, with a maximum authorized expenditure of $110,000, with funding from the FY 2005 Capital Improvement Projects Budget; to direct that the recommendation of the lowest responsible bidder be brought to the Board for its approval and authorization for final funding; to direct that the Executive Director determine if additional personnel are needed at South Shore Harbor and that he report his findings to the Planning, Engineering and Construction Committee; and to authorize the President or Executive Director to sign any and all documents necessary to carry out the above.
*To increase the budget for the contract with Barriere Construction Co., LLC, for the Orleans Marina Parking Lot and Bulkhead Fill Project to $100,000, and that application be made for the amount over the grant funding provided by FEMA of $92,446.53; and to authorize the President and/or Chief Engineer to sign any and all documents to accomplish the above.
Orleans Levee District Board Minutes, February 16, 2005
*To increase the budget for the contract with Pavement Maintenance Unlimited, LLC for the Sealcoating of New Orleans Lakefront Airport Taxiways and Runways to $478,000, to provide for additional work authorized by the FAA to reconstruct the south end runway access road under this grant, and to provide that the amount over the grant funding by the FAA of $422,750 and DOTD of $35,000 be funded from the Orleans Levee District FY 2005 Major Maintenance and Capital Improvement Budget – New Orleans Lakefront Airport Runway Repair South End Access Road; and to authorize the President and/or Chief Engineer to sign any and all documents to accomplish the above.
Orleans Levee District Board Minutes, January 19, 2005
*To authorize Morrison Insurance Agency to procure Option 2 Workers’ Compensation insurance coverage from LWCC for a three year period, commencing July 1, 2005 and ending July 1, 2008, at the maximum estimated annual premium of $400,183, with the final premium subject to audit, from funds provided in the FY 2006 General Operating Budget and from funds to be budgeted in the FY 2007 and FY 2008 General Operating Budgets, and in accordance with provisions set forth in the RFP; and to authorize the President or Executive Director to sign any and all documents necessary to carry out the above.
Orleans Levee District Board Minutes, June 15, 2005
The Orleans Levee Board claims that these pork projects are funded by a General Projects Account, which does not affect the Levee and Protection Project funding, which comes from the SLIP account. What they don't clarify when making these claims is that the SLIP account directly funds the General account, by the board's decree, to the tune of $3.5 million per yer:
Commissioner Cynthia Willard-Lewis asked of the remaining unfunded projects, “does the lack of funding and the lack of implementation on any of those projects jeopardize the public safety or our ability to execute levee protection?” Ms. Herbert answered “no”. and added that these projects relate to and are funded by the General Operating Budget and anything that would relate to flood protection would come out of the SLIP Fund, the Special Levee Improvement Fund.
Ms. Herbert stated that the FY 2006 SLIP Fund Budget has a transfer to the General Fund of $3.225 million which is the same amount as FY 2005. For subsequent budgets the amount is projected to remain constant. Funding of FY 2006 will provide for promenades on Lakeshore Drive at the shelter-houses.
Orleans Levee District Finance Board Minutes, January 04, 2005
Unfortunately, poor judgement and mis-managed priorities were not all that prevented the Levee Board and Louisiana state government from maintaining the levee system, significant funding was also wasted and diverted via corruption and graft:
Abuse found in program steering work to disadvantaged businesses The Advocate (Baton Rouge, La.) November 27, 2003
Program managers at the Levee Board and the RTA did not conduct required site visits for as many as 50 percent of the companies they certified, the report said.
Several certified firms were controlled by nonminorities and, in some cases, the firms were merely fronts, the report said.
The transportation department said it believed that more than 60 percent of the contracts awarded under the program were influenced by political patronage. The investigation also found several DBE company owners who exceeded the department's $750,000 limit on net worth.
U.S. Attorney Jim Letten also has been exploring aspects of the city's DBE programs as part of a criminal probe into corruption at City Hall. Letten's office has subpoenaed various documents, including the applications of numerous businesses seeking to be certified as disadvantaged.
Vitter said the Transportation Department report in some ways is "astounding" because 60 percent of vendors interviewed said they believed they needed to make political contributions to get work.
Link
Governor Kathleen Blanco says if the state is forced to pay back the federal government more than 30 million dollars, the state's children and sick will suffer. This week, FEMA officials sent a letter demanding back 30.4 million dollars back in misspent flood buyout money.
Governor Blanco is very concerned about that FEMA demand letter. She says the state simply does not have that kind of money just laying around. Blanco says a 30 million dollar hit to the state budget would be devastating.
"The regretful thing is if we have to come up with 30 million dollars, it takes away from children, it takes away from the sick... you know, very, very important initiatives."
According to FEMA, the Louisiana Office of Homeland Security which is the overseeing agency misspent the money over a five-year period. The money is for buying out homes that habitually flood.
The letter references a federal Office of Inspector General's report which lists, among other ineligible expenses, a 2002 Ford Crown Victoria, audio and video equipment, office supplies, travel, professional dues, charitable donations, an L.L. Bean briefcase, a rain coat, and a trip to Germany by a Louisiana Homeland Security person as money that has to be sent back.
"I'm hoping that we can demonstrate that it was used for the proper function that it was intended," says Blanco.
Link
Summary, conclusions, and projections:
These are the reasons why St. Bernards Parish flooded, as evidenced above.
1. The levees sank into the marsh.
2. The money to fix the sunken levees was instead spent on airports, marinas, promenades, and fountains, with the great bulk of all funding being directed towards a lock that benefits a very few shipping companies.
Can we expect the way levees are maintained and funding is allocated in Louisiana and New Orleans to change as a result of the disaster wrought by Hurricane Katrina?
From the Washington Post, in a word, "No."
"Louisiana's congressional delegation has requested $40 billion for Army Corps of Engineers projects in the wake of Hurricane Katrina, about 10 times the annual Corps budget for the entire nation, or 16 times the amount the Corps has said it would need to protect New Orleans from a Category 5 hurricane.
Louisiana Sens. David Vitter (R) and Mary Landrieu (D) tucked the request into their $250 billion Hurricane Katrina Disaster Relief and Economic Recovery Act, the state's opening salvo in the scramble for federal dollars.
The bill, unveiled last week, would create a powerful "Pelican Commission" controlled by Louisiana residents that would decide which Corps projects to fund, and ordered the commission to consider several controversial navigation projects that have nothing to do with flood protection. The Corps section of the Louisiana bill, which was supported by the entire state delegation, was based on recommendations from a "working group" dominated by lobbyists for ports, shipping firms, energy companies and other corporate interests."
Link
Just prior to the storm, Governor Blanco complained that the $540 million awarded to Louisiana for flood control projects might actually have to be used for flood control projects:
Louisiana is in good financial shape to begin the job of rebuilding its disappearing coastline, Gov. Kathleen Blanco said Wednesday, although there are nagging concerns about how the state can spend $540 million in federal money included in the energy appropriations bill approved in July.
But Blanco and other state officials said they're still waiting for confirmation from the federal Department of Interior, which administers the energy money.
Blanco is also concerned about Bush's insistence that the state must be responsible for 50 percent of the cost of the coastal restoration projects. Past Water Resources Development projects have required only a 35 percent match from the state. I frankly find that a little insulting, that he's asking for a 50-50 split when it's never been asked for before," she said. She said she hopes that provision won't make it into the final version approved by Congress.Link
Clearly, nothing has changed since Katrina flooded New Orleans. The above articles indicate that no lessons have been learned, and business and political incompetence and corruption continue as usual, with any residents of New Orleans who choose to return risking their lives, in ignorance of the fact that they are the only ones who seem to care about levees that do what they are supposed to do, protect New Orleans from flooding.
Regardless of the specifications to which post-Katrina levees are designed, until and unless the political status quo in Louisiana undergoes drastic upheaval, the next Cat-5 doomsday storm will tear them apart, and America will again be liable for reconstruction costs measured in appreciable fractions of one trillion dollars.
6
posted on
11/07/2005 9:01:48 PM PST
by
jeffers
To: jeffers
Engineers. Bah.
There was too much water - DUH!
7
posted on
11/07/2005 9:03:07 PM PST
by
SteveMcKing
("I was born a Democrat. I expect I'll be a Democrat the day I leave this earth." -Zell Miller '04)
To: jeffers
To: jeffers; Brilliant; Gumdrop; nuconvert; visitor; Barnyard; carola; 1903A3; babble-on; ...
Ping.
The final Section of the New Orleans levee assessment is posted.
9
posted on
11/07/2005 9:05:42 PM PST
by
jeffers
To: jeffers
10
posted on
11/07/2005 9:22:01 PM PST
by
Spktyr
(Overwhelmingly superior firepower and the willingness to use it is the only proven peace solution.)
To: jeffers
Where was I for the first 4 threads? I have some reading to do! Thanks for the ping. You do excellent work.
11
posted on
11/07/2005 9:28:46 PM PST
by
HoHoeHeaux
("Bayou Farewell")
To: jeffers
12
posted on
11/07/2005 9:37:12 PM PST
by
js1138
(Great is the power of steady misrepresentation.)
To: jeffers
Amazing bit of work - thank you jeffers.
Marking my place to begin reading tomorrow.
13
posted on
11/07/2005 10:05:12 PM PST
by
daybreakcoming
(May God bless those who enter the valley of the shadow of death so that we may see the light of day.)
To: jeffers
Who needs a commission, you have already done the investigation. Thanks.
14
posted on
11/07/2005 11:06:43 PM PST
by
AdmSmith
To: jeffers
Amazing series of reports. Thank you for all the research. Too bad it doesn't get this coverage by the MSM.
To: Arizona Carolyn
To: jeffers
Great overview and great details, well-organized and well-presented. You thought of everything and deserve a national award. I hope that you will be bringing this out in book form.
17
posted on
11/08/2005 5:07:53 AM PST
by
syriacus
(Bowling for Columbine's youthful angst + Fahrenheit 9/11's political passion = MOOLIGANism)
To: jeffers
Heard a rumor that there could have been a pool construction violation at the place of the
breach on the 17th St Canal. They are saying that they could have cut into the levee to build the pool. The backyards of the houses that are along the 17th st. canal are finished off by the levee wall (does that make sense?)
Since there are so many faults to find such as poor design, soil failure etc... I thought i would throw this out there. Not that this was the only levee that broke mind you.
To: jeffers
Thanks, jeffers! Great work.
19
posted on
11/08/2005 7:04:44 AM PST
by
umbagi
(Austin)
To: jeffers
20
posted on
11/08/2005 7:36:08 AM PST
by
Ellesu
(www.thedeadpelican.com)
Navigation: use the links below to view more comments.
first 1-20, 21-40, 41-49 next last
Disclaimer:
Opinions posted on Free Republic are those of the individual
posters and do not necessarily represent the opinion of Free Republic or its
management. All materials posted herein are protected by copyright law and the
exemption for fair use of copyrighted works.
FreeRepublic.com is powered by software copyright 2000-2008 John Robinson